
Rapid identification of Psathyrostachys huashanica Keng chromosomes in wheat background based on ND-FlSH and SNP array methods
2023-10-16 01:32:32LlJiachuangLlJiaojiaoZHAOLiZHAOJixinWUJunCHENXinhongZHANGLiyuDONGPuhuiWANGLimingZHAODehuiWANGChunpingPANGYuhui
Journal of Integrative Agriculture 2023年10期
Ll Jia-chuang ,Ll Jiao-jiao ,ZHAO Li ,ZHAO Ji-xin ,WU Jun ,CHEN Xin-hong,ZHANG Li-yuDONG Pu-huiWANG Li-mingZHAO De-hui,WANG Chun-ping#,PANG Yu-hui#
1 College of Agronomy,Henan University of Science and Technology,Luoyang 471023,P.R.China
2 The Shennong Laboratory,Henan Provience,Zhengzhou 450002,P.R.China
3 College of Agronomy,Northwest A&F University,Yangling 712100,P.R.China
Abstract Psathyrostachys huashanica Keng (2n=2x=14,NsNs) is regarded as a valuable wild relative species for common wheat cultivar improvement because of its abundant beneficial agronomic traits. However,although the development of many wheat–P.huashanica-derived lines provides a germplasm base for the transfer of excellent traits,the lag in the identification of P.huashanica chromosomes in the wheat background has limited the study of these lines. In this study,three novel nondenaturing fluorescence in situ hybridization (ND-FISH)-positive oligo probes were developed. Among them,HS-TZ3 and HS-TZ4 could specifically hybridize with P.huashanica chromosomes,mainly in the telomere area,and HS-CHTZ5 could hybridize with the chromosomal centromere area. We sequentially constructed a P.huashanica FISH karyotype and idiogram that helped identify the homologous groups of introduced P.huashanica chromosomes.In detail,1Ns and 2Ns had opposite signals on the short and long arms,3Ns,4Ns,and 7Ns had superposed two-color signals,5Ns and 6Ns had fluorescent signals only on their short arms,and 7Ns had signals on the intercalary of the long arm. In addition,we evaluated different ways to identify alien introgression lines by using low-density single nucleotide polymorphism (SNP) arrays and recommended the SNP homozygosity rate in each chromosome as a statistical pattern. The 15K SNP array is widely applicable for addition,substitution,and translocation lines,and the 40K SNP array is the most accurate for recognizing transposed intervals between wheat and alien chromosomes. Our research provided convenient methods to distinguish the homologous group of P.huashanica chromosomes in a common wheat background based on ND-FISH and SNP arrays,which is of great significance for efficiently identifying wheat–P.huashanica-derived lines and the further application of Ns chromosomes.
Keywords: Psathyrostachys huashanica,Ns chromosomes,ND-FISH,SNP array,common wheat
1.Introduction
The wild relative species of wheat contain diverse genetic variations that can be applied reasonably for common wheat breeding (Smithet al.1986;Liuet al.2014). Better-known species inTriticeae,includingAegilopstauschii,Secalecereal,Thinopyrumelongatum,Agropyroncristatum,Haynaldiavillosa,Hordeum vulgare,andLeymusracemosus,have all undergone distant hybridization with common wheat and have developed numerous outstanding wheat–alien-derived lines that have played a large role in the process of wheat germplasm innovation (Hegde and Waines 2004;Molnár-Lánget al.2016).PsathyrostachyshuashanicaKeng (2n=2x=14,NsNs) is an endangered species fromHordeinaethat naturally grows in the high altitude area of Huashan Mountain (Shaanxi,China) (Baden 1991).Because of its many desired traits,such as high tolerance to wheat disease and abiotic stress (Ørgaard and Heslop-Harrison 1994;Songet al.2013),P.huashanicawas chosen to cross with common wheat,and different types of derived lines were obtained by scientists mainly in China and Japan (Chen 1991;Kishiiet al.2010). To further utilize these new lines,we should first clarify the size and homologous group of alien chromosomes(Liet al.2020). Currently,the common methods to identifyP.huashanicaNs chromosomes are based on genomicinsituhybridization (GISH),molecular markers and protein electrophoresis,such as the identification ofP.huashanica1Ns-7Ns chromosomes using wheat sequence-tagged site markers (STSs) (Duet al.2014b;Baiet al.2020;Liuet al.2021);the identification ofP.huashanica1Ns and 6Ns chromosomes using SDSPAGE and A-PAGE protein electrophoresis,respectively(Zhaoet al.2010;Duet al.2013);and the identification of 2Ns,3Ns,5Ns,and 7Ns chromosomes usingP.huashanicasequence-characterized amplified region markers (SCARs) (Suet al.2015;Liet al.2019;Tanet al.2021). However,these relatively slow and laborious methods may limit the efficiency of material identification,which is a disadvantage for large-batch screening (Tanget al.2018). Therefore,for better use of valuable genes ofP.huashanicato accelerate wheat improvement,more efficient and convenient ways to analyzeP.huashanicachromosomes in wheat backgrounds are desperately needed.
Fluorescentinsituhybridization (FISH) based on repeat sequences was originally used in animal chromosome studies and has been adapted by plant researchers who simultaneously developed nondenatured fluorescentinsituhybridization (ND-FISH) and multicolor fluorescentinsituhybridization (Mc-FISH) (Usluet al.1999;Huet al.2018). FISH is an excellent technology for alien chromosome identification because of its simple procedure and low cost. The genome of wheat crops contains more than 80% repeat sequences,and the positions of these repeat sequences are relatively stable,which allows FISH to be used in the chromosome evolution,recombination,and recognition of wheat and its relative species (Li G Ret al.2021;Zhaoet al.2021).After years of accumulation,several oligo-probes have been developed and applied for FISH experiments.Nonspecies-specific probes,such as pSc119.2,pSc200,pAs1,(GAA)n,pTa71,and pTa535,can successfully hybridize with chromosomes fromTriticumdurum(AABB),common wheat (AABBDD),barley (HH),Agropyron elongatum(EEEE),Haynaldiavillosa(VV),and rye (RR)(Mukai and Gill 1991;Tanget al.2014). Bulk homologyspecific probes Synt1 to Synt7 can hybridize successfully with chromosomes of the homologous Groups 1 to 7(Li G Ret al.2021). Species-specific probes,for instance,HvT01.1,can identify barley chromosomes(Huet al.2018);the combination of 6VS-1 and 6VS-35 can recognize seven pairs ofHaynaldiavillosachromosomes (Leiet al.2020);oligo-1162 and oligo-Ku can only hybridize with rye chromosomes in a wheat background (Xiet al.2020). In terms of wheat–alienderived lines,species-specific probes avoid the tedious process of karyotype comparison between multiple chromosomes,so they are an ideal oligo-probe type.However,P.huashanica-specific oligo probes have not been developed and applied.
Although simple sequence repeat (SSR),STS and SCAR markers are still the main molecular identification methods for the progeny of distant hybridization,with the progress of sequencing technology,the single nucleotide polymorphism (SNP) markers derived from highthroughput methods have gradually become more popular because of their wide coverage,high density,and simple process (Renet al.2022). For common wheat,different density SNP arrays comprising 15K,16K,40K,55K,90K,120K,and 660K have been launched. They are usually employed for gene mapping,marker development,and genetic relationship analysis. Liet al.(2019) were the first to use a SNP array in wheat–alien offspring identificationfor identifying a wheat–P.huashanica5Ns(5D) disomic substitution line. After this,a wheat–Thinopyrumponticum1Js(1D) disomic substitution line was confirmed by Wang Y Zet al.(2020) using a 15K SNP array,and Liuet al.(2022) identified a wheat–Triticumboeoticum4Ab(4B) substitution line using a 55K SNP array. To date,15K,55K,and 660K SNP arrays have been used in wheat–alien-derived line analyses.However,it is still unknown which density of arrays and what analytical methods are more effective for identifying different types of materials.
In the present study,we developed novel oligo probes specific forP.huashanicaNs chromosomes and compared the differences in commonly used lowdensity SNP arrays in distinguishing distant hybridization progeny. The steps of this study were as follows: (i)obtainP.huashanicachromosomes and centromerespecific repeat sequences;(ii) construct the standard FISH karyotype ofP.huashanicachromosomes;and(iii) screen the optimal combination of SNP arrays and analysis methods for material identification.
2.Materials and methods
2.1.Plant materials
The materials used in this study included common wheat 7182,P.huashanica,and their progenies,which included disomic addition,substitution,and translocation lines.Relative species of wheat,includingHordeumvulgare,Secalecereale,andLeymusracemosus,were employed as controls. All materials and their information are listed in Table 1.Psathyrostachyshuashanicagenomic DNA was extracted from leaf tissues using the standard cetyltrimethylammonium ammonium bromide method and purified using RNase. All materials were deposited at the College of Agronomy,Northwest A&F University,China.
2.2.Cytogenetic preparations
Germinated seeds were cultivated on wet filter paper in a 25°C incubator. Root tips were collected when their lengths were 1–2 cm,and young spikes were collected when their lengths were 3–4 cm. Samples were pretreated in an ice bath for 24 h before transfer to Carnoy’s fixative fluid (ethanol:glacial acetic acid mixture at 3:1,v/v) and stored at–20°C. Preliminary processing was as follows: the root meristems were rinsed with 1× TE buffer and then digested in a mixed enzyme solution (2%cellulase,1% pectinase,and 1% macerozyme,Yakult,Japan) in a 37°C water bath for 65 min. The root tip cell(RTC) mixture was suspended in acetic acid for dripping.Anthers were taken from central to polar spikes for target stages of meiosis and then stained with 1% acetocarmine. The suitable slides were selected and stored at 16°C forinsituhybridization.
Table 1 The materials used in this study
2.3.Construction of the Cot-1 DNA library of P.huashanica
PurifiedP.huashanicagenomic DNA was diluted using 0.3 mol L–1NaCl solution to a concentration of 500 ngµL–1. The DNA was placed in a 5-mL centrifuge tube and sterilized three to five times in an autoclave for 5 min each time until the DNA fragments ranged between 100 and 1 000 bp in size. The first step was to calculate the reannealing time using the formulaCot=1=C (mol L–1)×Ts,where C is the number of nucleotides per liter,andTs is the reannealing reaction time in seconds. In this experiment,the sheared DNA was at a concentration of 500 ng µL–1,which was equivalent to 0.5 g L–1. One mole of dNTPs equal to an average of 339 g mol–1was obtained from Sigma (Sigma-Aldrich,Germany).Therefore,the reannealing time was equal to 1×(339 g mol–1)/(0.5 g L–1)=678 s. The sheared DNA in a 5-mL centrifuge tube was placed in a boiling water bath for 10 min and then cooled in ice water for 1 min. The sample was reannealed in 65°C water for the above calculated time. S1 nuclease (1 U mg–1) was used to digest the single-stranded DNA at 37°C for 8 min.DNA was rapidly purified and recovered by using a TIANgel Purification Kit (Tiangen,Beijing) to terminate the function of the S1 nuclease.Cot-1 DNA was mostly a flat terminus that required an ‘A’ added to the end. TheCot-1 DNA was ligated to the pEASY-T1 vector (TransGen,China) and then transformed into competentEscherichia coliDH5α cells for library DNA sequencing.
2.4.Acquisition of the P.huashanica centromeric sequence
Based on the studies by Aragón-Alcaideet al.(1996),Hudakovaet al.(2001),and Divashuket al.(2016),three pairs of primers were designed and synthesized to amplify the centromere sequences ofP.huashanica. The detailed sequences are as follows:primer HS-ch-1,F: 5´-GCATCAAGACCAAGCAAAAC a n d R: 5´-T T A T C A G T A G G C A C C A A C T C(melting temperature (Tm)=53°C);primer HSch-2,F: 5´-TGGTACTTGGCGTCTGTGTG and R:5´-CTCGATTCCCTGTGGAGTA (Tm=55°C);and primer HS-ch-3,F: 5´-TGCATCTATATTCTTGCTTGTT and R:5´-GGTGCCCGATCTTTCGATGAGA (Tm=55°C). The primers were diluted to a concentration of 2.5 µmol L–1,and the concentration ofP.huashanicagenomic DNA was diluted to 100 ng µL–1. PCR was performed using standard conditions: 4 min at 95°C;32 cycles of 50 s at 95°C,50 s at Tm°C,and 50 s at 72°C;and 8 min at 72°C.The amplified products with bright bands were recovered and sequenced.
2.5.Development of an in situ fluorescent probe of P.huashanica
ForP.huashanicaNs chromosomes,oligo probes were developed according to the sequence of theCot-1 DNA library. DNAMAN 6 (Lynnon Biosoft,America)was employed to find overlapping fragments of these sequences in the library. Overlapping DNA fragments with substantial lengths and nonhomology were selected for comparison with nucleotide sequences in the NCBI database (https://blast.ncbi.nlm.nih.gov/Blast.cgi) and Repeat Masking (https://www.girinst.org/censosor/index.php). Selected fragments were compared with each other to obtain repeated sequences that were target regions for probe design. DNA sequences of suitable length were intercepted and then labeled with different fluorophores.Probers that could only successfully hybridize withP.huashanicachromosomes were identified asP.huashanicaNs chromosome special oligo probers.
The centromeric probes were developed from the repeat sequence of theP.huashanicachromosomal centromere. The obtained centromeric sequence was labeled with digoxigenin as a probe to perform theinsituhybridization experiment. Sequences where hybridization signals could be observed were selected for comparative analysis and probe design. The online tool Tandem Repeats Finder version 4.09 (https://tandem.bu.edu/trf/trf.html) was employed for repeat sequence analysis. A low matching sequence interval was obtained and labeled with a fluorophore as a centromeric oligo probe.
2.6.In situ hybridization analysis
Nondenaturedinsituhybridization and genomicinsituhybridization were performed according to Fuet al.(2015)and Li J Cet al.(2021). Oligo primer was dissolved in deionized water to a concentration of 20 ng µL–1,and selected slides were treated with an ultraviolet light cross-linker at 1 250 mJ cm–2for 2 min. Each slide with the probe mixture (2 µL primer solution and 7 µL 1×TE/2×SSC) was incubated in a moisturizing black box at 52°C for 3 h. The mixture was washed using 2×SSC buffer solution and air dried. Vectashield H1200 mounting medium with DAPI (VECTOR,United States) was used to counterstain the chromosomes. Hybridization signals were captured with a fluorescence microscope AxioImager M2 (ZEISS,Germany) with a CCD camera Axiocam 503 and ICc5 (ZEISS).
2.7.Wheat SNP array analysis
Purified genomic DNA of wheat–P.huashanica6Ns disomic addition line DH88,2Ns(2D) disomic substitution line DH2322,T3D·5D·5Ns translocation line TR77,and their parents was hybridized with wheat SNP arrays that included 15K and 55K solid arrays and 16K and 40K liquid arrays. Among them,solid arrays were scanned in China Golden Marker Biotechnology Company (Beijing,China) using Illumina Bead Array microarray technology(Allenet al.2013),and liquid arrays were scanned in MOLBREEDING Biotechnology Co.(Shijiazhuang,China)using Genotyping by Target Sequencing method (Xuet al.2020). The results were analyzed in terms of the equivalence,homozygosity,and deletion rates of all SNP positions on each chromosome. In detail,Equivalence rate=The number of equivalent genotypes between two materials/Total SNP marker number;Homozygosity rate=The number of homozygous genotypes/Total SNP marker number;Deletion rate=The number of NA genotypes/Total SNP marker number. In addition,wheat–P.huashanicatranslocation line TR77 was employed for the precision analysis of four arrays. Line TR77 contained a pair of recombination chromosomes that contain the part of the long arm of the wheat chromosome and the entire short arm plus part long arm of theP.huashanicachromosome. SigmaPlot V12.5 (SYSTAT,USA) and MapChart V2.2 (Wageningen University,Netherlands)were used for drawing.
3.Results
3.1.Analysis of repeat sequences in the P.huashanica Cot-1 DNA library
One hundred positive colonies were randomly selected from the library,and 93 of them were sequenced successfully. Among them,one was from the gliadin family,eight belonged to the Lt1-5 family of repeating sequences,nine were uncharacterized sequences,eighteen belonged to the Lt1-6 family of repeating sequences,and 57 sequences had no matching result.The inserted fragment sizes ranged from 10 to 262 bp.The Lt1 family repeating sequences ofP.huashanicashowed high homology with corresponding family repeats ofLeymustriticoides. Consistency analysis was performed on all Lt1-5 and Lt1-6 repeat sequences,and appropriate length overlaps were obtained. The ends of the obtained sequences were labeled with fluorophores asP.huashanicaNs chromosome group oligo probes(Table 2).
3.2.Chromosome probe signals in P.huashanica and other species
To evaluate the effectiveness of the developed oligoprobes,we conducted FISH experiments with these probes onP.huashanicaand its relative species. DAPI staining was used to identify chromosomes (Fig.1-A1).ForP.huashanica,probe HS-TZ3 had obvious green hybridization signals in chromosomal telomeric regions(Fig.1-A2),and probe HS-TZ4 could successfully hybridize in chromosomal telomeric and subterminalregions with red signals (Fig.1-A3). Simultaneous application of the two probes resulted in overlapping signals in the telomeric region of each chromosome(Fig.1-A4). Among the chromosomes,four pairs of chromosomes carried only green signals on their short arms,and three pairs of chromosomes carried both red and green signals. In addition,the mixture of two probes was used to hybridize with chromosomes of common wheat 7182,Hordeumvulgare,Secalecereal,andLeymusracemosus,in which no fluorescence signal was observed (Fig.1-B–E).
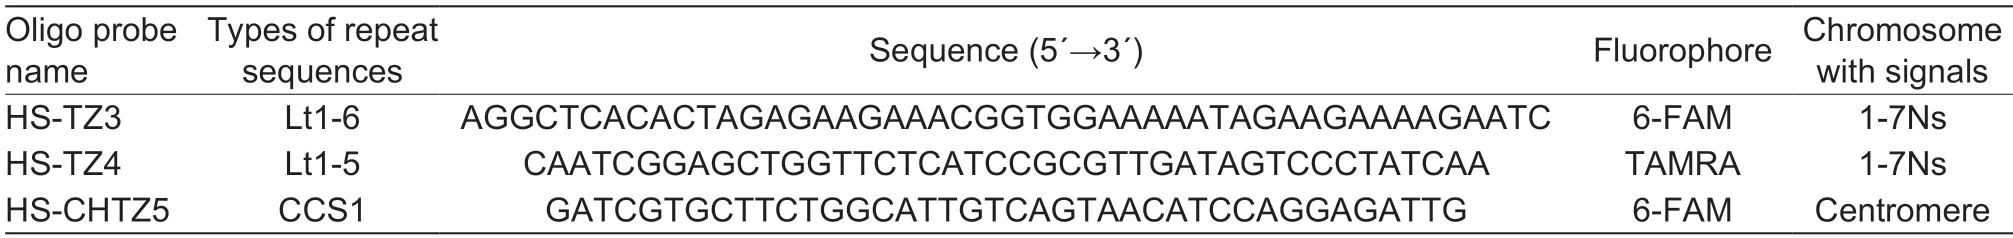
Table 2 The detailed information of Fluorescence in situ hybridization (FISH) probes designed based on repeat sequences in Psathyrostachys huashanica
3.3.FlSH karyotype of seven homologous groups
Nine wheat–P.huashanica-derived lines containing 1Ns–7Ns chromosomes were used to make accurate distinctions of homologous group distributions based on probes HS-TZ3 and HS-TZ4. DAPI staining was used to identify chromosomes (Fig.2-A1–I1). Probe HS-TZ3 generally expressed brighter hybridization signals than probe HS-TZ4 in identical chromosomes (Fig.2-A2–I2 and A3–I3),and only the chromosomes ofP.huashanicahad fluorescence signals in the wheat background (Fig.2-A4–I4). According to the signals on chromosomes of each homologous group,the chromosomal FISH karyotype ofP.huashanicawas recognized (Fig.3-A),and the chromosomal idiogram was drawn to scale (Fig.3-B).Among seven homologous groups,the 1Ns chromosomes had brighter fluorescent signals on their long arms;the 2Ns chromosomes had the opposite signal pattern with 1Ns(i.e.,brighter signals on short arms) and were the longest chromosomes;chromosomes from the third (3Ns),fourth(4Ns) and seventh (7Ns) homologous groups had both red and green signals,but the signals of the three groups were different. In detail,red signals mainly appeared in the telomeric regions of short arms of 3Ns,in the telomeric regions of both arms of 4Ns,and in the telomeric regions of short arms plus intercalary regions of the long arm of 7Ns;the 5Ns and 6Ns chromosomes only expressed green signals on their short arms,but the significant distinction was the ratio of two arms,where the arm ratio >2 was the 5Ns and the arm ratio≈1 was the 6Ns.
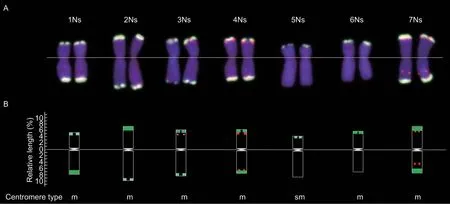
Fig.3 Fluorescence in situ hybridization (FISH) karyotype of Ns chromosomes from Psathyrostachys huashanica based on oligo probes HZ-TZ3 and HZ-TZ4. A,FISH karyotype diagram of P. huashanica chromosomes sorted by homologous group. B,FISH idiogram and centromere type of P.huashanica chromosomes from 1Ns to 7Ns.
3.4.Application of probes in different cell division stages
FISH experiments were performed using developed probe pairs at multiple stages of mitosis and meiosis. Wheat–P.huashanica-derived lines with 2Ns chromosomes and 5Ns chromosomes were used for mitosis stage experiments because the chromosomes of the two homologous groups had different signal types. In mitotic interphase and prophase,four bright green spots could be observed in the nuclear region of 2Ns chromosomes(Fig.4-A1 and A2). However,two green and two red spots were observed on 5Ns chromosomes at the corresponding stages (Fig.4-B1 and B2). In addition,during different meiosis division stages,probe HS-TZ3 could successfully identifyP.huashanicachromosomes in a wheat background. Take wheat–P.huashanica1Ns disomic addition line as the experimental material,two locations of the nuclear region showed green fluorescence signals respectively in metaphase,anaphase,and telophase of meiosis I (Fig.4-C–E,arrows),and at telophase meiosis II,green signals could be seen in the nuclear region of each progeny cell (Fig.4-F,arrows).
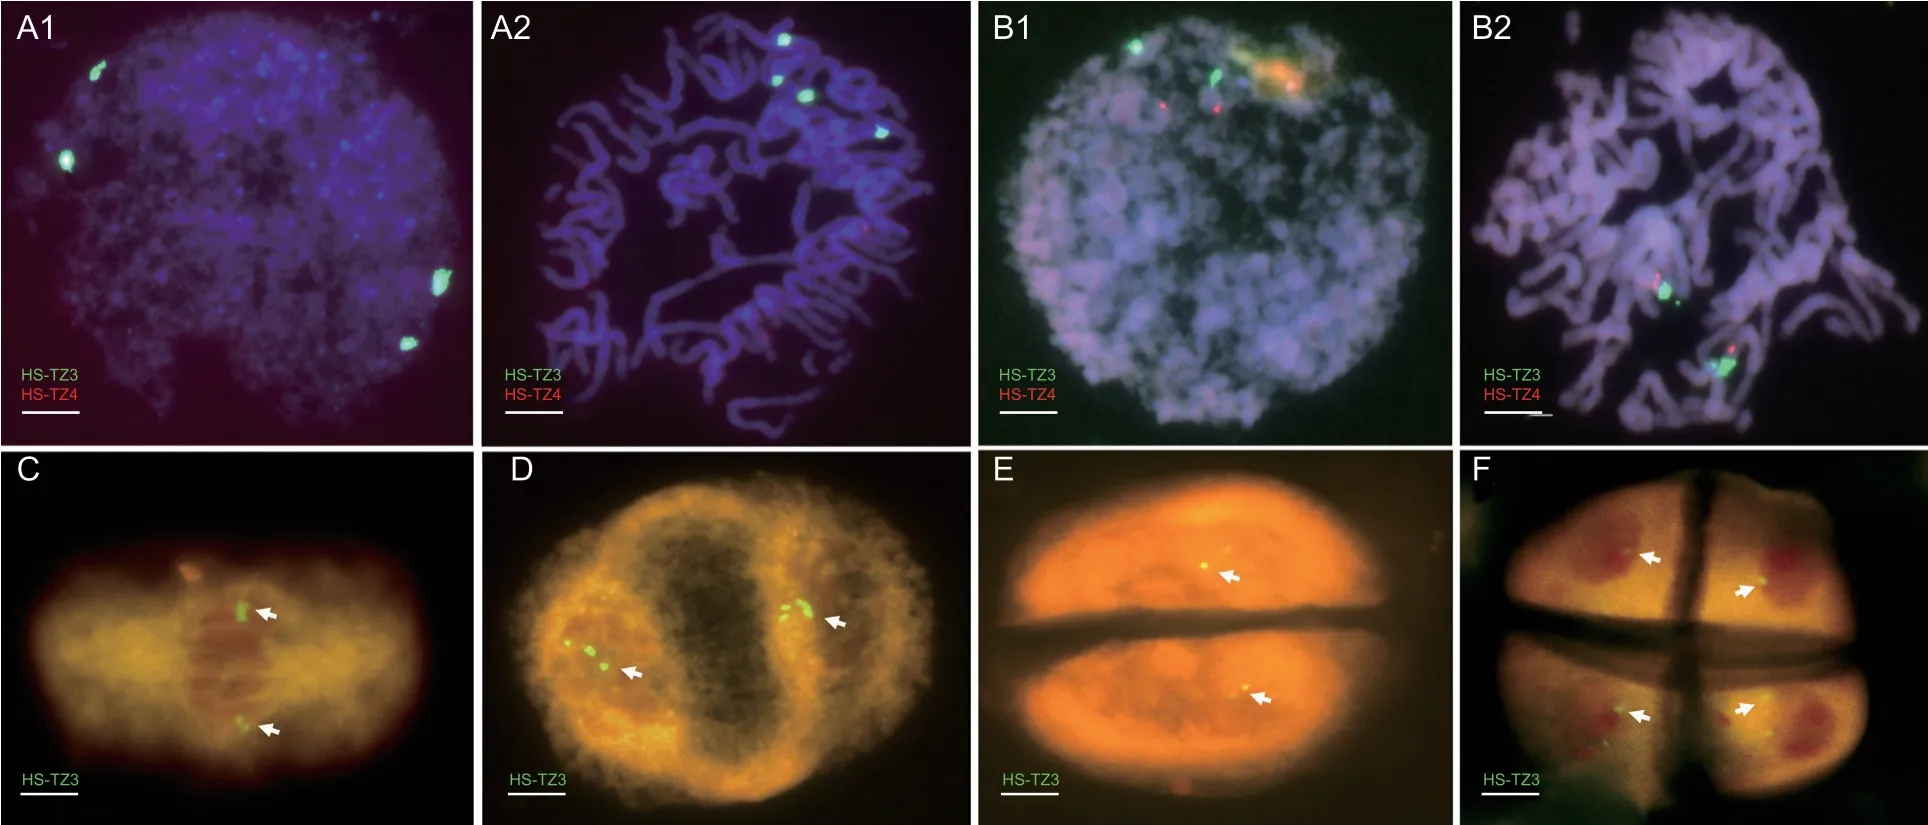
Fig.4 Applicability of developed oligo probes in different cell division stages of wheat–Psathyrostachys huashanica-derived lines.A1–A2,fluorescence in situ hybridization (FISH) experiment using a mixed probe on 2Ns chromosomes in mitotic interphase and prophase stage,four overlaying green fluorescent spots could be observed. B1 and B2,FISH experiment on 5Ns chromosomes,two green and two red fluorescent spots were independently spread on the nucleolus organizer region and leptotene stage chromosomes. C–F,FISH using probe HS-TZ3 on meiosis cells of wheat–P.huashanica 2Ns substitution line. Among them,C was metaphase I;D was anaphase I;E was telophase I;F was telophase II. Chromosomes were counterstained with DAPI (blue).Arrows indicated P.huashanica Ns chromosome. Scale bar,10 µm.
3.5.Centromere probe of P.huashanica chromosomes
Three pairs of primers (i.e.,HS-ch-1,-2,and -3) amplified different sizes of products that were 779,487,and 205 bp,respectively. The PCR products were labeled with digoxin fluorescein and used as probes forinsituhybridization withP.huashanicachromosomes. Only the product of the HS-ch-3 (Fig.5-A) could successfully hybridize with the centromere regionsP.huashanicaand showed yellow–green fluorescence signals (Fig.5-B). The BLAST results showed that the product of HS-ch-3 (GenBank accession number OK318000) was a CCS1-type repeat sequence,and the low-matching regions of OK318000 between wheat andP.huashanicawere used to design a FISH oligo probe (HS-CHTZ5) for the centromere region of chromosomes (Table 2). FISH experiment verification showed oligo probe HS-CHTZ5 could effectively identify the centromere region ofP.huashanica(Fig.5-C).
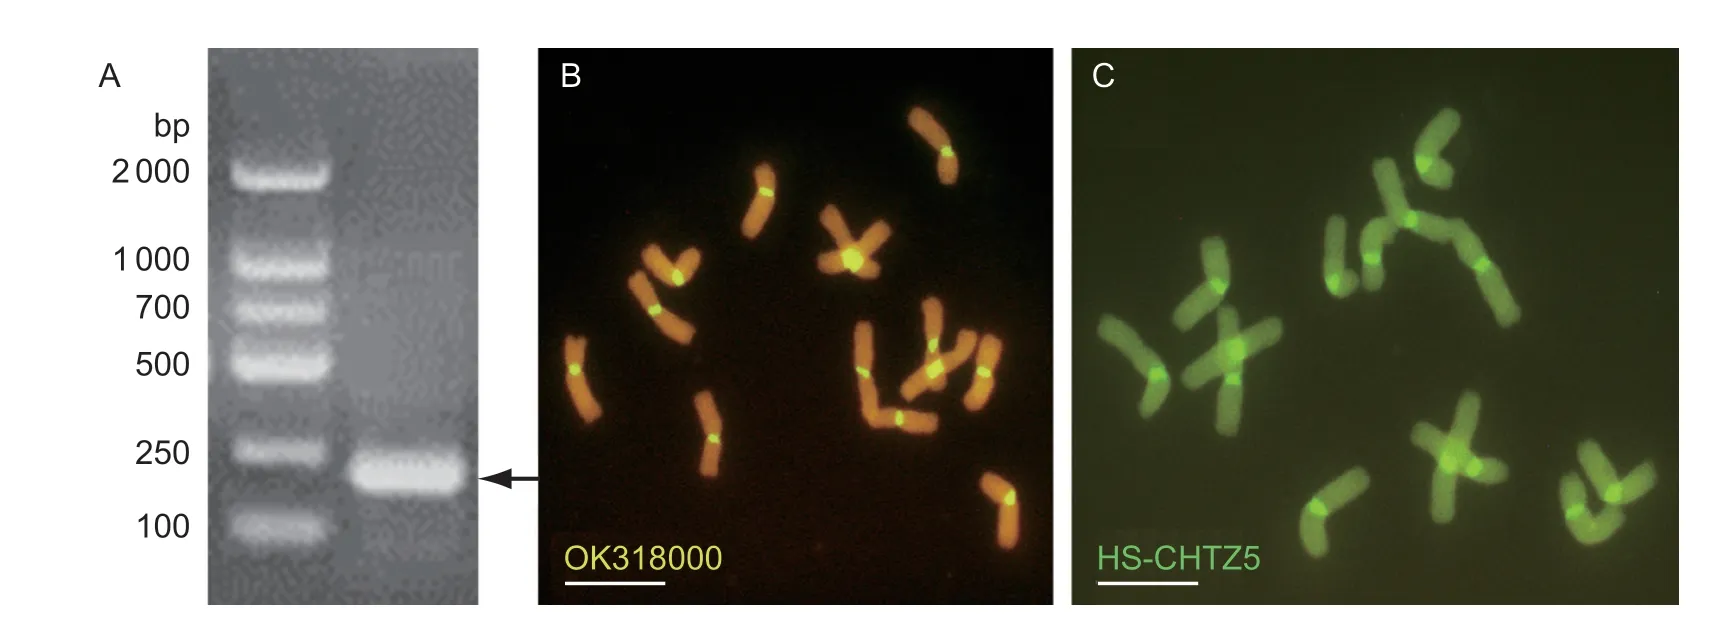
Fig.5 Development and verification of centromere-specific oligo-probe for Psathyrostachys huashanica Ns chromosomes. A,amplification product of the centromeric region using primer HS-ch-3. Arrow indicated the target band. B,DIG-11-dUTP labeled PCR product hybridized with P.huashanica chromosomes. The centromere region showed yellow-green signals. C,developed oligo probe HS-CHTZ5 could successfully identify the centromere region of P.huashanica. Scale bar,10 µm.
3.6.Identification based on SNP array
The genotype results of four arrays (Appendix A) and three statistical methods were used to analyze three wheat–P.huashanica-derived lines that exhibited three different states (i.e.,addition,substitution,and translocation) of alien chromosomes in the wheat background. The results of the different analysis methods for each material using different arrays are shown in Fig.6. In Fig.6,the vertical was each material,and the horizontal was the corresponding analysis method. For the equivalence ratio,four arrays proved that parent wheat 7182 andP.huashanicahad no more than a 20%SNP similarity rate on each chromosome. In addition,wheat 7182 had a high SNP loci homozygosity rate and low deletion rate;in contrast,alien parentP.huashanicahad a low homozygosity rate and high deletion rate.Among the three derived lines,the addition line had low deletion rate values similar to its wheat parent 7182;and the substitution line expressed a distinct difference in peak values that made it easier to distinguish no matter what kinds of analysis method or arrays. Based on the comparison results,a summary table was created to visually show the identification effects of different combinations (Table 3),in which the wide adaptability rank of the SNP array for material identification was 15K>16K=40K>55K.
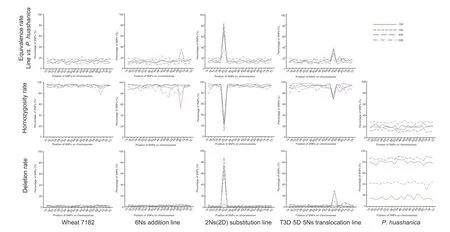
Fig.6 The presentation of various analytical results based on different combinations of four densities of single nucleotide polymorphism (SNP) arrays and three types of statistical methods. Solid-type arrays (15K and 55K) and liquid-type arrays (16K and 40K) were different not just in density but in species preference. There was only 15K SNP that could be used to identify the addition line. All combinations of arrays and statistical methods could be used for substitution line analysis. Statistical methods of homozygosity rate expressed outstanding effects for line analyses. The highest peak of the broken line indicated the abnormal wheat chromosome.
For the detailed detection of translocation line TR77,the GISH experiment first showed that a pair of wheat chromosomes was evidently transposed withP.huashanicachromosome in the long arms closed to the centromere (Fig.7-A). Then,the translocated location in the recombinant chromosome was analyzed by using four kinds of SNP arrays. The result showed that they all were able to recognize the region where chromosomal splicing occurred,and the regions inferred from the four arrays were partially overlapping (Fig.7-B). However,the identified intervals were different,in which 15K,16K,40K,and 55K SNP arrays,respectively,were 11,1,0.2,and 4 Mb. Therefore,the accuracy order based on the recognized result was 40K>16K>55K>15K.
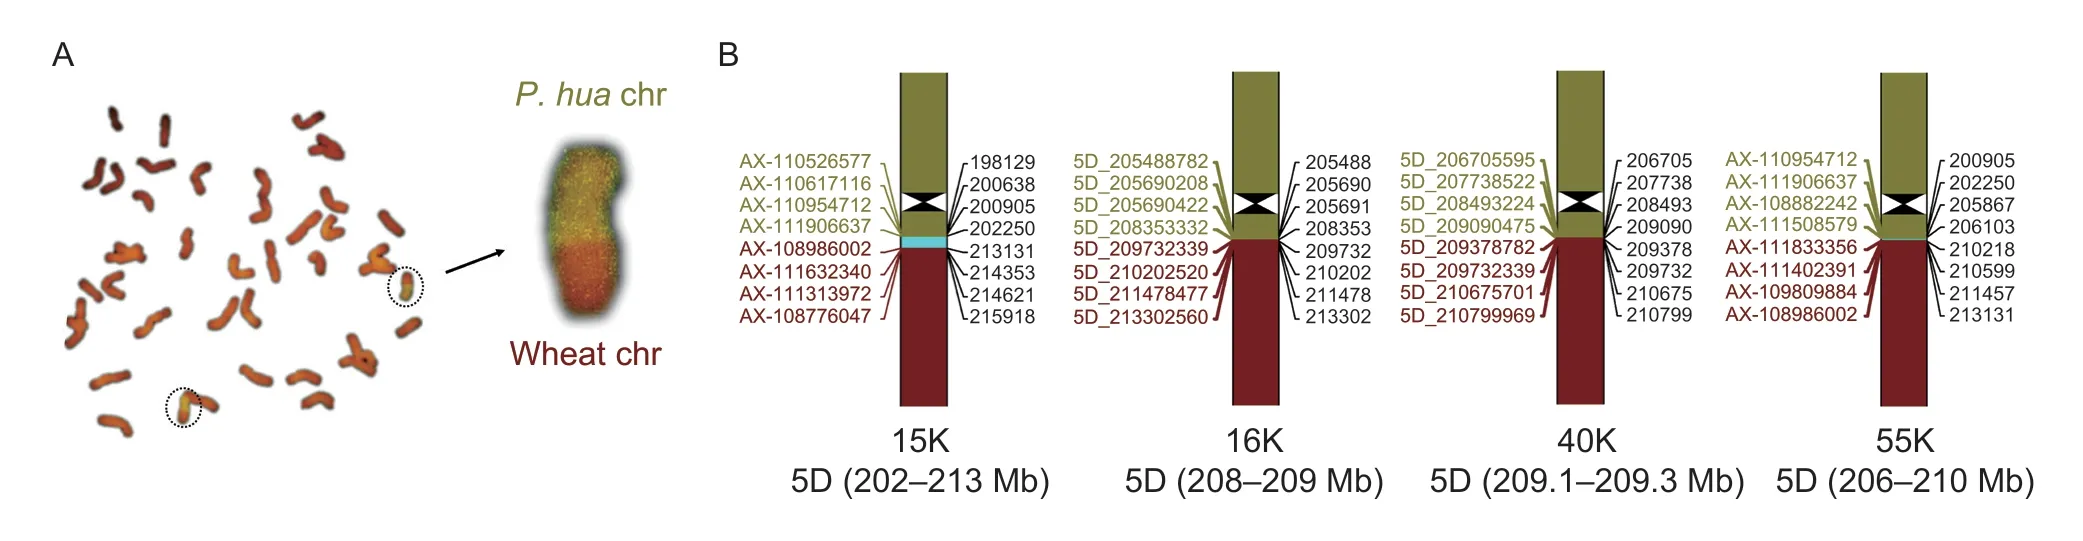
Fig.7 Comparison of four densities of single nucleotide polymorphism (SNP) arrays in identifying the translocated location of fusion chromosome. A,in wheat–Psathyrostachys huashanica translocation line TR77,the translocated chromosomes were identified by genomic in situ hybridization (GISH) to give an intuitive display. B,the physical location of the translocated boundary in the translocated chromosome was determined by 15K,16K,40K,and 55K SNP arrays,and the recognized intervals were 11,1,0.2,and 4 Mb in the 5D chromosome,respectively. Inside the circles were translocated chromosomes.
4.Discussion
4.1.The necessity of rapid identification of alien components in wheat
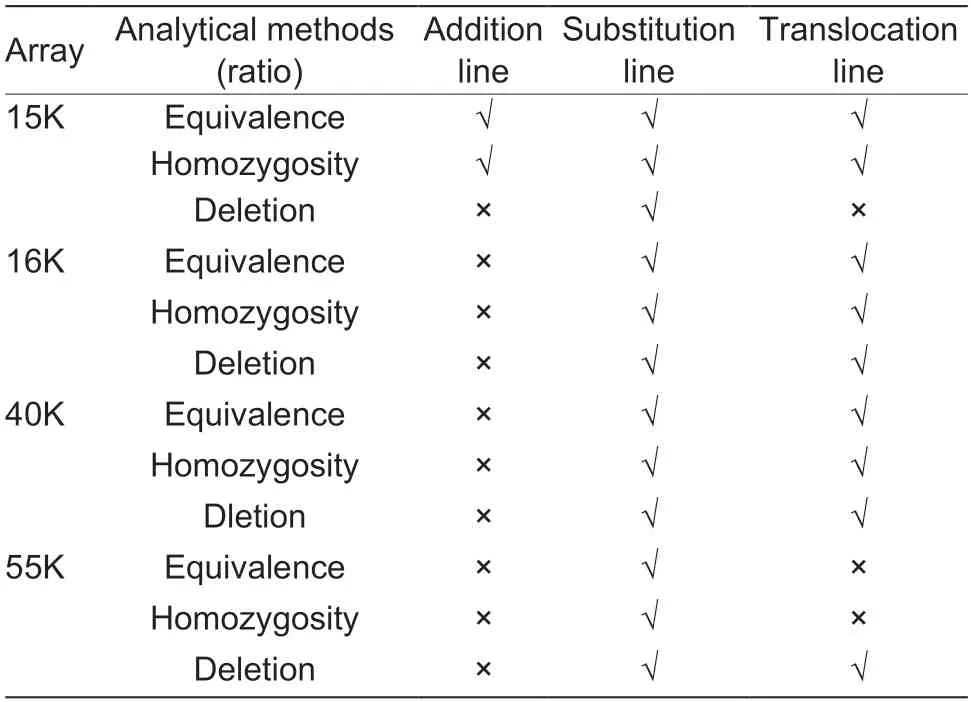
Table 3 Detection accuracy of the four types of SNP arrays on materials under different analysis methods1)
As the second largest grain crop in the world,the production of common wheat is directly related to the national economy and food security. However,in the modern agricultural model,the lost genetic diversity of wheat has made it difficult to achieve further qualitative improvement (Wang H Wet al.2020). The genusTriticeaediverged greatly during evolution,producing different types of genomes,including A,B,D,E,F,G,H,K,M,U,V,R,S,P,Ns,and St (Liet al.2023). Fusion of three sets of genomes gives common wheat greater buffer capacity to accept alien chromosome(s) (Glagolevaet al.2019). Breeding practices have proven that introducing exogenous genetic materials into wheat through distant hybridization and chromosome engineering has great potential to improve its yield and stress tolerance (Liuet al.2014;Xuet al.2023).Psathyrostachyshuashanicais a unique wheat relative species in China that has exhibited extraordinary adaptation to adversity due to its harsh growing environment. If the development of a wheat–alien diploid is an important bridge to introduce excellent genes into wheat,the identification and comprehensive evaluation of wheat–alien-derived lines are the basis of the utilization of these germplasm resources. The genome ofP.huashanicaconsists of seven pairs of chromosomes from 1Ns–7Ns,in which each homologous chromosome results in different agronomic traits of the receptors under the same genetic background(Table 4). However,it is not always accurate to analyze a derived line only from the phenotype,which forces researchers to analyze the chromosomal composition and alien introduction using cytological and molecular methods from a microscopic perspective. Therefore,in the current study,we used ND-FISH technology and high-throughput SNP array markers to rapidly identify chromosomes fromP.huashanicain the wheat background.
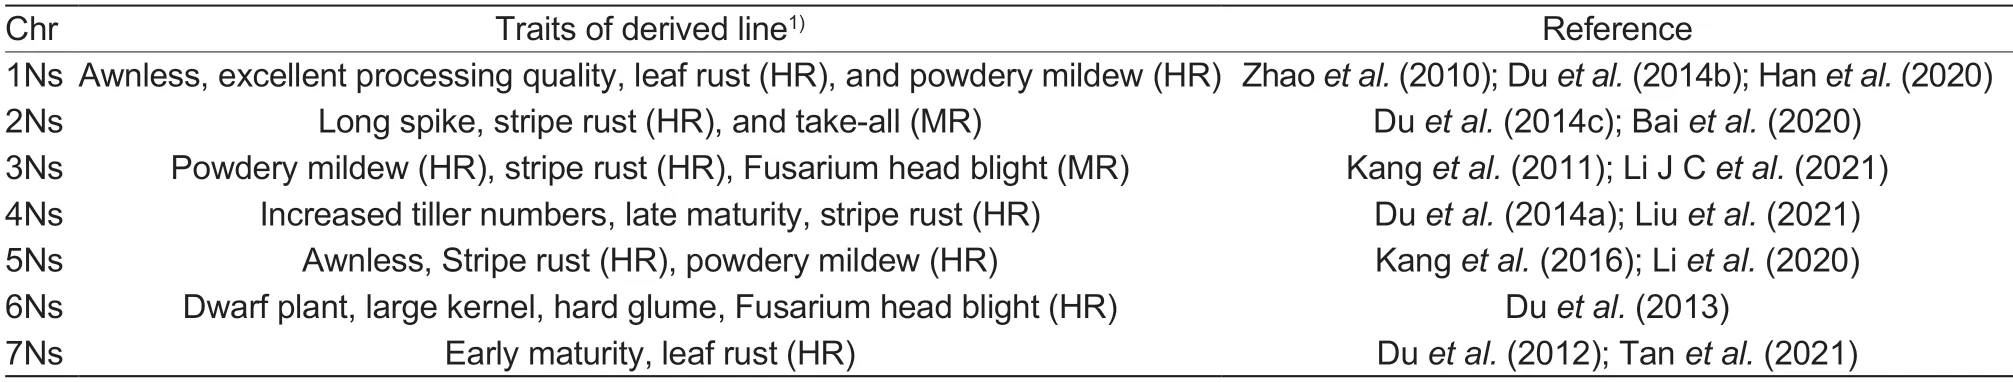
Table 4 The effects of alien chromosomes from Psathyrostachys huashanica on agronomic traits of receptor wheat
4.2.Development and application of species-specific oligo probes for ND-FlSH
The repeat sequences were identical or symmetrical segments occurring at different locations in the genome(Charlesworthet al.1994). There are five main ways to obtain repeat sequences of a species: genomic sequence direct screening,genomic DNA enzyme digestion product screening,genomic DNA library screening,random amplified polymorphic DNA (RAPD) product transformation,andCot-1 DNA library screening. As the genome information ofP.huashanicahas not been published and there are few sequencing results in the database,it is difficult to obtain ideal repeat sequences through Repeatexplor tools (Nováket al.2017;Tanet al.2021). Genomic DNA library screening is an upgraded version of the enzyme digestion method,and both methods have the disadvantage of a huge workload (Li G Ret al.2021). Our laboratory tried to convert specific sequences obtained by RAPD products to oligo probes,but the results were not satisfactory,which might be because the amplification products were too random to obtain the repetition region. GenomicCot-1 DNA of eukaryotes is enriched with moderate and highly repetitive sequences that have become an important tool for analyzing the composition of the plant genome and obtaining chromosome probes for recognition(Trifonovet al.2009;Zakrzewskiet al.2010). Yuet al.(2013) constructed the firstAlfalfareference karyotype map using theCot-1 DNA library method,and Manciaet al.(2015) revealed the composition and regions of repetitive DNA in onion based on itsCot-1 DNA signals.The sequencing results showed that theCot-1 DNA ofP.huashanicamainly belonged to the Lt1-5/6 type,which was very different from its congenericP.juncea(NsNs)andLeymusplantL.racemosus(NsNsXmXm) because the two species mainly had Tail family and pSc250 repeat sequence (Wanget al.2006). The result provided new evidence thatP.huashanicamay not be the original donor of Ns chromosomes toLeymusbased onCot-1 DNA repeat sequences,which supported a previous study using southern blot and karyotype analysis (Wanget al.2006;Li J Cet al.2021).
Since the development of pSc119.2,pAs1,(GAA)n,and pTa535,they have been widely used in the identification of wheat-alien-derived lines because a reasonable combination of these FISH probes can accurately recognize all wheat chromosomes and reveal changes in chromosomal composition and structure(Mukaiet al.1993;Zhanget al.2013;Tanget al.2014;Li G Ret al.2021). However,due to the collinearity ofTriticumchromosome evolution (Singhet al.2018;Zhouet al.2018),these probes can nonspecifically hybridize with wheat and alien chromosomes,which leads to a troublesome task in karyotype analysis of materials,where more than 40 chromosomes need to be accurately divided into homologous groups (Tanget al.2018). Therefore,to simplify the workload,researchers developed specific oligo probes for wheat-relative species that could only hybridize with alien chromosomes to construct genomespecific FISH karyotypes. However,only specific probes forHaynaldiavillosa,Agropyroncristatum,Thinopyrum ponticum,Roegneriaciliaris,rye,and barley have been developed (Huet al.2018;Liuet al.2018;Saidet al.2018;Leiet al.2020;Xiet al.2020;Chenget al.2022).ForP.huashanica,Tanet al.(2021) developed 19 FISH probes with a length of approximately 460 bp by using the Specific-Locus Amplified Fragment Sequencing (SLAFseq) method. However,the use of the probes requires target sequence amplification and fluorescent signal labeling,and a subsequent limitation is that an almost identical FISH karyotype makes it difficult to distinguish homologous groups. Zhanget al.(2022) established a FISH karyotype ofP.huashanicaby using the existing oligo probes pSc200 for rye and pTa71A-2 and oligo44 for common wheat (Xiaoet al.2017;Tanget al.2018).However,the probe set could also successfully hybridize with some chromosomes of common wheat,which meant that the optimal effect could be achieved must through the matching sequential-GISH experiment. In our study,Cot-1 DNA repeats were transformed into short ND-FISH probes HS-TZ3 and HS-TZ4,which could quickly and accurately identify the chromosomes ofP.huashanicawithout hybridizing with wheat chromosomes in the root tips and pollen mother cells of the wheat–P.huashanicaderived lines. In addition,the homologous group of alien chromosomes could be divided by simple analysis of karyotype and arm ratio.
4.3.Highly conservative in chromosome centromeric region of Triticae species
The FISH karyotype signals ofP.huashanicawere concentrated in the chromosomal heterochromatin region,which indicated that repeat sequences in the region mostly belonged to the Lt1 family. However,the chromosome terminal repeat sequences pSc200 of rye and oligo-6VSCL56 ofHaynaldiavillosabelonged to the 350 bp family,and oligo-2ScL-119 ofRoegneriaciliarisbelonged to the CACTA superfamily (Zhanget al.2013;Xiet al.2020;Chenget al.2022). The terminal repeats of interspecific chromosomes inTriticumare species-specific and provide a genetic basis for species diversity. In contrast,although the size and position of the centromere are different,the function and sequence are very conservative,which lays a genetic foundation for the stability of heredity.The centromeric repeat sequences of wheat crops are mainly the CCS1 and pSau3A9 families,which are Ty3/Gypsy-type retrotransposons,e.g.,Aegilopstauschii,TriticumboeoticumBoiss,common wheat and barley (Liuet al.2008;Guoet al.2016). Similarly,the CSS1-type repeat sequence was found in the centromeric region ofP.huashanica. Our supplementary experiments proved that probe HS-CHTZ5 could successfully hybridize with the centromeric region of common wheat and rye (Appendix B). The versatility of the centromere probe indicated that the recombination exchange rate of the centromeric region was low during the process of speciation ofTriticeae,and the centromeric sequences of the CCS1 type had extremely high similarity. The phenomenon is similar to the nucleic acid sequences of protein inTriticeae,which also have a high degree of conservation (Wanget al.2017;Chenet al.2021). Therefore,the acquisition of repeats sequence in the centromeric region will be helpful for the study of the evolutionary relationship and base preference betweenP.huashanicaand other wheat crops.
4.4.The structure of alien chromosome may change in wheat genetic background
By analyzing the alien chromosomes in these derived lines,we found thatP.huashanicachromosomes were not all in their original karyotypes in the wheat background. In particular,pericentric inversion (short arm end inverted to long arm end) occurred in 6Ns chromosomes,and additional 6Ns and 7Ns belonged to segment chromosomes (Fig.2;Appendix C). This phenomenon has also been observed in partial other wheat-alien-derived lines. For example,Shin and Kazuyoshi (2001) identified a wheat–barley line carrying a 1HL monotelosomic segment;Duet al.(2018)found that a wheat–rye line attached a 6RLKuminichromosome segment with 1/10 length of normal 6RKu.The shortening of introduced chromosomes might be due to the exchange recombination caused by paring genes or the loss of alien genetic materials caused by the rejection of the wheat background (Jiang and Gill 1998).Therefore,it is necessary to pay attention to whether the alien chromosomes are intact during the identification of wheat–alien-derived lines.
4.5.Comparison of different SNP arrays in identification of alien components
Early breeding obtained several wheat varieties with ideal agronomic traits through extensive parental selection and multiple rounds of screening,but the underlying molecular mechanisms were not understood (Rasheedet al.2018).Although molecular markers based on electrophoretic analysis have played important roles in gene location and progeny selection of target traits,their laborious and complicated experimental procedures call for the emergence of a new generation of markers that make the analysis could be done with the assistance of computer(Kamaluddinet al.2017;Wanget al.2022). The availability of wheat reference genome sequences and the advancement of sequencing technology have contributed to the popularity of array-based genotyping (Singhet al.2018;Sunet al.2020). Considering cost and efficiency,we believe that low-density arrays may be more suitable for the identification of distant hybridization progeny.Three genotypes (i.e.,homozygous,heterozygous,and NA) in each SNP locus could be analyzed in three ways:equivalence rate (pairwise comparison),homozygosity rate,and deletion rate. The analysis of the homozygosity rate method showing better adaptability may be because common wheat is a strictly self-pollinated crop with more homozygous SNP loci,whileP.huashanicais a crosspollinated crop with more heterozygous SNP loci. Only the 15K SNP array could recognize the homologous group of alien chromosomes in the addition line,which suggested that the density of the array is not proportional to the result of the analysis and that excessive loci might dilute the proportion of alien loci. By comparing common wheat withP.huashanica,it could be deduced that the 15K and 55K in-chip type arrays (Allenet al.2013) have partial locus detection rates in relative species,while the 16K and 40K in-solution type arrays (Guoet al.2021)seem to develop only for wheat because of their low detection rates in alien chromosomes. Moreover,none of the SNP array types could detect the self-translocation chromosome in wheat. Based on the results of this experiment,we suggest that the chromosomal SNP locus homozygosity rate should be used in analyzing wheatalien-derived lines,15K SNP array should be used for additional lines and substitution lines,and 40K SNP array should be used for translocation lines.
5.Conclusion
In this study,we obtained the chromosome and centromere repeat sequences ofP.huashanicabased onCot-1 library sequencing and conserved regions.We developed specialized oligo probes only for the Ns chromosome ofP.huashanica. By comparing with the FISH karyotype that we constructed,researchers can more easily distinguish theP.huashanicachromosomes in the wheat background and analyze their corresponding homologous groups. Some homologous groups of chromosomes ofP.huashanica(e.g.,6Ns and 7Ns)undergo structural variation after introduction into wheat,thus changing the original karyotype. In addition,we summarized the selection strategies of four low-density SNP arrays in the analysis of wheat–P.huashanicaderived lines and suggested using the chromosomal SNP homozygosity rate method. Therefore,the results help improve wheat breeding by better utilization of the relative speciesP.huashanicaand promote the identification of wheat-alien hybrid progenies.
Acknowledgements
This study was supported by the National Natural Science Foundation of China (31501301),the National Key Research and Development Program of China(2018YFD0100904),the Natural Science Foundation of Henan Province,China (162300410077),and the International Cooperation Project of Henan Province,China (172102410052).
Declaration of competing interests
The authors declare that they have no conflict of interest.
Appendicesassociated with this paper are available on https://doi.org/10.1016/j.jia.2023.02.001
 Journal of Integrative Agriculture2023年10期
- Journal of Integrative Agriculture的其它文章
- The association between the risk of diabetes and white rice consumption in China: Existing knowledge and new research directions from the crop perspective
- Linking atmospheric emission and deposition to accumulation of soil cadmium in the Middle-Lower Yangtze Plain,China
- Genome-wide association study for numbers of vertebrae in Dezhou donkey population reveals new candidate genes
- Are vulnerable farmers more easily influenced? Heterogeneous effects of lnternet use on the adoption of integrated pest management
- lnfluences of large-scale farming on carbon emissions from cropping:Evidence from China
- Spatio-temporal variations in trends of vegetation and drought changes in relation to climate variability from 1982 to 2019 based on remote sensing data from East Asia