
Identification of transition factors in myotube formation from proteome and transcriptome analyses
2023-10-16 01:32:58ZHENGQiHURongcuiZHUCuiyunJlNGJingLOUMengyuZHANGSihuanLlShuangCAOHongguoZHANGXiaorongLlNGYinghui
Journal of Integrative Agriculture 2023年10期
ZHENG Qi ,HU Rong-cui ,ZHU Cui-yun ,JlNG Jing,LOU Meng-yu,ZHANG Si-huan,Ll Shuang,CAO Hong-guo,ZHANG Xiao-rong,LlNG Ying-hui#
1 College of Animal Science and Technology,Anhui Agricultural University,Hefei 230036,P.R.China
2 Key Laboratory of Embryo Development and Reproductive Regulation of Anhui Province,Fuyang Normal University,Fuyang 236041,P.R.China
3 Anhui Province Key Laboratory of Local Livestock and Poultry Genetic Resource Conservation and Bio-Breeding,Anhui Agricultural University,Hefei 230036,P.R.China
Abstract Muscle fibers are the main component of skeletal muscle and undergo maturation through the formation of myotubes.During early development,a population of skeletal muscle satellite cells (SSCs) proliferate into myoblasts. The myoblasts then undergo further differentiation and fusion events,leading to the development of myotubes. However,the mechanisms involved in the transition from SSCs to myotube formation remain unclear. In this study,we characterized changes in the proteomic and transcriptomic expression profiles of SSCs,myoblasts (differentiation for 2 d) and myotubes (differentiation for 10 d). Proteomic analysis identified SLMAP and STOM as potentially associated with myotube formation. In addition,some different changes in MyoD,MyoG,Myosin7 and Desmin occurred after silencing SLMAP and STOM,suggesting that they may affect changes in the myogenic marker. GO analysis indicated that the differentiation and migration factors SVIL,ENSCHIG00000026624 (AQP1) and SERPINE1 enhanced the transition from SSCs to myoblasts,accompanied by changes in the apoptotic balance. In the myoblast vs.myotube group,candidates related to cell adhesion and signal transduction were highly expressed in the myotubes. Additionally,CCN2,TGFB1,MYL2 and MYL4 were identified as hub-candidates in this group. These data enhance our existing understanding of myotube formation during early development and repair.
Keywords: proteome,transcriptome,skeletal muscle satellite cells,myoblast,myotube
1.Introduction
Muscle fibers are fundamental to the composition of skeletal muscle,the development of which involves the activation of skeletal muscle satellite cells (SSCs),the proliferation of myoblast cells,and further differentiation and fusion into myotubes (Hernández-Hernándezet al.2020). These processes are regulated by a variety of factors. PAX7 is a classic biomarker of SSCs that is specifically expressed in all resting and proliferating forms of these cells in multiple species including human,monkey,mouse,pig,and chicken (Buckinghamet al.2003). During the differentiation of myoblasts,Myf5 and MyoD are thought to be determinants of myogenesis,which guide progenitor cells in establishing the skeletal muscle lineage,and MyoG is a critical factor of myogenic differentiation (Bryson-Richardson and Currie 2008;Comai and Tajbakhsh 2014). Desmin is a major intermediate filament of mature muscle cells and one of the markers of myotubes (Smolinaet al.2014).
In addition,several signaling pathways are responsible for regulating the myogenic process of SSCs. The Notch signaling pathway plays critical roles in regulating the quiescent state of the SSCs pool. Knockdown ofNotch1orNotch2alone in SSCs leads to a reduction in the number of SSCs and an increase in differentiation. Simultaneous knockdown enhances this effect,suggesting thatNotch1andNotch2act synergistically in satellite cells (Fujimakiet al.2018).Hes1,a target gene of Notch,repressesMyoDexpression,whereas in the absence ofHes1,prolonged high expression ofMyoDleads to increased differentiation of satellite cells (Lahmannet al.2019).Further,the FGF signaling pathway has regulatory effects on proliferation and differentiation.FGF6regulates the disturbed balance between proliferation and differentiation in satellite cells during muscle regeneration (Armandet al.2005),decreases the mobility of SSCs (Neuhauset al.2003) and reduces the quiescent SSCs pool (Zofkieet al.2021). Moreover,high levels of FGF2 may promote cell proliferation by bringing quiescent SSCs into the cell cycle through Ca2+-dependent mechanisms and FGFR1 (Liu and Schneideret al.2014;Yablonka-Reuveniet al.2015).Myogenesis is also regulated by Wnt signaling (Girardi and Le Grand 2018),the PI3K-Akt pathway (Yoshida and Delafontaine 2020),the ERK1/2 pathway (Machadoet al.2021),and others. Nevertheless,the transcriptomic and proteomic changes from SSCs to myotubes remain relatively ambiguous.
Local goat farmers generally prefer to keep local breeds as they are highly adaptable to regional environmental conditions and are usually more resistant to various diseases (Yalcintanet al.2018). However,the meat production of domestic goats is lower than that of imported goats (such as Boer,Nubian and other varieties),which hinders the development of the goat industry. Hence,it is necessary to explore the process of myotube formation as this is an important regulatory component of goat meat yield and quality.
In the present study,transcriptomic and proteomic analyses of goat SSCs,myoblasts and myotubes were conducted to characterize the expression of specific factors involved in the transitions that occur at adjacent stages and to elucidate the underlying mechanisms.Candidate regulators of myotube formation and potential hub genes at different stages were selected by GO,KEGG and other bioinformatics analyses.
2.Materials and methods
2.1.Experimental design and statistical rationale
Cell collection and immunocytochemistryGoat SSCs were isolated and identified as described previously(Linget al.2018). Briefly,newborn Anhuai goats,which were raised on the Boda Company (Baogong Town,Feidong County,Hefei City,Anhui Province,China),were dissected. Thenlongissimusdorsimuscle was digested in 0.1% collagenase for 40 min,and then digested with 0.25% trypsin for 15 min. Isolated skeletal muscle satellite cells were subjected to a differential adhesion method for cell purification,in which the cell suspension was re-seeded in a new culture dish (Corning,USA) for purification after each 30 min subculture.
Firstly,1×106SSCs (the 7th generation) were inoculated into 6-well plates and cultured in growth medium containing 20% FBS (CAT No: 10099-141C,Gibco) and DMEM/F12 (CAT No.SH30023.01,Hyclone)at 37°C in a 5% CO2humidified atmosphere. SSCs were collected at 80% confluency. To induce myoblast and myotube formation,these cells were placed in differentiation media (2% FBS,DMEM) for 2 and 10 days,respectively. Each stage had three biological repetitions and the samples taken at each stage were analyzed by immunofluorescence staining. Briefly,immunocytochemistry was performed by fixation of the cells,followed by incubation with secondary antibodies at a 1:300 dilution for 1 h. The following primary antibodies were used: anti-MYOG (CAT No.ab1835,Abcam,USA)at 1:500,anti-Desmin (CAT No.P17661,Cell Signaling Technology,USA) at 1:500,anti-MYOD (CAT No.sc-32758,Santa Cruz Biotechnology,USA) at 1:500,anti-Myosin7 (CAT No.MAB4470,R&D Systems,USA) at 1:500,and anti-PAX7 (CAT No.sc-81648,Santa Cruz Biotechnology) at 1:500. Nuclei were counterstained with DAPI (CAT No.D1306,Invitrogen,USA). The samples were eventually visualized on an OLYMPUS TH4-200 Microscope (Olympus,Tokyo,Japan) by a 20× objective lens and a 10× eyepiece.
Sample preparationThe samples were mixed with lysis buffer (7 mol L–1urea (CAT No.U6504-1KG,SIGMA,USA),2% SDS (CAT No.30166428,SINOPHARM,China),0.1% PMSF (CAT No.ST506,Beyotime,USA),and 1 mg L–1protease inhibitor cocktail (A32955,Thermo Fisher,USA),and homogenized using an ultrasonic homogenizer on ice for 3 min. These homogenates were then centrifuged at 14 000 r min–1for 30 min at 4°C,and the supernatant was collected in each case. The protein content was determined using a BCA Protein Analysis Kit using a BSA standard (CAT No.P0010,Beyotime).Preparations of 50 µg of these protein extracts were then diluted in 50 µL final volumes,and then reduced with 1 µL (1 mol L–1) dithiothreitol (DTT,final concentration of 10 mmol L–1,CAT No.V3155,Promega,USA) at 55°C for 1 h. Subsequently,these samples were alkylated by the addition of 5 µL of a 1 mol L–1iodoacetamide(IAA,final concentration is 25 mmol L–1,CAT No.I1149-25G,SIGMA) solution and protected from light at room temperature for 1 h. The samples were subsequently precipitated with 300 µL of pre-chilled (–20°C) acetone(CAT No.40064460,SINOPHARM) overnight,followed by washing twice with cold acetone and resuspension in 50 mmol L–1ammonium bicarbonate (CAT No.A6141–500G,SIGMA). Finally,the proteins were digested with sequence-grade modified trypsin (CAT No.v5117,Promega) at a substrate/enzyme ratio of 50:1 (w/v) at 37°C for 16 h.
High PH reverse phase separationThe peptide mixtures were redissolved in buffer A (20 mmol L–1ammonium formate in water,pH 10.0,adjusted with ammonium hydroxide),and then fractionated by high pH separation using an Ultimate 3000 System (Thermo Fisher) connected to a reverse-phase column (XBridge C18 column,4.6 mm×250 mm,5 µm;Waters Corporation,USA). High pH separation was performed using a linear gradient from 5% up to 45% buffer B (20 mmol L–1ammonium format in 80% ACN,pH 10.0,adjusted with ammonium hydroxide) for 40 min. The columns were then re-equilibrated at the initial conditions for 15 min.
DlA: nano-HPLC-MS/MS analysisEach sample was mixed with 30 µL solvent A (0.1% formic acid aqueous solution) to produce a suspension,and a total of 9 µL aliquot of which was mixed with 1 µL of 10× iRT peptides and then analyzed by online nanospray LC-MS/MS on an Orbitrap Lumos Mass Spectrometer connected with the EASY-nLC 1200 System (Thermo Fisher). The mass spectrometry parameters were set as follows: (1) MS:scan range (m/z),350–1 500;resolution,120 000;AGC target,4e6;and maximum injection time,50 ms. (2) HCDMS/MS: resolution,30 000;AGC target,1e6;collision energy,32;and energy increase,5%. (3) Variable window acquisition: the 60 windows and overlapping serial ports were set,and each window overlapped by 1m/z. A total of 3 µL aliquot of peptide was loaded onto an analytical column (Acclaim PepMap C18,75 µm×25 cm) for each sample. High pH separation was then performed using a linear gradient from 5% buffer to 35% buffer in 120 min(buffer: 20 mmol L–1ammonium formate in 80% ACN,pH 10.0,adjusted with ammonium hydroxide). The column was then re-equilibrated at the initial conditions for 15 min. The column flow rate was controlled at 200 nL min–1at 40°C.
Spectrum-Centric DlA analysisRaw DIA data were processed and analyzed using Spectronaut X version 14.9 with default parameters. Uniprot was used as the database,and trypsin enzymatic hydrolysis was set up.Parameters are followed by searching database: The fixed modification parameter was set to carbamidomethylation(C);and the variable modification parameter was set to methionine oxidation. The retention time prediction type was set to dynamic iRT and the iRT was added before data acquisition. Data extraction was conducted with Spectronaut X based on an extensive mass calibration.Spectronaut X was used to determine the ideal extraction window with a dynamic dependance on iRT calibration and gradient stability. In the DIA analysis,the MS1 XIC was reconstructed and evaluated using a set of different scores that focused principally on mass accuracy,the isotopic pattern,the XIC shape,and the intensity.Together with the MS2 level scores,they were weighted and incorporated into the final peak scoring. The top 3–6 fragments were used for precursor identification and quantification with default settings. The mass tolerance was set as dynamic,i.e.,the Spectronaut™ calculated the ideal mass tolerances for data extraction and scoring based on its extensive mass calibration function. For this analysis,the average ms 1 tolerance was 3.9 ppm and the average ms 2 tolerance was 14.4 ppm. AP-adjust(FDR) cut-off of 1% was applied to the precursor and protein levels. Decoy generation was set to mutate,which is similar to scrambled but will only apply a random number of AA position swamps (min=2,max=length/2).All selected precursors passing the filters were used for quantification. The average top three filtered peptides which passed the 1%P-adjust (FDR) cut-off were used to calculate the major group quantities. We used directDIA(Library-free DIA),in which the number of distinct peptide sequences assigned to each protein is at least 1.
2.2.Transcriptomic analyses by RNA-seq
RNA extraction,library construction and sequencingTotal RNAs were extracted using a Trizol Reagent Kit(Invitrogen,Carlsbad,CA). RNA quality was assessed in each case on an Agilent 2100 Bioanalyzer (Agilent Technologies,Palo Alto,CA) and RNase-free agarose gel electrophoresis. The total RNA preparations were then used to extract mRNA using oligo(dT) beads which were then treated using a fragmentation buffer and reverse transcribed into cDNA with random primers. Secondstrand cDNAs were synthesized using a reaction mixture.The cDNA fragments were purified using a QiaQuick PCR Extraction Kit (Qiagen,Venlo,the Netherlands),end repaired,poly(A) tailed,and then ligated to Illumina sequencing adapters. The ligation products were sizeselected using agarose gel electrophoresis,PCR amplified,and then sequenced using an PE150 (Pair end 150) Illumina HiSeq2500 (Gene Denovo Biotechnology Co.,Guangzhou,China). Ultimately,the size of each library was 200–700 nt.
Filtering of clean reads and alignment with a reference genomeReads obtained from the sequencing machines included raw reads containing adapters or low-quality bases,which will affect the subsequent assembly and analysis. To obtain high-quality clean reads,the reads were further filtered using fastp (version 0.18.0). The short reads alignment tool Bowtie2 (version 2.2.8) was used for mapping them to the ribosome RNA(rRNA) database. The rRNA-mapped reads could then be removed. The remaining clean reads were further used for assembly and gene abundance calculations.An index of the reference genome was constructed,to which paired-end clean reads were mapped (Capra hircus,Ensembl_release96) using HISAT2.2.4 with “-rnastrandness RF”. Other parameters were used at their default settings.
Quantification of gene abundanceThe mapped reads from each sample were assembled using StringTie v1.3.1viaa reference-based approach. Briefly,for each transcription region,a fragment per kilobase of transcript per million mapped reads (FPKM) value was calculated to quantify the expression abundance and any variations.
2.3.Differentially expressed proteins (DEPs) and genes (DEGs)
Differential expression analysis between groups was performed using DESeq2 Software (Perteaet al.2016).Proteins and genes with a parameterP-adjust of below 0.01 were considered DEPs and DEGs,respectively. GO classifications involved the three subgroups ‘biological process’,‘cellular component’,and ‘molecular function’.GO and KEGG terms with aP-adjust<0.05 were defined as significantly enriched. Protein–protein interaction (PPI)networks were identified using String v9.1,which references genes as nodes and interactions as lines in a network. The resulting network files were visualized using Cystoscape(v3.8.1) Software to present these biological relationships as core interactions. Correlation coefficients between two replicas were calculated to evaluate the repeatability between samples,i.e.,the closer the correlation coefficient gets to 1,the better the repeatability between two parallel experiments. Principal component analysis (PCA) was then performed using this information with R package models(https://github.com/avanlinden/PCA-in-R). The software WoLFPSor was used to predict the subcellular locations of the proteins (Hortonet al.2007).
2.4.Transmembrane region and signal peptide prediction analysis
Transmembrane protein topology was predicted in this study using a hidden Markov model (https://www.novopro.cn/tools/tmhmm.html) (Kroghet al.2001). SignalP 5.0 was used to avoid predicting transmembrane domains as signal peptide regions (https://www.novopro.cn/tools/signalp) (Almagro Armenteroset al.2019).
2.5.Quantitative PCR
For the expression of marker genes (PAX7,MyoD,MyoG,andDesmin) in the three stages,the key genes screened in each comparison group were verified by qPCR. The qPCR analysis was conducted using a 2×Q3 SYBR qPCR Master mix (Tolobio,Shanghai,China) and a Realtime Thermal Cycler 5100 (Thermo Fisher). The primer pairs were designed using the PrimerSelect function in DNAStar and synthesized by the TsingKe Biological Technology Co.,China (Appendix A). TheGAPDHandβ-actinhousekeeping genes were amplified as a control (Liet al.2019). The gene expression levels were normalized to the reference sequence and calculated as 2-ΔΔCt.
2.6.Western blot analysis
For Western blotting,cells at different stages were lysed with RIPA buffer (CAT No.v5117635013,TaKaRa) to extract total proteins. Briefly,the medium of cells (SSCs differentiated for 0 d (SSC),2 d (myoblast) and 10 d(myotube)) in 6-well plates was removed and 250 µL of RIPA buffer mixture (RIPA:PMSF=99:1 (w/v)) was added for lysis on ice for 30 min. Then,the supernatants were collected by centrifugation at 12 000 r min–1for 10 min at 4°C. The protein concentrations were determined using a BCA Kit (CAT No.P0010,Beyotime),and separated using 12% SDS-polyacrylamide gel electrophoresis.After electrophoresis,the proteins were wet transferred to polyvinylidene fluoride membranes and blocked with 5% BSA at room temperature for 2 h. The anti-STOM mAb (CAT No.A13975,1:1 000,ABclonal,China) or anti-GAPDH mAb (CAT No.GB11002,1:1 000,Servicebio,China) was then incubated as the primary antibody for 2 h. After three washes with 0.05% Tween-20 (CAT No.T6335,Macklin,China),substrates were incubated with horseradish peroxidase (HRP)-conjugated rabbit antimouse IgG antibody (CAT No.AS014,ABclonal),as the secondary antibody,for 2 h,followed by washing with PBS three times and signal development with DAB (CAT No.BL732A,Biosharp,China). The immunoreactive bands were visualized by the BeyoECL Plus Western blot detection system (Gel Doc EZ,Hercules,CA). The GAPDH protein was used as the control (Appendix B).
2.7.Silencing of candidate genes
Small interfering RNAs (siRNAs) targeting theSTOM,SLMAPand the corresponding scrambled siRNAs (scrsiRNAs) were designed and synthesized by GenePharma(Shanghai,China),and related sequence information is provided in Appendix C. Goat SSCs were cultured in growth medium containing 20% FBS and DMEM/F12 at 37°C in a 5% CO2humidified atmosphere. Lipofectamine 2000 Reagent (Invitrogen) was used to transfect these cells in accordance with the manufacturer’s instructions.A control group (mock) and a relevant control (scr-siRNA)were established. In the mock group,transfection reagent was added without siRNA;in the scr-siRNA group,siRNA was changed to scr-siRNA. At 6 h after the initiation of transfection,the growth medium was substituted for differentiation medium (2% FBS,Gibco,Australia;DMEM/F12,Hyclone,USA) for 5 days. The transcript expression levels of the targeted genes were determined using qPCR to assess the transfection efficiency.
3.Results
3.1.Analysis of differentially expressed genes(DEGs) and proteins (DEPs)
A total of 15 053 genes and 7 290 proteins between SSCs,myoblasts and myotubes were systematically identified by RNA-seq and DIA (Fig.1-A and B;Appendices D and E). Furthermore,the PCA showed that the proteins and genes clustered together at each stage,indicating that the samples were reproducible (Appendix F). To explore the dynamic changes in the proteome and transcriptome during the transition of SSCs to myotubes over time,differential expression analysis of the genes and proteins(FPKM>1,P-adjust<0.01) between each stage was conducted. A total of 5 785 DEGs and 2 946 DEPs were thereby identified (Fig.1-C and D;Appendix G).

Fig.1 Proteins and genes found to be differentially expressed between goat skeletal muscle satellite cells (SSCs),myoblasts and myotubes. A,representative fluorescence images of SSCs,myoblasts,and myotubes from the goat after staining for the marker proteins PAX7,MyoD,and Desmin. The nuclei were counter stained with DAPI. B,schematic illustration of the experimental design. C and D,the differentially expressed genes (DEGs) (C) and proteins (DEPs) (D) between the three groups. Red and blue colors represent up-and down-regulated DEGs and DEPs,respectively. M1 and M2 represent myoblast (differented for 2 d) and myotube (differented for 10 d),respectively.
3.2.Potential membrane DEPs candidates
The membranes of myoblasts recognize each other through the involvement of myocyte membrane proteins that facilitate the formation of holes and eventual cell fusion (Petrany and Millay 2019). Notably,however,the membrane proteins that play a role in the fusion of goat myoblasts are unknown. Hence,DEPs of myoblasts and myotubes with a |log2FC|>2 were first subjected to GO and KEGG analyses in which the genes encoding transcription factors and proteins involved in metabolism and sarcomere formation were filtered out. Subsequently,after excluding the DEPs down-regulated between myoblasts and myotubes,the transmembrane and signal peptide regions of 31 candidates were identified (Appendix G). Ultimately,seven DEPs were screened as potential membrane protein candidates for muscle cell fusion:ENSCHIG00000026568,SFXN3,SGCD,SLC38A7,SLMAP,STOM,and TMEM43 (Appendix H).
Among them,the expression ofSLMAPandSTOMwere verified. The results forSLMAPwere consistent with those in the RNA-seq data,and this gene was verified to be up-regulated in myotubes compared to myoblasts (Fig.2-A).STOMexpression was found to have significantly changed (P<0.05) over the three developmental stages,consistent with the RNA-seq findings (Fig.2-B). The expression of the STOM protein was verified using Western blotting due to inconsistent trends in its protein and transcript levels,and as expected,it showed high expression in myotubes consistent with the DIA results (Fig.2-B;Appendix I).
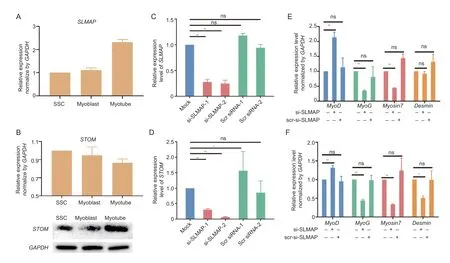
Fig.2 Correlations between the differentially expressed proteins (DEPs) and genes (DEGs). A and B,qPCR expression analysis of SLMAP (A) and STOM (B). C and D,efficiency of SLMAP (C) and STOM (D) knockdown using siRNA targeting. E and F,changes in the expression of myogenic genes following the SLMAP (E) and STOM (F) knockdown. Expression levels are represented by mean±SD (n=3). **,significant difference at P<0.01;*,difference at P<0.05;ns,no difference (P>0.05).
Two siRNAs targetingSLMAPandSTOMwere transiently transfected into SSCs separately,and subsequent qPCR results indicated significant downregulation of these genes (P<0.01;Fig.2-C and D). Both were therefore selected for subsequent experiments,and their targeting siRNAs were transiently transfected into SSCs,followed by 5 d of differentiation,to identify expression changes in the known myogenic genesMyoD,MyoG,Myosin7,andDesmin. TheSLMAPknockdown resulted in significant up-regulation (P<0.01) of the myogenic markerMyoD,and significant down-regulation(P<0.01) of the myotubular markersMyoGandMyosin7(P<0.01),but the expression level ofDesmindid not change (Fig.2-E). Knockdown ofSTOMgenes produced similar changes except forMyoD,MyoGandMyosin7,butDesminwas significantly down-regulated (P<0.01,Fig.2-F). This suggests thatSLMAPandSTOMmay play a role in the regulation of myogenic genes.
3.3.lntegrated analysis of the candidate DEP and DEGs
Alterations of genes at the transcript level may not be consistent with their expression at the protein level,and approaches that integrate proteomic and transcriptomic data can provide more reliable results in this regard.Integrated expression analysis of the identified DEPs(|log2FC|>1.2) and DEGs (|log2FC|>2) was conducted next(Fig.3-A and B). Candidates were identified as positive correlations if they exhibited similar expression patterns at the protein and gene levels. Otherwise,they were designated as negatively correlated. There were 18 and 31 candidates found to be positively correlated in the SSCvs.myoblast group,and the myoblastvs.myotube group,while 37 and 10 were found to be negatively correlated,respectively (Fig.3-C and D). GO analysis was then performed for the positively correlated candidates in these two groups.
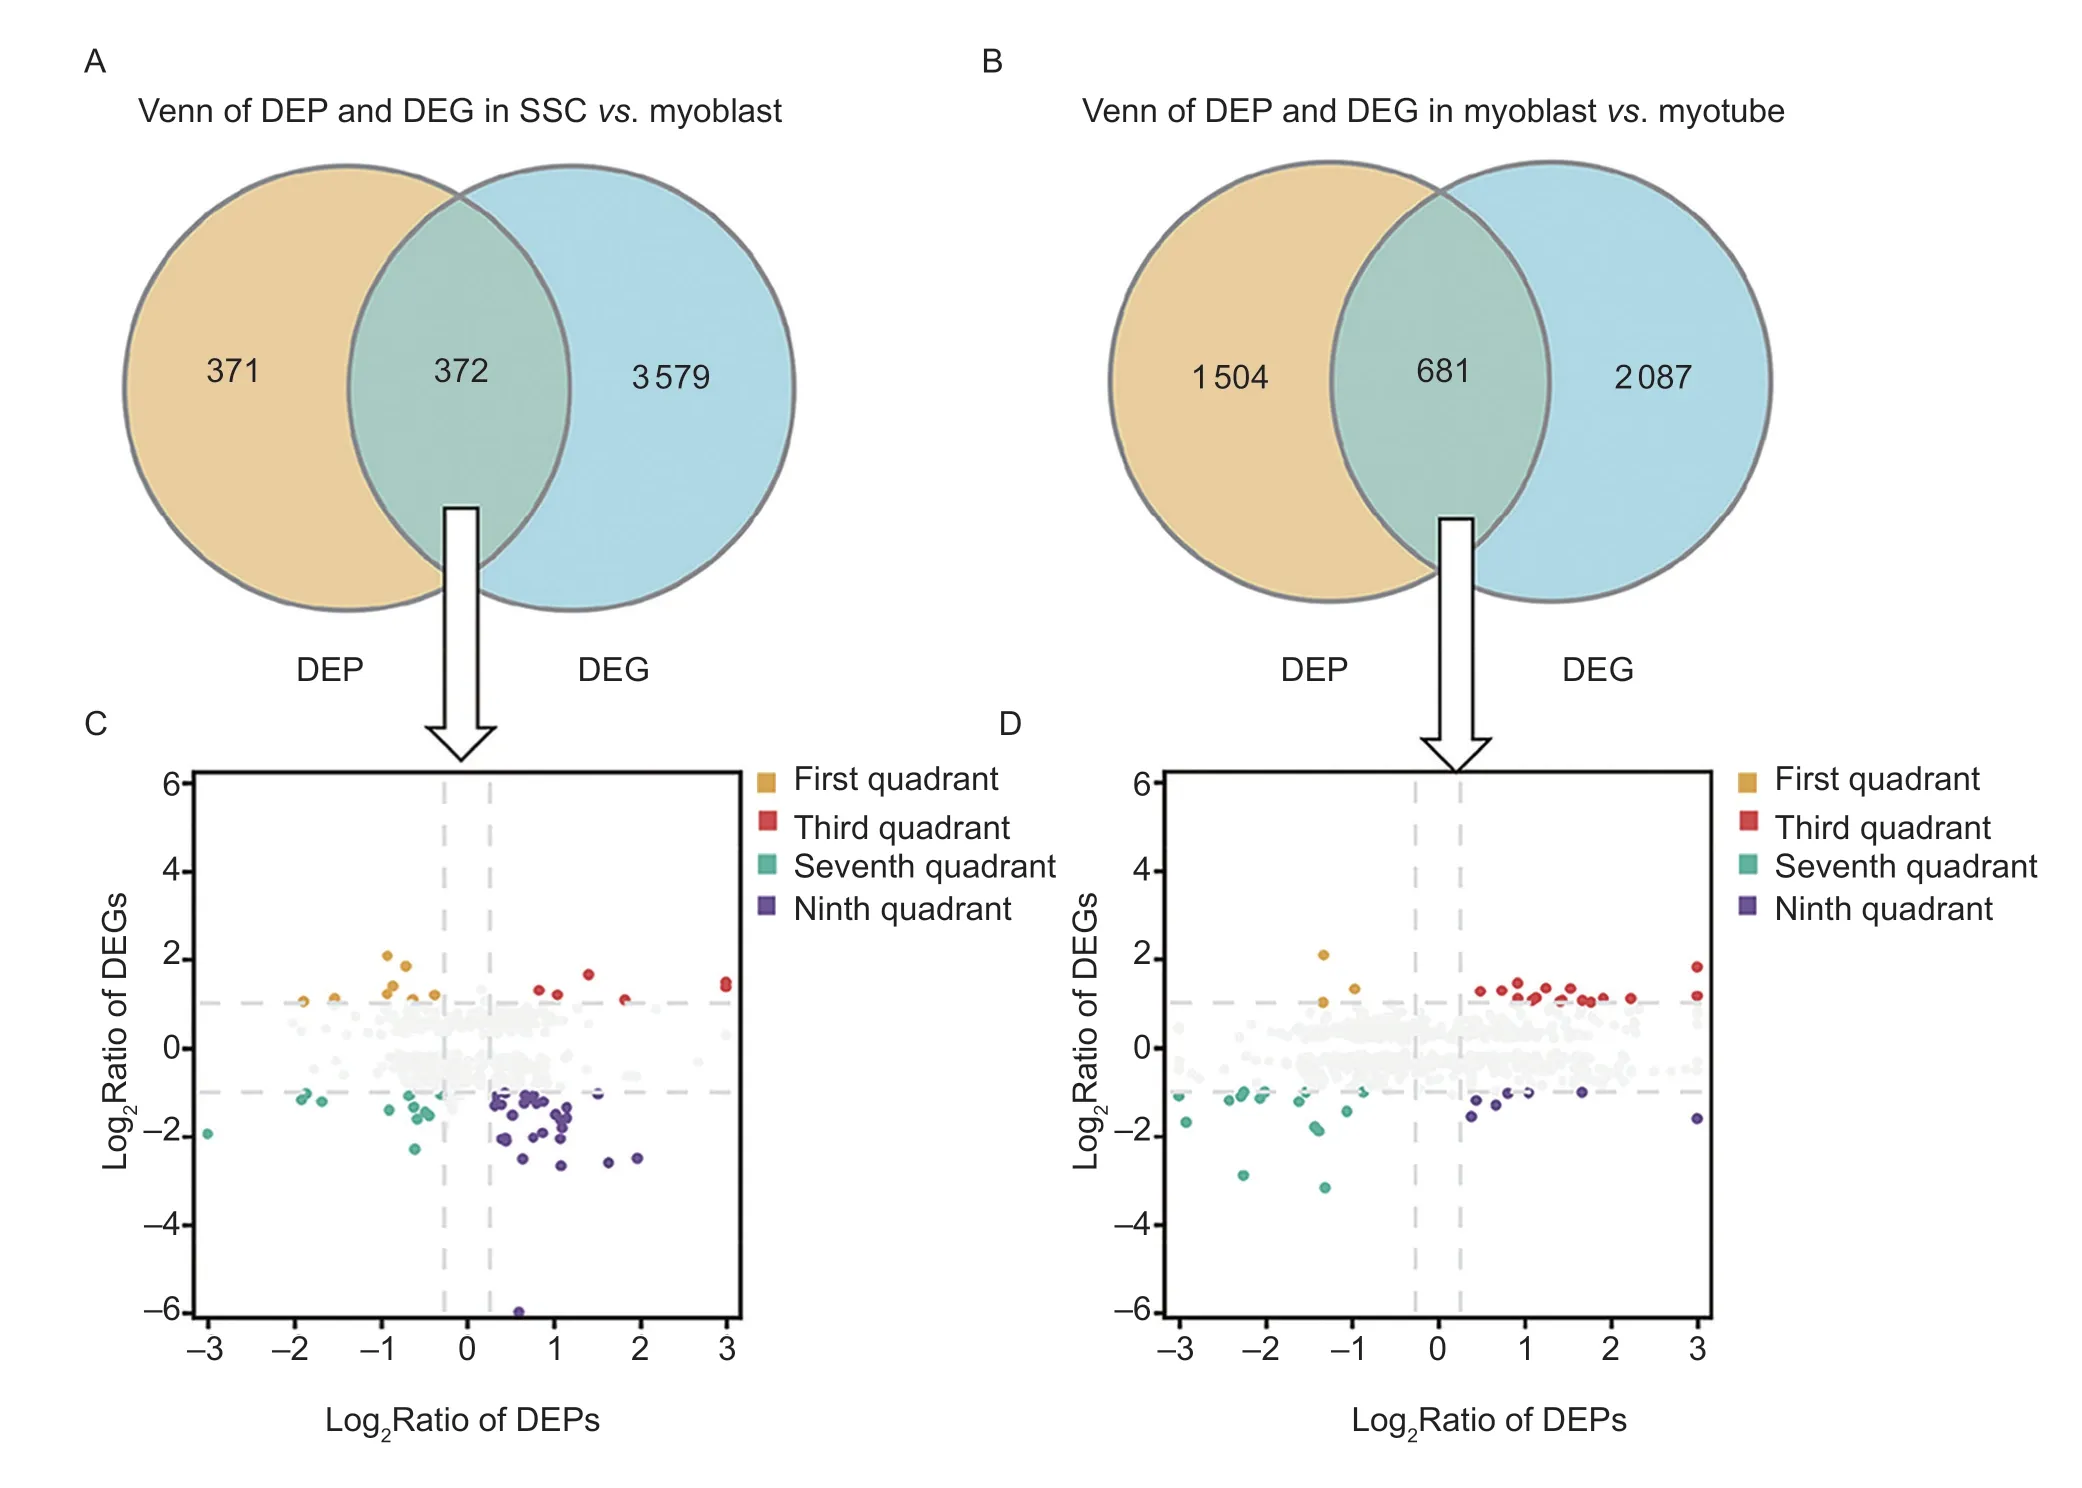
Fig.3 Correlations between the differentially expressed proteins (DEPs) and genes (DEGs). A and B,DEPs and DEGs found to be co-expressed in the SSC vs. myoblast group (A) and the myoblast vs.myotube (B) group. C and D,nine-quadrant graphs of co-expressed DEPs and DEGs in the SSC vs.myoblast (C) and myoblast vs.myotube (D) groups. Orange color (first quadrant)represents the upregulation of DEGs and downregulation of DEPs;red color (the third quadrant) represents the upregulation of both DEGs and DEPs;green (the seventh quadrant) denotes the downregulation of both DEGs and DEPs;and purple (ninth quadrant)designates the downregulation of DEGs and upregulation of DEPs.
3.4.Multicellular processes initiate differentiation and regulate apoptosis from the SSC to myoblast stage
Positive correlation candidates found in the SSCvs.myoblast group were annotated using GO,with a focus on biological processes. They were found to be significantly enriched (P-adjust<0.05) in 29 GO terms comprising“regulation of biological quality”,“regulation of the force of heart contraction”,“chemical homeostasis”,and“multicellular organismal process”,among others (Fig.4-A;Appendix J). There were 11 candidates (7 down-and 4 up-regulated) that function in multicellular organismal processes (Fig.4-B),including system development,circulatory system development,and muscle cell fate specification (Fig.4-B). Moreover,SERPINE1,AQP1,MYL2,and SVIL were also noted to be involved in cell differentiation and migration (Fig.4-C).
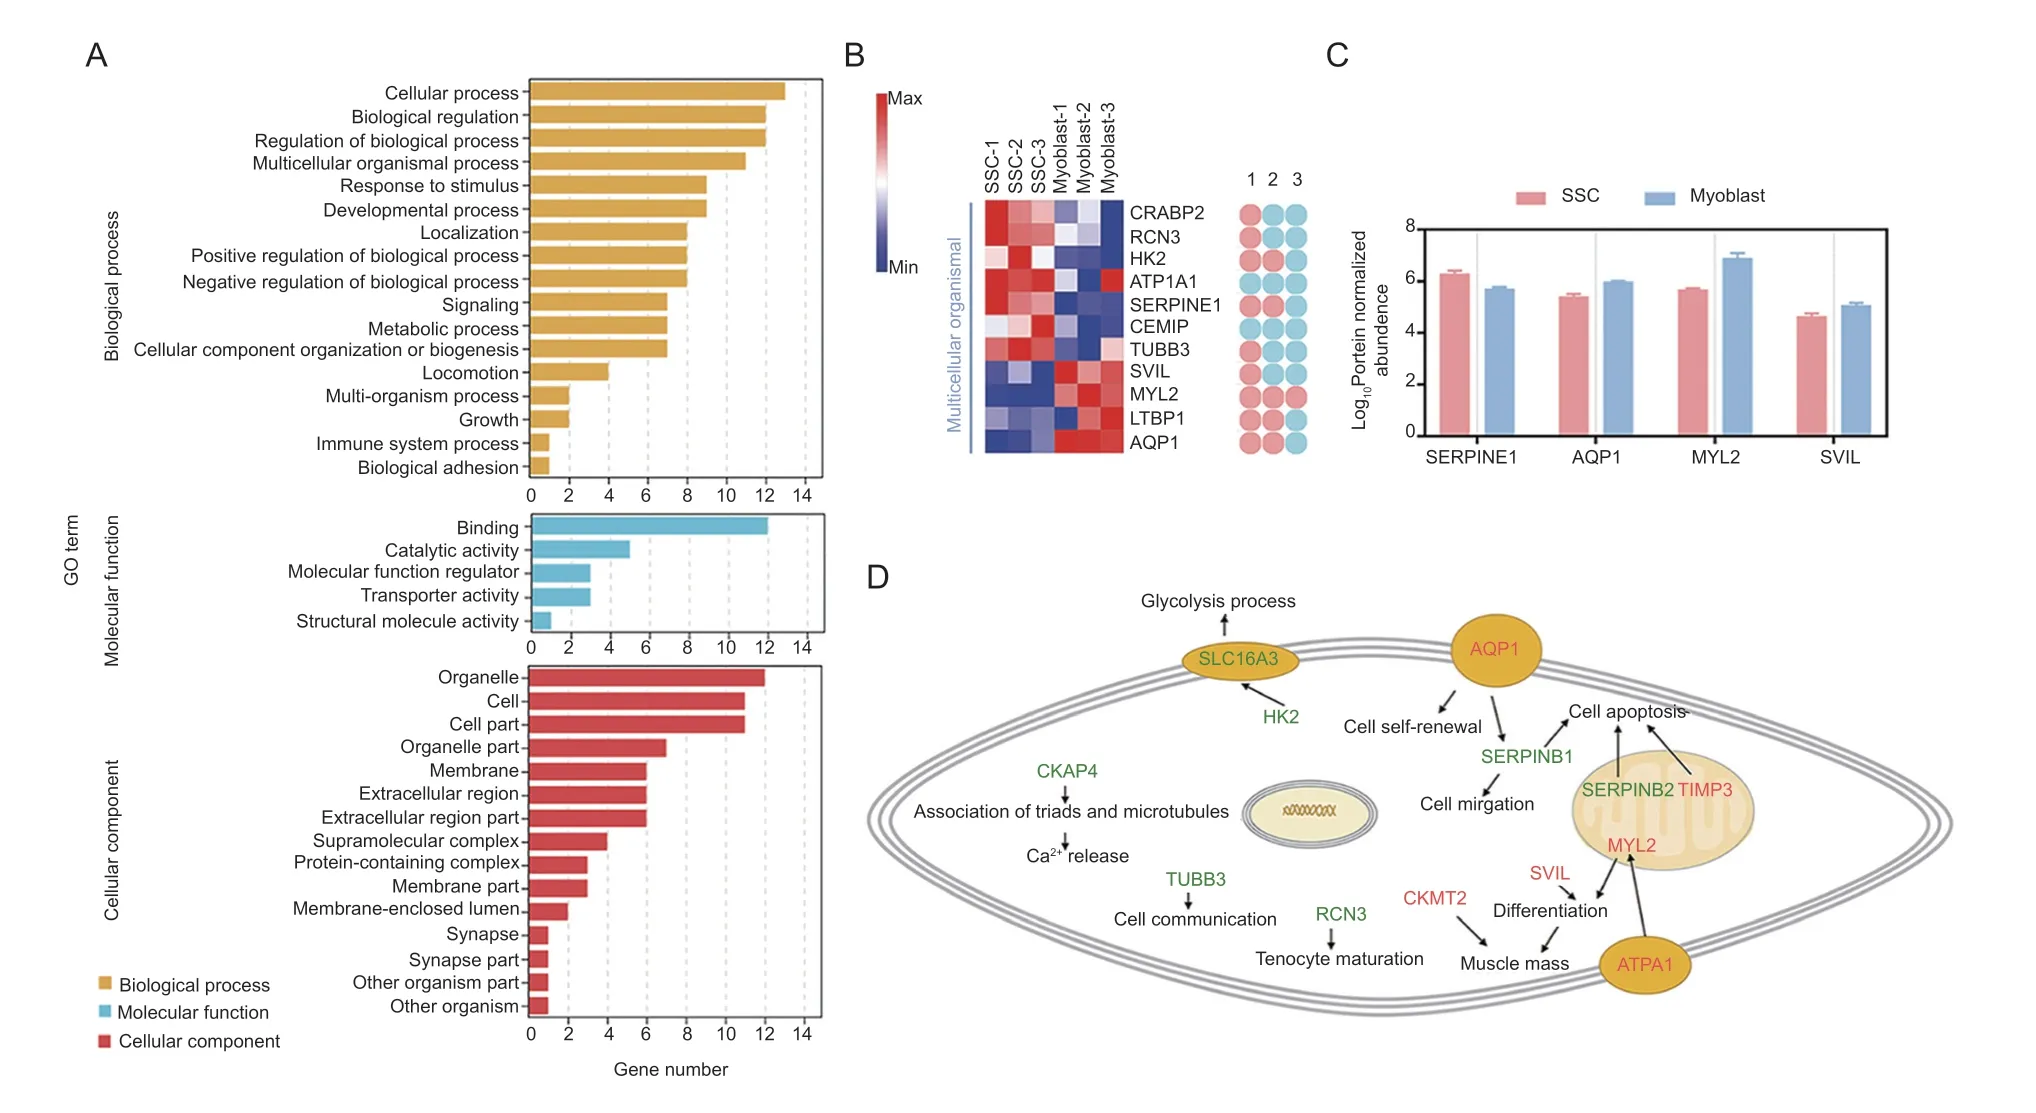
Fig.4 Functional transformation of candidates in the skeletal muscle satellite cells (SSCs) vs.myoblast group. A,classification of GO terms. B,heatmap of the candidates involved in multicellular processes,and their participating functions. 1,the GO term of“system development”;2,the GO term of “represent circulatory system development”;3,the GO term of “muscle cell specification”.C,expression of candidates related to proliferation,and/or migration. D,illustration of cellular and molecular processes for the candidates in the SSC vs.myoblast group. Red and green candidates,up-and down-regulation in myoblasts,respectively.
Interaction networks were then constructed using the candidates identified in the SSCvs.myoblast group as seed nodes. Since SERPINE1,SERPINE10,ENSCHIG00000017433S (ERPINE2),TIMP3,ATP1A1,and AQP1 may have a mutual regulatory relationship,they were annotated with GO (Appendix K). Unexpectedly,SERPINE1,SERPINE2,and TIMP3 were enriched in the apoptosis GO term (Appendix K).Additionally,MGI phenotype analysis was used to screen out the factors related to skeletal muscle development in this group,such as CKMT2,ATP1A1,RCN3,SLC16A3(also referred to as MCT4),and CKAP4 (Appendix K). The potential GO functions of these candidates combined with their subcellular localizations suggested a role in specific stages of goat muscle development(Fig.4-D).
Furthermore,the expression ofCKMT2,AQP1,TIMP3,SVIL,SERPINE1,SERPINE2,RCN3,andSLC16A3in the three stages was verified. Their expression levels are consistent with the RNA-seq data (Appendix L).
3.5.Cell adhesion and signal transduction related candidates are up-regulated in myotubes compared to myoblasts
After proliferation from SSCs,myoblasts undergo an ordered series of steps to form myotubes,including differentiation,elongation,migration,adhesion,membrane alignment,and finally membrane union(Guzzoet al.2004;Chen and Olson 2005;Simionescu and Pavlath 2011). Thus,we compared our identified candidates to further characterize their functions between myoblasts and myotubes. As expected,the GO annotations of the candidates from myoblasts to myotubes differed from those observed from SSCs to myotubes (Fig.5-A;Appendix M). In addition to cell proliferation,cell migration,cell-substrate adhesion,skeletal muscle tissue regeneration,and cell adhesion terms were also enriched. A proportion (15%,7 of 47)of the candidates were found to be involved in cellsubstrate adhesion,and candidates related to cell adhesion were up-regulated in myotubes,comprising COL8A1,EDIL3,BST1,and CCN2 (Fig.5-B). Moreover,candidates associated with the GO term of cell migration were also identified. Five candidates that are involved in the GO term of cell migration were up-regulated by this transition process (Fig.5-C). The GPNMB,CCN2,and PYCARD were also enriched in the signal transduction GO terms,such as “positive regulation of the ERK1 and ERK2 cascade (GO:0070374)” and “positive regulation of the MAPK cascade (GO:0043410)”. The PPI network indicated that CCN2,TGFB1,MYL2,and MYL4 were core candidates in the myoblastvs.myotube group(Appendix N). The regulation of cell adhesion and signal transduction candidates identified in the myoblastvs.myotube group are summarized in Fig.5-D.
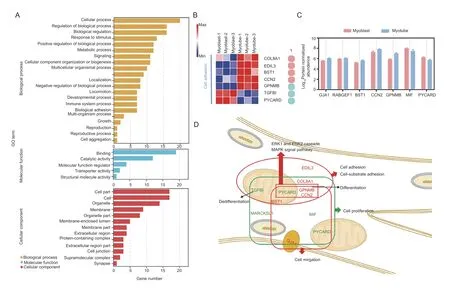
Fig.5 Functional transformation of candidates in the myoblast vs.myotube group. A,classification of GO terms. B,heatmap of candidates in “cell-substrate adhesion” and “cell adhesion”. 1,cell-substrate adhesion. C,expression of candidates related to migration. D,illustration of cellular and molecular processes related to the functions of the candidates in the myoblast vs.myotube group. The red and green colored candidates,up-and down-regulation in myotubes,respectively. The red and green boxes,the up-and down-regulated functions,respectively.
Then,the expression ofCCN2,TGFB1,MYL2,MYL4,EDIL3,COL8A1,PYCARD,andBST1in the three stages was verified. The results are consistent with the RNA-seq data (Appendix O).
4.Discussion
Skeletal muscle is the most abundant tissue in goats and other mammals,comprising 35–45% of the body mass. It consists of a mixture of terminally differentiated fibers,representing the basic contractile units,which are grouped into bundles (Dessaugeet al.2021). These multinucleated muscle fibers mature from myotubes,which are formed by the migration and fusion of mononuclear myoblasts that differentiated from SSCs(Dessaugeet al.2021). Some markers in these processes have been identified,but the key elements of the overall transformation process remain unclear.
Plasma membrane fusion is essential for myotube formation and the discovery of specific fusion proteins will be crucial for deciphering skeletal muscle cell membrane fusion (Kimet al.2015). Hence,up-regulated DEPs between myoblast and myotube were targeted in our current analyses,and seven potential fusion factors were identified after screening of the GO terms,KEGG terms,transmembrane region,and signal peptide. Of these candidates,SLMAP (Guzzoet al.2004) and STOM (Leeet al.2017) are considered the most promising as they had been found previously to be related to fusion. In our current study,silencingSLMAPresulted in up-regulation ofMyoD,and down-regulation ofMyoGandMyosin7,while Desmin was unchanged. UnlikeSLMAP,Desminis down-regulated afterSTOMknockdown. Hence,SLMAPandSTOMregulate the expression of different myogenic genes.
Candidates that subsequently showed a positive correlation between SSCs and myoblasts were further analyzed. Differentiation and migration are indispensable in the transition from SSCs to myoblasts,and they are essential prerequisites for the formation of multinucleated myofibers (Dumontet al.2015). Therefore,we queried the roles of MYL2,SVIL,AQP1,and SERPINE1,which were enriched in the GO term of migration. MYL2 was found to be highly up-regulated (4.13-fold change) in myoblasts,consistent with its previously described involvement in muscle cell fate (Leeet al.1992). MYL2 and SVIL were found to be included in the muscle organ development GO term. SVIL was reported previously to be one of the first structural proteins that aggregate during myogenesis,and contribute to myogenic membrane structure and differentiation (Ohet al.2003).Furthermore,SVIL also plays a role in cytokinesis through its interaction with KIF14 (Smithet al.2010). Moreover,up-regulation of AQP1 in myoblasts has been reported to positively regulate cell migration and cell self-renewal(Chenet al.2020). SERPINE1 (also known as PAI-1)is down-regulated in myoblasts,and has been shown to control cell-matrix interactions by regulating the accessibility of specific cell-attachment sites (Stefansson and Lawrence 1996).
SERPINE1,SERPINE10,ENSCHIG00000017433S(ERPINE2),TIMP3,ATP1A1,and AQP1 were identified in our present study as seed nodes in the PPI network of the SSCvs.myoblast group. SERPINE1,SERPINE10,ERPINE2,and TIMP3 were found to be enriched in the apoptosis GO term. Studies have consistently reported that the down-regulation of SERPINE1 and up-regulation of SERPINE2 inhibit apoptosis,while the up-regulation of TIMP3 promotes this process (Qi and Anand-Apte 2015;Leeet al.2018;Zhanget al.2020). Our present findings thus indicate that the transition from SSCs to myoblasts in aninvitroculture occurred in a balanced manner with programmed cell death,which might due to mitophagy(Baechleret al.2019).
Candidates showing a positive correlation between myoblasts and myotubes were then explored,and showed enrichment across a number of interesting functions. Cell adhesion is a fundamental process for maintaining the stability of tissue structures,and it is also a regulator of cell movement and function(Ceafalanet al.2020). In addition to their involvement in cell adhesion,the GPNMB,CCN2,and PYCARD gene candidates were also found to be enriched for the categories “positive regulation of ERK1 and ERK2 cascade” and “positive regulation of MAPK cascade”.ERK1/2 inhibition promotes robust myotube growthviaCaMKII activation,resulting in myoblast-to-myotube fusion (Eigleret al.2021). The extracellular signalregulated kinases 1/2 (ERK1/2) are major components of the greater MAPK cascade that transduces growth factor signals at the cell membrane (Boyeret al.2019).MAPK members regulate the terminal differentiation process for myoblasts and promote their fusion (Lehka and Rędowicz 2020). Recombinant GPNMB activates the phosphoinositide 3-kinase (PI3K)/Akt and mitogenactivated protein kinase (MAPK)-extracellular signalregulated kinase (ERK) kinase (MEK)/ERK pathwaysviaNKA (Onoet al.2016).CCN2gene silencing inhibits the activation of the MAPK signaling pathway in cardiac cells(Honget al.2018),and exogenous addition ofCCN2to human keratinocyte cultures regulates phosphorylation of ERK (Kiwanukaet al.2013). Furthermore,PYCARD (also known as ASC) does not affect the expression of MAPK but affects its phosphorylation by pathogens and Toll-like receptor agonistsviasuppression of the dual-specificity phosphatase,DUSP10/MKP5 (Taxmanet al.2011). Their roles in other cells or organs provide new perspectives on their roles in myoblasts.
The seed nodes of the myoblastvs.myotube group in our present study were CCN2,TGFB1,MYL2,and MYL4.In our current data,CCN2 was consistently up-regulated,and highly expressed at all transition stages from SSCs to myotubes. Highly expressed CCN2 mediates adhesion,aggregation,and migration in multiple cell types (Aguiaret al.2014). TGF-β signaling negatively affects muscle growth by affecting both satellite cells and myofibers.TGFB1 inhibits myoblast differentiation. Exogenous TGFB1 was shown to prevent fusion and myotube formation of rat primary myoblasts (Delaneyet al.2017;Melendezet al.2021;Hillegeet al.2022). MYL4 was annotated for the positive regulation of the ATPase activity term in our present analysis,which indicates that it is a regulator of muscle contraction. When ATPase is knocked out,skeletal muscle contraction is increased,and it mediates thermogenesis (Rathodet al.2021). Consistently,its reduction is known to cause the acceleration of myocardial contraction (Ciecierskaet al.2020). Our current findings thus provide a novel perspective for a better understanding of skeletal muscle myotube formation,early skeletal muscle development,and protein changes in post-injury regeneration in the goat.
5.Conclusion
In summary,proteomic and transcriptomic profiles of SSCs,myoblast and myotube were described,and key genes that may be associated with skeletal muscle cell development in two adjacent stages were selected. From them,we selectedSLMAPandSTOMfor silencing.SLMAPnegatively correlated withMyoD,and positively correlated withMyoGandMyosin7. Similarly,STOMnegatively correlated withMyoD,but positively correlated withMyoG,Myosin7,andDesmin. However,their clear regulatory role regarding skeletal muscle satellite cells needs to be further explored.
Acknowledgements
This work was supported by the National Natural Science Foundation of China (32172695),the Natural Science Foundation of Anhui Province,China (2108085Y11),the China Agriculture Research System (CARS-38),and the Open Project of Anhui Key Laboratory of Embryonic Development and Reproductive Regulation,Anhui Provincial Department of Science and Technology,China(FSKFKT019D).
Declaration of competing interest
The authors declare that they have no conflict of interest.
Ethical approval
All experiments were performed in accordance with relevant guidelines,and adhere to the ARRIVE Guidelines(https://arriveguidelines.org/) for the reporting of animal experiments. This study was carried out in accordance with the principles of the Basel Declaration and Recommendations of the Guide for the Care and Use of Laboratory Animals (http://grants1.nih.gov/ grants/olaw/references/phspol.htm). The protocol was approved by the ethics committee of Anhui Agricultural University,China under permit No.AHAU20101025.
Appendicesassociated with this paper are available on https://doi.org/10.1016/j.jia.2023.08.001
 Journal of Integrative Agriculture2023年10期
- Journal of Integrative Agriculture的其它文章
- The association between the risk of diabetes and white rice consumption in China: Existing knowledge and new research directions from the crop perspective
- Linking atmospheric emission and deposition to accumulation of soil cadmium in the Middle-Lower Yangtze Plain,China
- Genome-wide association study for numbers of vertebrae in Dezhou donkey population reveals new candidate genes
- Are vulnerable farmers more easily influenced? Heterogeneous effects of lnternet use on the adoption of integrated pest management
- lnfluences of large-scale farming on carbon emissions from cropping:Evidence from China
- Spatio-temporal variations in trends of vegetation and drought changes in relation to climate variability from 1982 to 2019 based on remote sensing data from East Asia