Experimental and theoretical investigations of the photoelectrochemical and photo-Fenton properties of Co-doped FeOCl
Jin-Huan Ma(马金环), Zhi-Qiang Wei(魏智强),2,†, Mei-Jie Ding(丁梅杰),Ji-Wei Zhao(赵继威), and Cheng-Gong Lu(路承功)
1School of Science,Lanzhou University of Technology,Lanzhou 730050,China
2State Key Laboratory of Advanced Processing and Recycling of Non-ferrous Metals,Lanzhou University of Technology,Lanzhou 730050,China
Keywords: Co doped FeOCl,photo-Fenton,photocatalytic,DFT calculations
1.Introduction
Nowadays,water pollution is a global issue that affects all nations.[1,2]Various synthetic organic dyes are discharged into wastewater and eventually into natural water bodies,and most of these compounds are persistent organic compounds.[3,4]Water pollution caused by persistent organic pollutants(POPs)is one of the most challenging large-scale problems of the 21st century.[5–7]This organic wastewater is highly harmful to human health and the aqueous environment,but these compounds are very difficult to naturally degrade or eliminate.[8,9]Due to its high toxicity, stability and biological persistence,Rhodamine B (RhB) can hinder plant growth and is one of the three main types of carcinogen produced by the textile industry.[10,11]Different wastewater treatment approaches,such as adsorption, coagulation and precipitation, have been suggested to lessen the environmental impact of POPs in water; however, these approaches only appear to transfer POPs from one phase to another.[12,13]Compared with these methods, a photo-Fenton reaction can degrade pollutants in water faster and more efficiently during wastewater treatment.[8,14]Throughout this process, H2O2stimulates the Fe2+/Fe3+cycle and generates a significant number of·OH radicals to efficiently degrade pollutants in water.[15,16]The degradation of persistent contaminants has drawn increasing attention to the photo-Fenton reaction.[17,18]Therefore, the development of photo-Fenton catalysts is highly significant from an economic and environmental perspective.[19,20]
In recent years, more and more Fe-based Fenton catalysts have been reported.[21]Gaoet al.[22]successfully synthesized the Z-type heterostructure of theα-Fe2O3@g-C3N4catalyst through co-calcination of melamine and iron-based metal–organic frameworks.This catalyst exhibits excellent photo-Fenton performance and high stability over a wide pH range.To address the issues of weak conductivity,easy aggregation and high optoelectronic recombination rate of Fe–Ni layered double metal hydroxide (FeNi-LDH), Yanget al.[23]created FeNi-LDH/Ti3C2.Therefore, developing the excellent photo-Fenton performance of iron-based catalysts has always been a key project in the fields of materials science and wastewater remediation.Moreover,defects caused by doping are also an effective method to modify a material.According to Yanget al.,[24]inherent flaws can frequently reveal more active sites,enhance conductivity,adjust the electronic state and promote ion diffusion, all of which can effectively improve catalytic performance.Sunet al.[25]demonstration of oxygen vacancy-rich vanadium-doped Co3O4emphasized the importance of heteroatoms and defects as a means of enhancing a material’s properties.
In this study, we combine experimental techniques with density functional theory(DFT)computations and propose the doping of Co into FeOCl, which is an orthorhombic narrowbandgap (1.8 eV) semiconductor.The doping of the transition metal Co mainly provides more ion capture centers for the catalyst, effectively separates electron–hole pairs, causes lattice defects and introduces impurity energy levels so that smaller energies can also excite electrons and expand the photoresponse range.Combined with density functional DFT calculations,the optimal geometric state,band structure and density of states distribution of surface atoms were determined.
2.Materials and methods
2.1.Synthesis of Fe1-xCoxOCl composites
All the chemicals used in this study were analytically pure, including ferric chloride hexahydrate (FeCl3·6H2O,≥99%),cobalt nitrate hexahydrate(Co(NO3)2·6H2O,≥99%),ethanol (C2H6O,≥99.7%), propan-2-ol [C4H10O (IPA),≥98.0%], acetone (C3H6O,≥99.5%), methanol [CH4O (IA),≥99%], 1,4-benzoquinone [C6H4O2(BQ),≥99%] and hydrogen peroxide(H2O2,≥99.5%),and no further purification was required for use.As shown in Fig.1, the Fe1-xCoxOCl composite was synthesized by a simple one-step calcination method.First, three equal portions of 2 g of FeCl3·6H2O were weighed, followed by 0.12 g, 0.28 g and 0.4 g of Co(NO3)2·6H2O, respectively.The two were dissolved in 5 ml H2O and sonicated for 30 min, then dried in a drying oven at 60°C for 12 h to evaporate the excess solvent.The dry solid was then heated in a muffle furnace to 250°C at a rate of 5°C·min-1and kept for 1 h.After natural cooling to room temperature, the solids were taken out and washed several times with C3H6O to remove excess FeCl3.The reddish-black powders obtained after drying were named Fe0.97Co0.03OCl,Fe0.94Co0.06OCl and Fe0.90Co0.10OCl,respectively.

Fig.1.Schematic illustration of the synthesis of Fe1-xCoxOCl.
2.2.Characterization
The functional groups of inorganic materials were characterized using a variety of techniques, including x-ray diffraction (XRD; Rigaku, Japan, D/Max-2400) with CuKradiation in the angle range of 10°–80°, scanning electron microscopy with a scanning rate of 0.2°·s-1and a step size of 0.02°,field emission scanning electron microscopy(FESEM;200FEG), high-resolution transmission electron microscopy(HRTEM;JEM-2010)and Fourier transform infrared(FT-IR)spectroscopy.The chemical state of elements on the material surface was assessed using x-ray photoelectron spectroscopy(XPS;PHI-5702),while a fluorophotometer was used for photoluminescence (PL) spectroscopy.A TU-1901 spectrophotometer was used to measure the UV–visible absorption spectrum.
2.3.Catalytic activity measurement and radical-trapping experiment
In a typical photocatalytic experiment,100 ml of neutral RhB solution containing 10 mg·l-1of catalyst was used.To get the solution to the adsorption and desorption equilibrium it was left for 30 min absorbing in the dark.After turning on the xenon lamp (VS-GCH-XE-300), 5 ml of the mixed solution was taken every 5 min to measure the absorbance with a UV spectrophotometer.Similar to this, without altering any conditions, 0.5 ml of H2O2was added to the solution before turning on the xenon lamp to perform the photo-Fenton experiment.By including IPA,BQ and IA in the radical trapping experiment,the active compounds impacting the photo-Fenton reaction were investigated.Furthermore,the composites were subjected to five-cycle stability photo-Fenton tests.
2.4.DFT calculations
All the spin-polarized calculations were performed using the CASTEP program with the generalized gradient approximation and the Perdew–Burke–Ernzerhof exchangecorrelation functional.[26]As shown in Fig.2, FeOCl crystal has a layered structure and its primitive bulk unit contains Fe, O and Cl atoms.The optimized lattice parameters area=0.3330 nm,b=0.8360 nm andc=0.3860 nm, in agreement with the values on the XRD characterization standard card JCPDS 72-0619 (a=0.3780 nm,b=0.7917 nm,c=0.3302 nm).The Brillouin zone was sampled using the ORC lattice with the following path:C–X–S–Y–C–Z–U–R–T–Z|Y–T|U–X|S–R.[27]
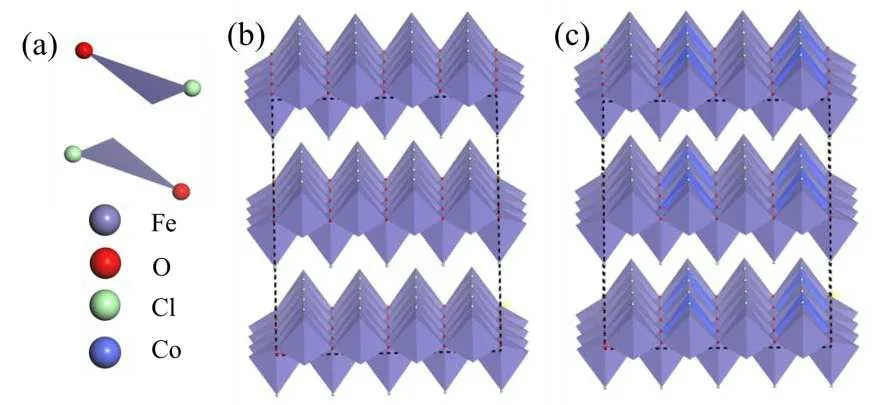
Fig.2.Structure of a primitive bulk unit (a), supercell of FeOCl crystal(b)and supercell of Co doped FeOCl crystal(c).
3.Results and discussion
3.1.Crystal structure and morphological analysis
According to the XRD patterns of all samples in Fig.3(a),the orthogonal FeOCl(JCPDS 72-0619)crystal planes(010),(110), (021), (111), (200), (131), (002) and (022) are represented by diffraction peaks at 2θ=11.05°, 26.03°, 35.45°,38.10°, 48.10°and 60.89°in the Co-doped FeOCl species.It demonstrates that following Co doping, the FeOCl crystal structure remained unchanged,and no additional immediately apparent distinctive peaks were discovered,demonstrating the extremely high degree of purity of the samples used.However,because Co(NO3)2is acidic after hydrolysis, the intensity of the diffraction peak is obviously weakened,which may be related to the environment of FeCl3before calcination.When the peaks are at 2θ=26.03°and 35.45°,the diffraction peaks are gradually intensified as the amount of doping increases,and the diffraction peaks of all doped samples are broadened compared with the undoped samples.This may be caused by lattice distortion due to Co doping.However, the diffraction peaks of Fe1-xCoxOCl shifted to bigger angles than those of FeOCl(Fig.3(b)),illustrating the incorporation of Co into the FeOCl lattice.
SEM was used to determine the morphology of the synthesized material.As seen in Fig.4(a), pure FeOCl demonstrated an obvious irregular sheet stack structure.The SEM image of the Fe0.94Co0.06OCl nanosheet is compared with pure FeOCl to show the effect of Co doping in Fig.4(b).It is found that the doped sample possesses a rough surface and nanosheets.

Fig.4.SEM images of(a)FeOCl and(b)Fe0.94Co0.06OCl.
Figure 5 was used to further explore the morphology and shows lattice changes of Co-doped FeOCl compared with pure FeOCl.The TEM images of pure FeOCl and Fe0.94Co0.06OCl are consistent with the SEM image,as shown in Figs.5(a)and 5(c), while Figs.5(b) and 5(d) show the HRTEM images of pure FeOCl and Fe0.94Co0.06OCl samples, respectively.The interplanar distance of Fe0.94Co0.06OCl(0.190 nm)with clear lattice fringes is greater than that of pure FeOCl (0.188 nm),demonstrating that the crystal lattice tends to expand as a result of the different metal ion radii.It is evident from the interpolated chosen electron diffraction pattern that FeOCl is a single crystal and that doping with Co causes the diffraction spot to change into a diffraction ring.Diffraction rings(inner to outer) are consistent with those of the FeOCl structure in XRD.In short,Co was successfully doped into FeOCl.
To get the elemental composition of the sample, we tested the energy-dispersive x-ray(EDS)spectrum as shown in Fig.6(a).Fe0.94Co0.06OCl contains three main elements (Fe,O and Cl), but it can also be observed that the characteristic peak of the doped element Co is located at 2.86 keV.The presence of Co can also be seen from TEM mapping(Figs.6(c)–6(f)).It can be seen that the elements are evenly distributed and there is no enrichment.

Fig.6.(a)EDS pattern and(c)–(f)the corresponding element mappings for Fe0.94Co0.06OCl.
3.2.Optical properties
XPS was used to characterize the composition and chemical state of the material surface, and all XPS data were adjusted by 284.8 eV for C 1s.[28]The complete XPS spectrum of Fe,O and Cl elements found in FeOCl and Fe0.94Co0.06OCl is shown in Fig.7(a).It was found that Co 2p replaces Fe 2s in the full spectrum of Fe0.94Co0.06OCl.The satellite peak of Fe 2p is shown in Fig.7(b), with peak locations at 711.4 eV and 725.2 eV,respectively,for Fe 2p3/2and Fe 2p1/2of Fe0.94Co0.06OCl.[29,30]The lower binding energy of Fe 2p in Fe0.94Co0.06OCl compared with FeOCl indicates the reduction of the valence state Fe3+in Fe0.94Co0.06OCl.[31]The O 1s peak appears between 531.5 eV and 530.5 eV in Fig.7(c),while the peak at 530.5 eV matches the Fe–O or Co–O in Fe0.94Co0.06OCl.The peak at 531.5 eV and other O peaks are attributed to H2O and·OH.[32,33]Figure 7(d) shows the XPS spectrum of Co 2p where the peak position appears at 798.0 eV and 783.4 eV to match Co 2p1/2or Co 2p3/2of metal Co.[34]Among them,the peak at 783.4 eV is the satellite peak of Co3+and the peak at 798.0 eV is the satellite peaks of Co2+,indicating that Co exists in the state of Co2+and Co3+in the composite material.The spectrum of Cl 2p in Fig.7(e)reveals that the peaks at 198.8 eV and 200.0 eV may be related to the Fe–Cl or Co–Cl bonds of Fe0.94Co0.06OCl.[35]The XPS results proved that Co was successfully incorporated into FeOCl.

Fig.7.High resolution XPS:(a)survey spectra,(b)Fe 2p,(c)O 1s,(d)Co 2p and(e)Cl 2p of FeOCl and Fe0.94Co0.06OCl.
FT-IR was used to characterize the functional groups of materials and the scan range was 400 cm-1–4000 cm-1.The bending and stretching modes of O–H and H–O–H induced by H2O adsorbed on the surface of the material can be seen in Fig.8 with a wide and smooth strong absorption peak appearing at 3300 cm-1–1600 cm-1.[36,37]The peak at 1500 cm-1–1600 cm-1can be attributed to ethanol or chemical substances added during test preparation.[38]At 814 cm-1, the bending vibration of OH was also noticed.The Fe–O peak of the changed material at 496 cm-1exhibits a clear redshift when compared with pure FeOCl.This redshift is brought on by the vibration of Fe–O–Co and demonstrates that Co and FeOCl are involved in the interaction.[36–38]The bending vibration of OH was also observed at 814 cm-1.Compared with pure FeOCl, the Fe–O peak of the modified material at 496 cm-1undergoes an obvious redshift, which is caused by the vibration of Fe–O–Co,showing there is interaction between Co and FeOCl.[36]

Fig.8.FT-IR spectra of Fe1-xCoxOCl.
The light absorption capacity of a catalyst has an important effect on its catalytic activity.[39]The visible light absorption spectra of Fe1-xCoxOCl composites are shown in Figs.9(a)–9(d), and it was discovered that the composite had a broad absorption band between 500 nm and 700 nm and a short absorption tail at 750 nm.Compared with pure FeOCl,the absorption intensity of the composite sample is obviously improved in the range of 500 nm–700 nm,and the absorption edge redshift is in the range of 500 nm–700 nm.This indicates that Co doping in FeOCl can enhance the response range in the visible light region.Additionally,the Tauc formula is used to determine the material’s semiconductor bandgap value[40]
wherendepends on the type of semiconductor.Fe1-xCoxOCl composite semiconductor materials are indirect bandgap semiconductors (obtained from the band structure calculated by DFT).Therefore, it is further concluded that the bandgaps of FeOCl, Fe0.97Co0.03OCl, Fe0.94Co0.06OCl and Fe0.90Co0.10OCl nanosheet in Table 1 are 1.80 eV, 1.76 eV,1.71 eV and 1.68 eV, respectively, indicating that the semiconductor bandgap is reduced after modification, broadening the light absorption range.This could be the result of doping, which raises the bandgap impurity levels and affects the electronic structure.[41]

Fig.9.(a)–(d)UV–visible absorption spectra.The insets show the(αhv)1/2–hv curve of Fe1-xCoxOCl.
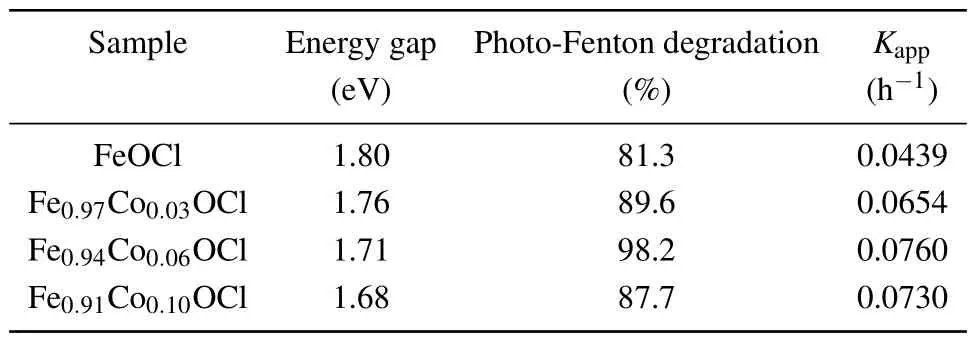
Table 1.Bandgap, degradation percentage of the dye after 50 min of reaction and the apparent first-order reaction rate constant for the photo-Fenton process over a Fe1-xCoxOCl nanosheet.

Fig.10.PL spectrum of Fe1-xCoxOCl.
Figure 10 shows the photoluminescence spectra of Fe1-xCoxOCl with an excitation wavelength of 503 nm at room temperature.The figure demonstrates that there is a strong emission peak between 600 nm and 650 nm, and the orange–red light corresponds to a transition from a Fe vacancy energy level to an O or Cl.The intensity of the emission peak decreases with increase in the Co ion concentration.The impurity level introduced by Co ion doping is thought to be the cause of this phenomenon.
3.3.DFT calculations
To calculate the band structure of FeOCl and Fe0.94Co0.06OCl, the Fermi level was set to 0 thek-points were (2×2×1), the kinetic energy cutoff was 400 eV and the convergence criteria for energy and atomic forces were,respectively, 10-5eV/atom and 0.03 eV·˚A-1.It was demonstrated unequivocally that the maximum of the valence band(VB) and the minimum of the conduction band (CB) in the reciprocal space are theGandRpoints, respectively.Hence,it could be judged that FeOCl and Fe0.94Co0.06OCl are both indirect bandgap semiconductors.The calculated bandgaps of FeOCl and Fe0.94Co0.06OCl are about 1.76 eV and 1.66 eV,which are slightly less than those determined by UV–visible absorption measurement.This is primarily because the DFT calculation is an approximation that uses one electron, making it easy to underestimate the bandgap value.The density of states analysis(Figs.11(b)and 11(d))shows that the electronic states pass through the Fermi level of both spin components,suggesting metallic features and enhanced conductivity.It can be seen from the figure that the material has two states after spin polarization: semiconducting in spin-up and metallic in spin-down.The excellent activity of the material is due to the fact that spin polarization leads to different d-bands.
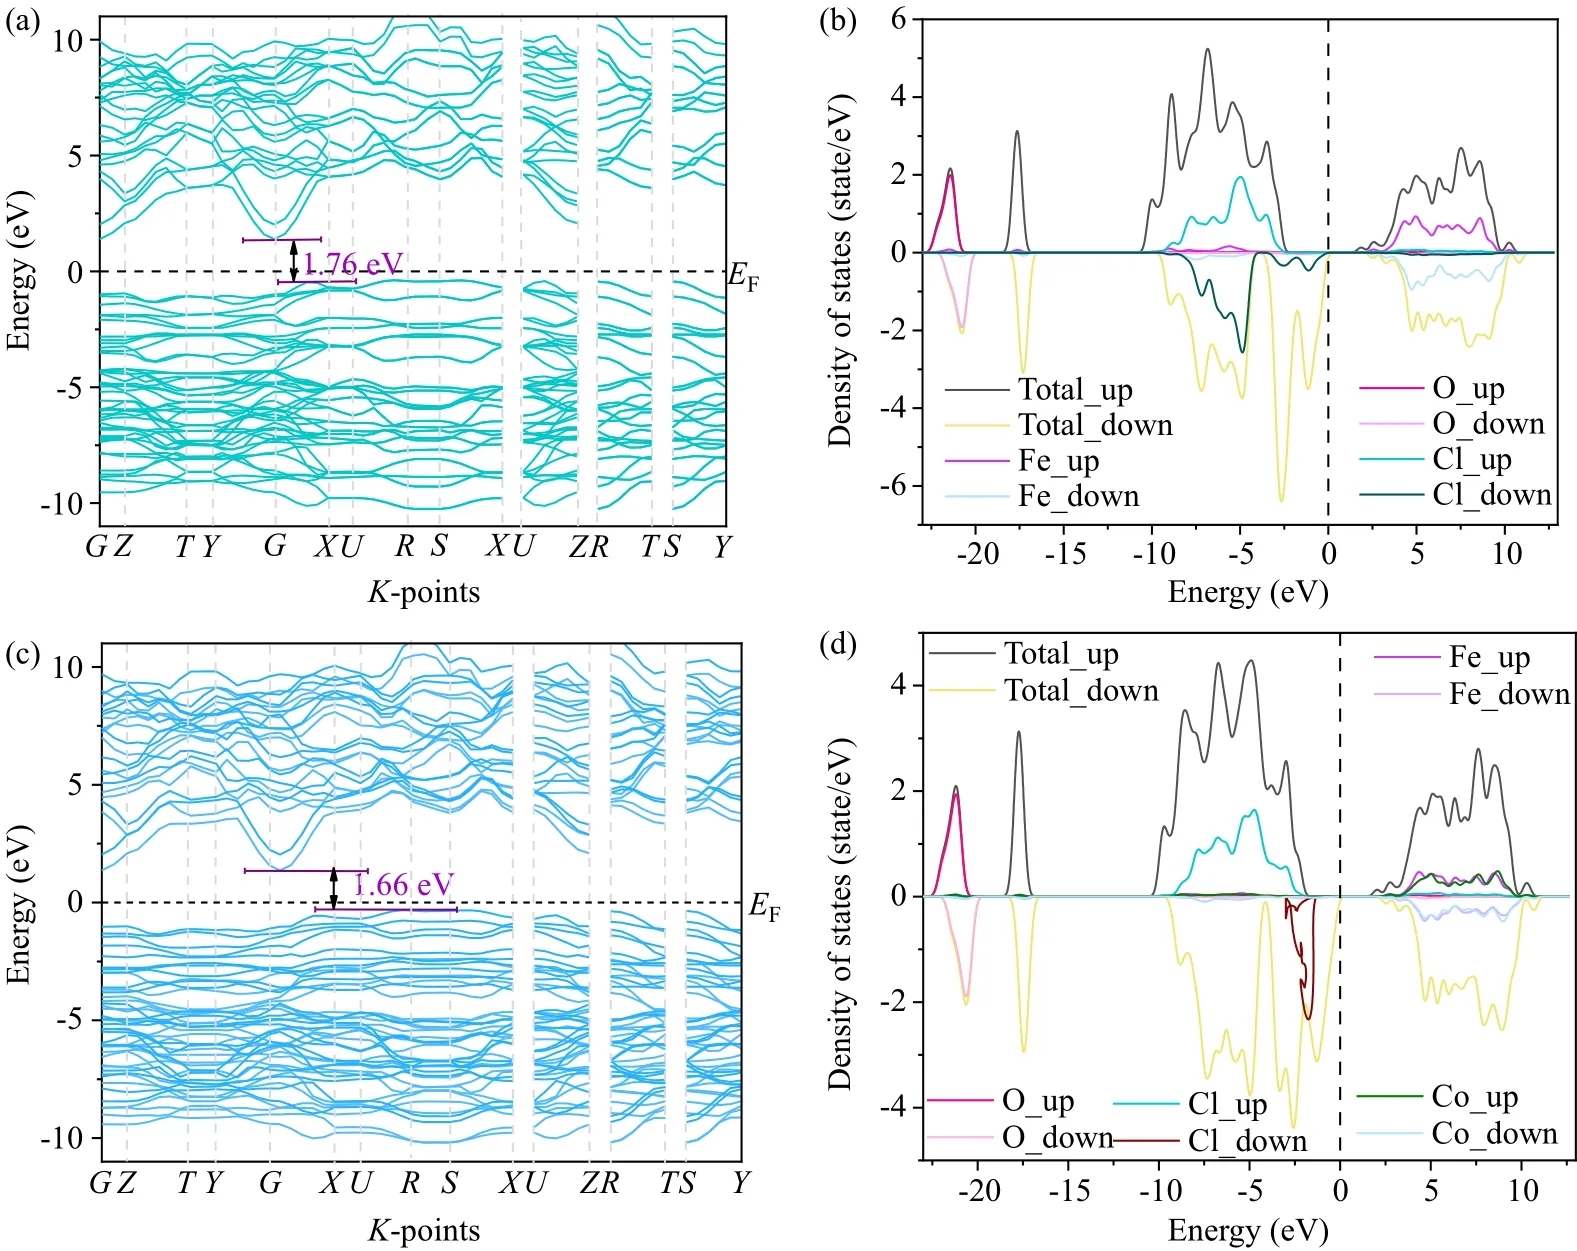
Fig.11.Calculated band structure and density of states of[(a)and(b)]FeOCl and[(c)and(d)]Fe0.94Co0.06OCl.
3.4.Photocatalytic and photo-Fenton performances for RhB
The photocatalytic activity of the as-obtained catalysts was evaluated based on the degradation of 10 mg·l-1aqueous RhB solution under visible-light illumination.Adsorption–desorption equilibrium was realized between the catalysts and RhB after adsorbing for 30 min in the dark.It was found that Co-doped FeOCl significantly increased the adsorption capacity.Figure 12(a)represents the degradation of RhB as a function of reaction time in various photocatalytic processes.There is no significant decolorization of RhB under simulated sunlight illumination without the catalyst,indicating that RhB is stable under visible light.RhB is only slightly degraded during the photocatalytic process with FeOCl, which illustrates the weak photocatalytic performance of FeOCl.Figure 12(c) exhibits the photo-Fenton performance of the synthesized materials in the removal of RhB under visible light,affirming that the removal of RhB can be attributed to combined action by photocatalytic, photo-Fenton and adsorption processes.When FeOCl, Fe0.97Co0.03OCl, Fe0.94Co0.06OCl and Fe0.90Co0.10OCl are applied as photo-Fenton catalysts,the degradation rates of RhB are 81.3%,89.6%,98.2%and 87.7%over 50 min, respectively.In short, Co doping obviously improves the photocatalytic performance of FeOCl.In addition,the photocatalytic and photo-Fenton degradation process was fitted by first-order kinetics
whereC0is the initial solution concentration,Ctis the solution concentration at timetandkis the reaction rate constant.As shown in Figs.12(b) and 12(d), the material shows good linearity, and the photocatalytic and photo-Fenton constants of Fe0.94Co0.06OCl are 11.28 and 1.73 times that of FeOCl.Therefore,the doping of FeOCl with Co effectively improves the photocatalytic and photo-Fenton properties of FeOCl, especially the photocatalytic performance.

Fig.12.(a)Photocatalytic degradation,(c)photo-Fenton degradation and[(b)and(d)]the corresponding kinetic plots over Fe1-xCoxOCl.
In order to study the radicals that play a major role in RhB degradation, IPA, IA and BQ were added to the photo-Fenton experiment with Fe0.94Co0.06OCl.IPA,IA and BQ are known to be effective inhibitors of·OH,h+and·O-2radicals.In Fig.13(a),the addition of IPA reduced the degradation rate of RhB from 98%to 90%, the presence of IA had almost the same effect as IPA,and BQ had hardly any effect on the experiment.This shows that·OH and h+are the main active species and the·O-2radical plays a secondary role.This further indicates that modified Fe0.94Co0.06OCl has higher carrier separation efficiency.The catalyst was collected after the photo-Fenton experiment to test the catalyst’s ability to be recycled.The catalyst was washed with deionized water many times and reused after drying.In this paper,five cycle experiments were carried out and it was found that the rate of removal of RhB decreased from 99.8% in the first cycle to 84.5% in the fifth cycle(Fig.13(b)).In short,it can be seen from the cyclic experiment that Fe0.94Co0.06OCl could potentially be reused.

Fig.13.(a)Effects of different capture agents and(b)recyclability of five runs in the presence of Fe0.94Co0.06OCl.
The XRD pattern and SEM image of Fe0.94Co0.06OCl catalyst for RhB photo-Fenton degradation are displayed in Figs.14(a) and 14(b).There is no obvious shift or additional peaks, showing that the crystal phase structure of Fe0.94Co0.06OCl remained unchanged.But the peak intensity is significantly weaker, showing that the crystallinity of the catalyst changes obviously.This result is also seen in the SEM images of FeOCl,whose morphology is highly aggregated.It is also the reason why the degradation rate of RhB decreases from 98%to 82%.
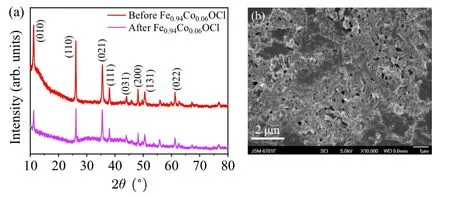
Fig.14.(a)XRD patterns and(b)SEM images of Fe0.94Co0.06OCl photocatalyst before and after the photo-Fenton degradation experiment.
3.5.Possible photo-Fenton mechanism
Based on the results of the aforementioned analysis,the mechanism of RhB degradation by Fe0.94Co0.06OCl was drawn as shown in Fig.15.The excellent photocatalytic and photo-Fenton properties of the modified materials under neutral conditions are attributed to the following aspects.First,the Co doping introduces an impurity energy level, which broadens the photoresponse range and provides more trapping centers for carriers.These electrons accelerate the cycling reaction between Fe3+and Fe2+.Second, because Co is a transition metal like Fe, the cycling of Co2+/Co3+ions also produced more·OH and h+.The existence of Co2+and Co3+in Fe0.94Co0.06OCl has been proved by XPS.Finally, based on previous research to confirm the VB potential of FeOCl and Fe0.94Co0.06OCl, the VB spectrum was measured and the results were about 2.47 eV and 2.44 eV.The energy band edge position of the CB of the FeOCl and Fe0.94Co0.06OCl nanoparticles was determined by the following equation:
whereEgis the sample band gap.The conduction bands of FeOCl and Fe0.94Co0.06OCl nanosheets by calculation are 0.67 eV and 0.73 eV.
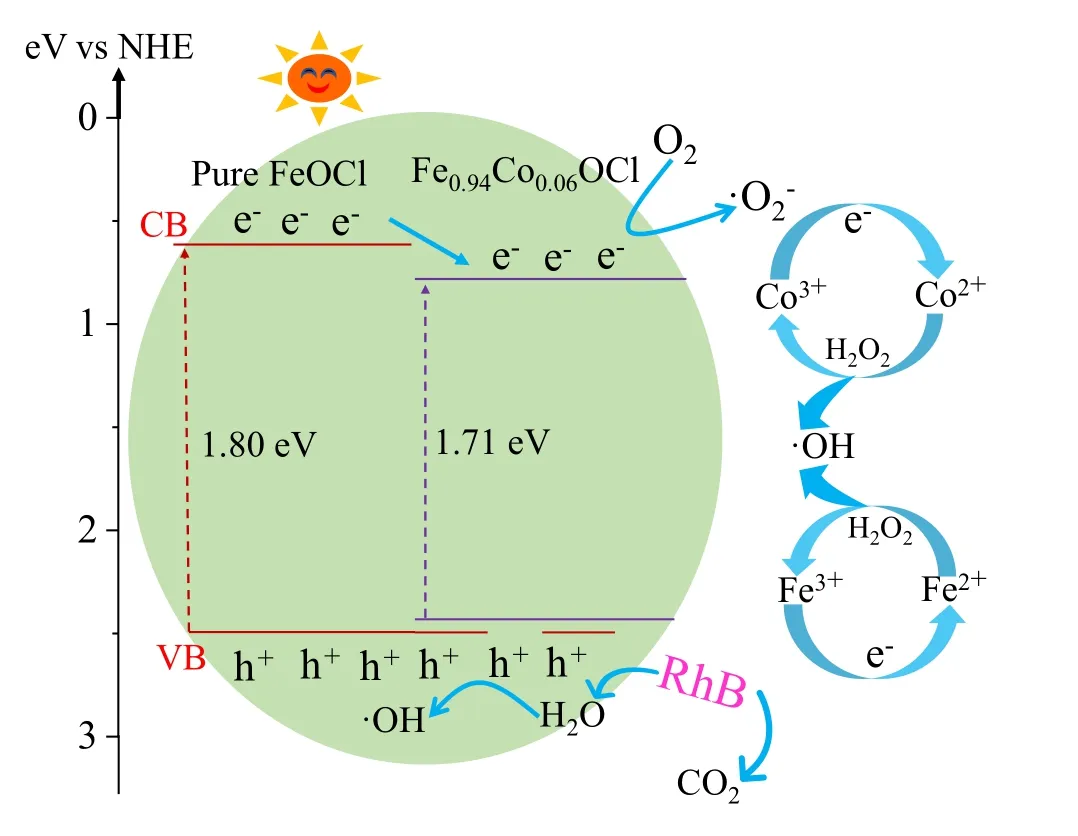
Fig.15.Catalytic mechanism in the Fe0.94Co0.06OCl system (vs NHE:versus normal hydrogen electrode).
The entire catalytic degradation process of RhB is expressed in several formulae.When the catalyst semiconductor is subjected to energy (hv)≥bandgap energy (Eg),the electron–hole pairs on the catalyst surface are activated(Eq.(4)).[42]Some of the electrons in the conduction band will capture O2to form O-2(Eq.(5)), and·O-2reacts with H2O2to form OH (Eq.(7)).This is the reason why O-2is not the main active species,[43]and other electrons participated in the cycling experiment of Fe3+/Fe2+(Eq.(10)) and Co3+/Co2+(Eq.(11)) ions.In this process, a large amount of h+is produced and some of the of h+adsorb H2O to generate·OH(Eq.(6)).H2O2mainly oxidizes Fe2+and Co2+into Fe3+and Co3+(Eqs.(8) and (9)), producing a large amount of·OH.This result is consistent with that of the radical capture experiment.Therefore, RhB is degraded into small inorganic molecules such as H2O and CO2by·OH, h+and a few·O-2active species(Eq.(12)):
4.Conclusion
In conclusion, using the one-step calcination method, a series of Fe1-xCoxOCl catalysts were successfully synthesized.EDS and TEM mapping results showed that the prepared complexes contained Co.XPS characterization results further indicated that Co ions exist in divalent and trivalent states like Fe ions.Additionally, when the Fe1-xCoxOCl underwent a photo-Fenton reaction it was discovered that Fe0.94Co0.06OCl had exceptional catalytic capabilities in neutral solution at ambient temperature and under visible light.This was further illustrated by the increased density of photogenerated carriers found by PL characterization and DFT calculations.Most importantly, this doping method not only changes the photocatalytic performance of FeOCl, but also changes the cycling stability of FeOCl.
Acknowledgments
Project supported by the National Natural Science Foundation of China (Grant No.52268042), the Natural Science Foundation of Gansu Province, China (Grant No.22JR5RA253), and HongLiu First-Class Disciplines Development Program of Lanzhou University of Technology.
- Chinese Physics B的其它文章
- Dynamic responses of an energy harvesting system based on piezoelectric and electromagnetic mechanisms under colored noise
- Intervention against information diffusion in static and temporal coupling networks
- Turing pattern selection for a plant–wrack model with cross-diffusion
- Quantum correlation enhanced bound of the information exclusion principle
- Floquet dynamical quantum phase transitions in transverse XY spin chains under periodic kickings
- Generalized uncertainty principle from long-range kernel effects:The case of the Hawking black hole temperature

