
Hubble WFC3 Spectroscopy of the Terrestrial Planets L98–59c and d: No Evidence for a Clear Hydrogen Dominated Primary Atmosphere
2023-03-25 07:36LiZhouBoMaYongHaoWangandYiNanZhu
Li Zhou,Bo Ma,Yong-Hao Wang,and Yi-Nan Zhu
1 School of Physics and Astronomy,Sun Yat-sen University,Zhuhai 519082,China;mabo8@mail.sysu.edu.cn
2 CSST Science Center for the Guangdong-Hong Kong-Macau Greater Bay Area,Sun Yat-sen University,Zhuhai 519082,China
3 School of Science,Hainan University,Hainan 570228,China
4 National Astronomical Observatories,Chinese Academy of Sciences,Beijing 100101,China
Abstract The nearby bright M-dwarf star L 98–59 has three terrestrial-sized planets.One challenge remaining in characterizing atmospheres around such planets is that it is not known a priori whether they possess any atmospheres.Here we report on study of the atmospheres of L 98–59 c and L 98–59 d using near-infrared spectral data from the G141 grism of Hubble Space Telescope(HST)/Wide Field Camera 3.We can reject the hypothesis of a clear atmosphere dominated by hydrogen and helium at a confidence level of ∼3σ for both planets.Thus they could have a primary hydrogen-dominated atmosphere with an opaque cloud layer,or could have lost their primary hydrogen-dominated atmosphere and re-established a secondary thin atmosphere,or have no atmosphere at all.We cannot distinguish between these scenarios for the two planets using the current HST data.Future observations with the James Webb Space Telescope would be capable of confirming the existence of atmospheres around L 98–59 c and d and determining their compositions.
Key words: planets and satellites: atmospheres–planets and satellites: terrestrial planets–instrumentation:spectrographs–planets and satellites: individual (L 98-59 c,L 98-59 d)
1.Introduction
Thus far,more than 5000 exoplanets have been discovered,among which planets of 1 ∼10M⊕orbiting around late-type stars are the most abundant exoplanets (Fulton &Petigura 2018;Ma et al.2018;Edwards et al.2021).There is a dichotomy in the occurrence rate distribution of small planets: sub-Neptunes withRp=2.0 ∼3.0R⊕and super-Earths withRp≤1.5R⊕(e.g.,Fulton &Petigura 2018).The dichotomy of occurrence rate suggests that the main composition of planets with larger radii(≥1.8R⊕) could be volatile (e.g.,Rogers &Seager 2010),whereas for smaller planets,models with more negligible atmospheres are preferred(e.g.,Dressing et al.2015).The deficit of planets with a radius of 1.5 ∼2.0R⊕and short orbital periods in the occurrence rate distribution can be explained by photoevaporation,which could result in stripping the primordial H/Hegas envelope(Fulton et al.2017;Owen&Wu 2017).There is also a deficit of massive giant planets and brown dwarfs with short orbital periods,which is not fully understood yet(Grether&Lineweaver 2006;Ma &Ge 2014).
One of the most important goals in exoplanet study is to search for terrestrial planets that may be habitable via detection of atmospheric biosignatures.Transiting exoplanet observations combined with detailed theoretical models and retrieval methods can provide valuable insights into a wide range of physical processes and chemical compositions in exoplanetary atmospheres (Seager &Sasselov 2000;Madhusudhan 2019;Wordsworth &Kreidberg 2022).However,due to the extremely weak signal (several tens of ppm),the atmospheric properties of rocky planets have still not been well characterized so far.
Up until now,there have only been several tentative studies of terrestrial planetary atmospheres using Hubble Space Telescope(HST)/Wide Field Camera 3 (WFC3) transmission spectra,and most of these planets orbit nearby bright M dwarfs.For example,Kreidberg et al.(2014)and Knutson et al.(2014)found no evident molecular absorption in the spectra of GJ 1214 b and HD 97658 b respectively,where they rule out the cloud-free atmospheric models and suggested these planets possess cloudy atmospheres with molecules heavier than hydrogen.The possibility of primary hydrogen-dominated clear atmospheres was also ruled out for seven Earth-sized planets in the TRAPPIST-1 system (de Wit et al.2016,2018;Garcia et al.2022;Gressier et al.2022).Tsiaras et al.(2016a) analyzed the transmission spectrum of a highly irradiated super-Earth,55 Cancri e,and found that the spectrum departs from a straight line model with a 6σ confidence level.They identified HCN as the source to explain the absorption features at 1.42 and 1.54 μm.Tsiaras et al.(2019) reported the first detection of water vapor in the spectrum of super-Earth K2-18 b with high statistical confidence.Edwards et al.(2021)found a temperate super-Earth,LHS 1140 b,could also have water vapor in its atmosphere.However,limited by the observation data,they could not distinguish between the primary atmosphere model and the secondary atmosphere model (Edwards et al.2021).Swain et al.(2021)found the transmission spectrum of the highly irradiated Earth-sized planet,GJ 1132 b,showed spectral signatures of HCN and CH4in an atmosphere with low mean molecular weight.However,Mugnai et al.(2021)re-analyzed the GJ 1132 b system and did not find any molecular signatures claimed by Swain et al.(2021),which demonstrates the difficulty of using HST data to study the atmospheres of rocky planets.With the upcoming new facilities,such as James Webb Space Telescope (JWST;Greene et al.2016;Birkmann et al.2022;Constantinou &Madhusudhan 2022;Hinkley et al.2022;The JWST Transiting Exoplanet Community Early Release Science Team et al.2022;Whittaker et al.2022) and Ariel (Tinetti et al.2018),the study of atmospheres of rocky planets will no doubt enter a new era.
L 98–59 is a nearby(10.6 pc)bright(K=7.1 mag)M3 dwarf star.The Transiting Exoplanet Survey Satellite (TESS) has discovered three terrestrial planets in this system (Cloutier et al.2019;Kostov et al.2019).They all have a radius less than 1.6R⊕and an orbital period ranging from 2.25 to 7.45 days.Demangeon et al.(2021)found evidence for a fourth non-transiting planet,and a possible fifth non-transiting small planet in the system.The atmospheric properties of the innermost planet L 98–59 b were studied by Zhou et al.(2022) and Damiano et al.(2022).Both studies rejected the hypothesis that L 98–59 b has a cloud-free hydrogen-dominated primary atmosphere.The HST observation results of planets c and d (proposal 15856,PI: Thomas Barclay)will be reported in this paper.Planets c and d will also be observed by JWST in 0.6–5 μm in Cycle 1.Thus L 98–59 is set to be one of the best characterized planetary systems with multiple terrestrial planets.
In this study,we present our analysis of the atmospheric properties of the two outermost planets,L 98–59 c and L 98–59 d,using the near-infrared transmission spectrum obtained with the HST/WFC3 G141 grism.The outline of this paper is arranged as follows.We first describe our data analysis in Section 2,which includes raw data reduction,white and spectral light curve extraction using Iraclis,and atmospheric retrievals using TauREx.The main results and discussion are provided in Section 3.In the last section,we give a conclusion about our atmospheric study on planets L 98–59 c and L 98–59 d.
2.Data Analysis
2.1.Data Reduction
We downloaded publicly available transiting observation data of L 98–59 c and L 98–59 d from the Mikulski Archive for Space Telescopes (MAST,proposal 15856,PI: Thomas Barclay).The near-infrared spatially scanned spectroscopic images were obtained using the HST/WFC3 G141 grism on 2020 April 7th(for L 98–59 c)and 2021 January 19th and 20th(for L 98–59 d).The images were obtained with the 512×512 subarray with an exposure time of 69.62 s The scan rate is 0496 per second and the total scan length is about 3792.We adopted the open source pipeline Iraclis5https://github.com/ucl-exoplanets/Iraclisto reduce the observations and extract the white and spectral light curves from raw spatially scanned spectroscopic images of HST/WFC3 (Tsiaras et al.2016a,2016b).The raw spectroscopic data were first processed using the following steps:zero-read subtraction,reference pixels correction,nonlinearity correction,dark current subtraction,gain conversion,sky background subtraction,calibration,flat-field correction,bad pixels removal and cosmic-ray correction.We refer the reader to Tsiaras et al.(2016b) for more details.
We exclude the first orbit for each observation in our data analysis to avoid the stronger wavelength-dependent ramp.When extracting white and spectral light curves from reduced scanned spectroscopic images,we take into account the geometric distortions caused by the tilted detector of the WFC3 infrared channel.The horizontal and vertical shifts are calculated against the first frame in each scan,and are plotted in Figure 1.We find shifts on the scale of about 0.1 pixel during the visit,which are not significant enough to affect the final transmission spectrum.We then obtain the white light curves by integrating across the full wavelength range of WFC3/G141 (1.088 ∼1.68 μm).The raw white light curves and sky ratio variation during the visit (sky background relative to the master-sky frame) are depicted in Figure 2.We also obtain a set of spectral light curves using the default “high” resolution from Iraclis as the wavelength bins,corresponding to a resolving power of 70 at 1.4 μm.We adopt the nonlinear formula proposed in Claret (2000),together with the stellar models of Phoenix(Claret 2018)and stellar parameters of L 98–59 listed in Table 1(Demangeon et al.2021)to calculate the limb darkening coefficients.
We extract the white and spectral light curves by taking into account the time-dependent systematic noises of long-term and short-term ramps,which can be characterized by a linear trend and an exponential trend,respectively.The systematics are removed by multiplying a normalization factor and an instrumental correction factor.For the white light curve fitting,the systematics are fitted by
wherenwis the normalization factor,which isfor upward scanning directions andfor downward scanning directions.In this equation,t,T0andt0are time,mid-transit time and beginning time of each orbit,respectively.Also,rais the linear trend coefficient during each visit andrb1andrb2are exponential trend coefficients along each orbit(Tsiaras et al.2016a,2016b).When fitting the white light curves,we set the mid-transit time andRp/R* as free parameters.Other parameters,such as inclination,a/R* and stellar parameters,are fixed,which are listed in Table 1.The fitted white light curves for L 98–59 c and L 98–59 d are plotted in Figure 3.

Figure 1.Horizontal (top panels) and vertical (bottom panels) shifts for each frame observation of L 98–59 c and L 98–59 d.The heavier colors represent forward scans and lighter colors signify reverse scans.All shifts are calculated against the first frame in each scan.

Figure 2.Top panels: raw white light curves for forward scans (heavier colors) and reverse scans (lighter colors) of L 98–59 c and L 98–59 d.Bottom panels: sky background relative to the master sky frame.

Table 1 Parameters of L 98–59 c and L 98–59 d Applied in Iraclis and TauREx
For spectral light curves,we fit the systematics by
whererλis the wavelength-dependent linear systematic trend coefficient along each visit,LCwis the white light curve andMwis the best fit white light curve model.Similar to Equation(1),nλisfor upward scanning directions andfor downward scanning directions.In the process of spectral light curve fitting,we setRp/R* as the only free parameter.Other planetary parameters,stellar parameters and orbital parameters are fixed.The fitted spectral light curves for L 98–59 c and L 98–59 d are displayed in Figures 4 and 5,respectively.The left panels present de-trended spectral light curves together with the best fit models at each wavelength bin.The right panels feature the standard deviation of the residuals with respect to the photon noise (),reduced chi-square of residuals from the ftiting (2) and autocorrelation function (AC) during the transits.The final transmission spectra are obtained and shown in Figure 6,with a mean uncertainty of about 45 and 57 ppm for L 98–59 c and L 98–59 d,respectively.From the figure,we cannot see strong absorption features in their transmission spectra for both L 98–59 c and L 98–59 d.

Figure 3.White light curves (top panels) and model fitting residuals (bottom panels) of L 98–59 c (left panels) and L 98–59 d (right panels).
2.2.Atmospheric Retrieval
We use TauREx36https://github.com/ucl-exoplanets/TauREx3_public(Waldmann et al.2015;Al-Refaie et al.2021)to perform atmospheric retrieval analysis for L 98–59 c and L 98–59 d.TauREx3 adopts the nested sampling algorithm Multinest(Feroz&Hobson 2008;Feroz et al.2009,2011,2019;Buchner et al.2014)to map the atmospheric parameter space and find the best fit model for the observed transmission spectrum with a Bayesian analysis framework.
In our retrieval analysis,we set the planetary radius in the range of 0.6Rpto 1.6Rpas the priors,the equilibrium temperature of the planet in the range of 0.6Teqto 1.6Teq,the tolerance evidence to 0.5 and the number of live points to 1500 for the nested sampling.Rp(1.385R⊕for L 98–59 c and 1.521R⊕for L 98–59 d)andTeq(553 K for L 98–59 c and 416 K for L 98–59 d) are the prior values taken from Table 1.Considering the narrow wavelength range of our observed data,we perform the atmospheric retrieval using an isothermal temperature-pressure profile with 100 planeparallel layers,with pressure varying from 10−3to 106Pa.The molecular abundance is assumed to be constant in each layer,which does not vary with altitude.
The absorption trace gases included in the model are taken from ExoMol (Tennyson et al.2016;Chubb et al.2021),HITEMP (Rothman et al.2010) and HITRAN (Rothman et al.1987),such as H2O(Polyansky et al.2018),CO2(Rothman et al.2010),CO(Li et al.2015),CH4(Yurchenko&Tennyson 2014),NH3(Coles et al.2019),HCN (Barber et al.2014),TiO(McKemmish et al.2019)and VO(McKemmish et al.2016).We also include collision-induced absorption (CIA) of H2–H2(Abel et al.2011;Fletcher et al.2018),H2–He (Abel et al.2012) and Rayleigh scattering.The gray clouds(Lee et al.2013)are included with the top pressure of clouds ranging from 10−3to 106Pa.We introduce H2,He and N2as filling gases since they only contribute to the mean molecular weight and do not display absorption features in the spectrum.We fix the ratio between He and H2abundance to the solar value of 0.17.
We perform both primary and secondary atmospheric model retrievals.In the hydrogen-rich primary atmospheric model,we allow the ratio between N2and H2abundance to vary from 10−12to 10−2,and the volume mixing ratios (VMRs) of all trace gases to vary from 10−12to 10−1.In the secondary atmospheric model,we allow the ratio between the abundance of N2and H2to vary from 10−12to 104,and the VMRs of other gases to vary from 10−12to 1,which can be used to model a thin atmosphere with high mean molecular weight.We also choose to perform between cloudy and clear atmospheric retrievals by including or excluding gray clouds in the atmospheric models.We also conduct a flat-line atmospheric retrieval,which only includes gray clouds in the model.The flat-line model is regarded as a baseline for comparison to evaluate the significance of other models.
3.Results and Discussion
In this section,we will present our atmospheric modeling results,investigate possible spectral contamination from stellar activities and discuss the implication of studying this system with future space missions.
3.1.Retrieval Results
We conducted five different model retrievals for both L 98–59 c and L 98–59 d.The HST transmission spectra of L 98–59 c and L 98–59 d,together with the different model fitting results,are depicted in Figure 6.The 1σ(shadow regions with heavier colors) and 2σ (shadow regions with lighter colors) uncertainties are also overplotted.We choose the flatline pure cloudy model as the baseline for model comparison and utilize the Bayes factor D log10(E)(Kass &Raftery 1995)andn–σ values (Benneke &Seager 2013) to evaluate the goodness of fit for the model,where D log10(E)=log10(Emodels) -log10(Eflatmodel)is the logarithmic ratio of Bayesian evidence between models with trace gas molecules and the flat-line model.The Bayesian evidence refers to the fully marginalized likelihood(Marshall et al.2006;Trotta 2007;Nelson et al.2020),and the Bayes factor can be interpreted against empirical scales (Kass &Raftery 1995).According to Table 2 of Benneke &Seager (2013),a Bayes factor value greater than 2.5 means a moderate detection,and a factor value greater than 5.0 indicates a strong detection.Similarly,ann–σ value between 2.1σ and 2.7σ indicates a weak detection,ann–σ value greater than 2.7σ means a moderate detection and ann–σ value greater than 3.6σ signifies a strong detection(Benneke&Seager 2013).The statistical results and model parameters,including D log10(E),n–σ value,planet radius,equilibrium temperature,cloud top pressure,mean molecular weight and scale heights,are expressed in Tables 2 and 3.
From the statistical values listed in Table 2,we can reject the clear primary model for both planets.For the other four models,they all show similar Bayesian evidence values and we cannot be sure which one of them represents the true nature of these two planets.Therefore,both L 98–59 c and L 98–59 d could lack an atmosphere,or the atmosphere could be a thin secondary atmosphere with high molecular weight,or a primary atmosphere with a high photochemical haze layer.
All the model posterior distributions are shown in the Appendix (Figures A1–A10).We generally can find an anticorrelation in the planet radius-equilibrium temperature panel and a positive correlation in the planet radius-cloud top pressure panel in the corner plots.Next we will present all the retrieval results for these five atmospheric models.
Clear Primary—The posterior distributions of clear primary atmosphere model parameters for L 98–59 c and L 98–59 d are presented in Figures A1 and A2 respectively.From Table 2,the statistical significance of the clear primary atmosphere models is 2.96σ and 2.81σ lower than the flat-line models for L 98–59 c and L 98–59 d respectively.Therefore,we can reject the clear primary atmosphere models for both planets.

Figure 4.The spectral light curve fits for the transmission spectra of L 98–59 c.For clarity,we applied an artificial offset in the y-axis.Left panel: the de-trended spectral light curves with the best fit model plotted using dotted lines.Right panels:The residuals from the ftiting with mean values for the chi-squared(),standard deviation with respect to the photon noise () and AC.

Figure 5.Same as Figure 4,but for L 98–59 d.
Cloudy Secondary—From the logarithmic Bayesian evidence(log10(E))of the atmospheric retrieval results in Table 2,we can see that the cloudy secondary atmosphere model is the most favored model for both L 98–59 c and L 98–59 d.This best-fitted model is also displayed in Figure 6,and the posterior distributions of the planet radius,equilibrium temperature,molecular VMRs,cloud top pressure and mean molecular weight are shown in Figures A7 and A8.
Pure Cloudy—The flat-line pure cloudy model is used as the baseline for model comparison.We present the posterior distributions in Figures A9 and A10.A flat exoplanet transmission spectrum can generally be attributed to two different causes: a high-altitude aerosol layer blocking absorption or a high mean molecular weight atmosphere with small scale height.Our statistical results indicate it is also a model that can reasonably explain our current observed transmission spectral data.

Figure 6.Different atmospheric retrieval models for L 98–59 c and L 98–59 d.
3.2.Stellar Contamination
For an M-type star,the stellar activity can cause spectral contamination (Huerta et al.2008;Ma &Ge 2012).Its impact on the transmission spectra of exoplanets needs to be investigated(Rackham et al.2018).Here we study the potential contamination caused by stellar activity on the transmission spectra of L 98–59 c and L 98–59 d.L 98–59 is likely to be a quiet M-dwarf with weak extreme ultraviolet (XUV) activity(Pidhorodetska et al.2021),since there are no stellar activity features seen from the TESS data (Kostov et al.2019).We adopt the stellar contamination models from Rackham et al.(2018),which include four cases: giant spots,solar-like spots,giant spots with faculae and solar-like spots with faculae.The angular radii are defined asRgiant=7° andRsolar=2°.We estimate the contamination factor,which is the effect of stellar activity on the planetary transmission spectrum,utilizing Equation (3) from Rackham et al.(2018).The spots and faculae covering fractions of M3 type stars are used in the equation.The stellar fluxes of the photosphere,spots and faculae are calculated using the theoretical BT-Settle models with temperatures of 3200,2800 and 3300 K,respectively.The surface gravity of L 98–59 is set tolog(g)=5.0and the stellar metallicity to [Fe/H]=−0.5.
By multiplying the contamination factor with a flat-line transit depth model,we derive the contamination spectra of L 98–59 c and L 98–59 d and present them in Figure 7.The lines with different colors in the figure represent different stellar contamination models.Solid lines correspond to the transit light source effect for the maximum spot or faculae filling factor,and dashed lines signify mean filling factor.We compare the stellar contamination models with the observed transmission spectra to check which model can match the observed spectra.We calculate the χ2and reduced-χ2for different model comparisons in Table 4,which show the stellar models of solar-like spots with maximum filling factor deviate most from the observed data.

Figure 7.The stellar contamination models for L 98–59 c and L 98–59 d.
To study the impact of stellar contamination on atmospheric retrieval results,we decide to subtract the potential contamination of stellar activity from the planetary transmission spectra and make additional atmospheric retrievals using the resultant spectra assuming different atmospheric models: cloudy primary,cloudy secondary,clear primary,clear secondary and flat-line model.We present the retrieval results in Table 5.We can see that for all the models (except for solar-like spots with maximum filling factor),the statistical results are similar to those before the stellar contamination removal.The clear primary atmosphere model can be excluded with a ∼3σ significance,which still suggests these two planets may have no atmosphere,or have a thin secondary generation atmosphere,or a primary hydrogen dominated atmosphere with an opaque cloud layer.
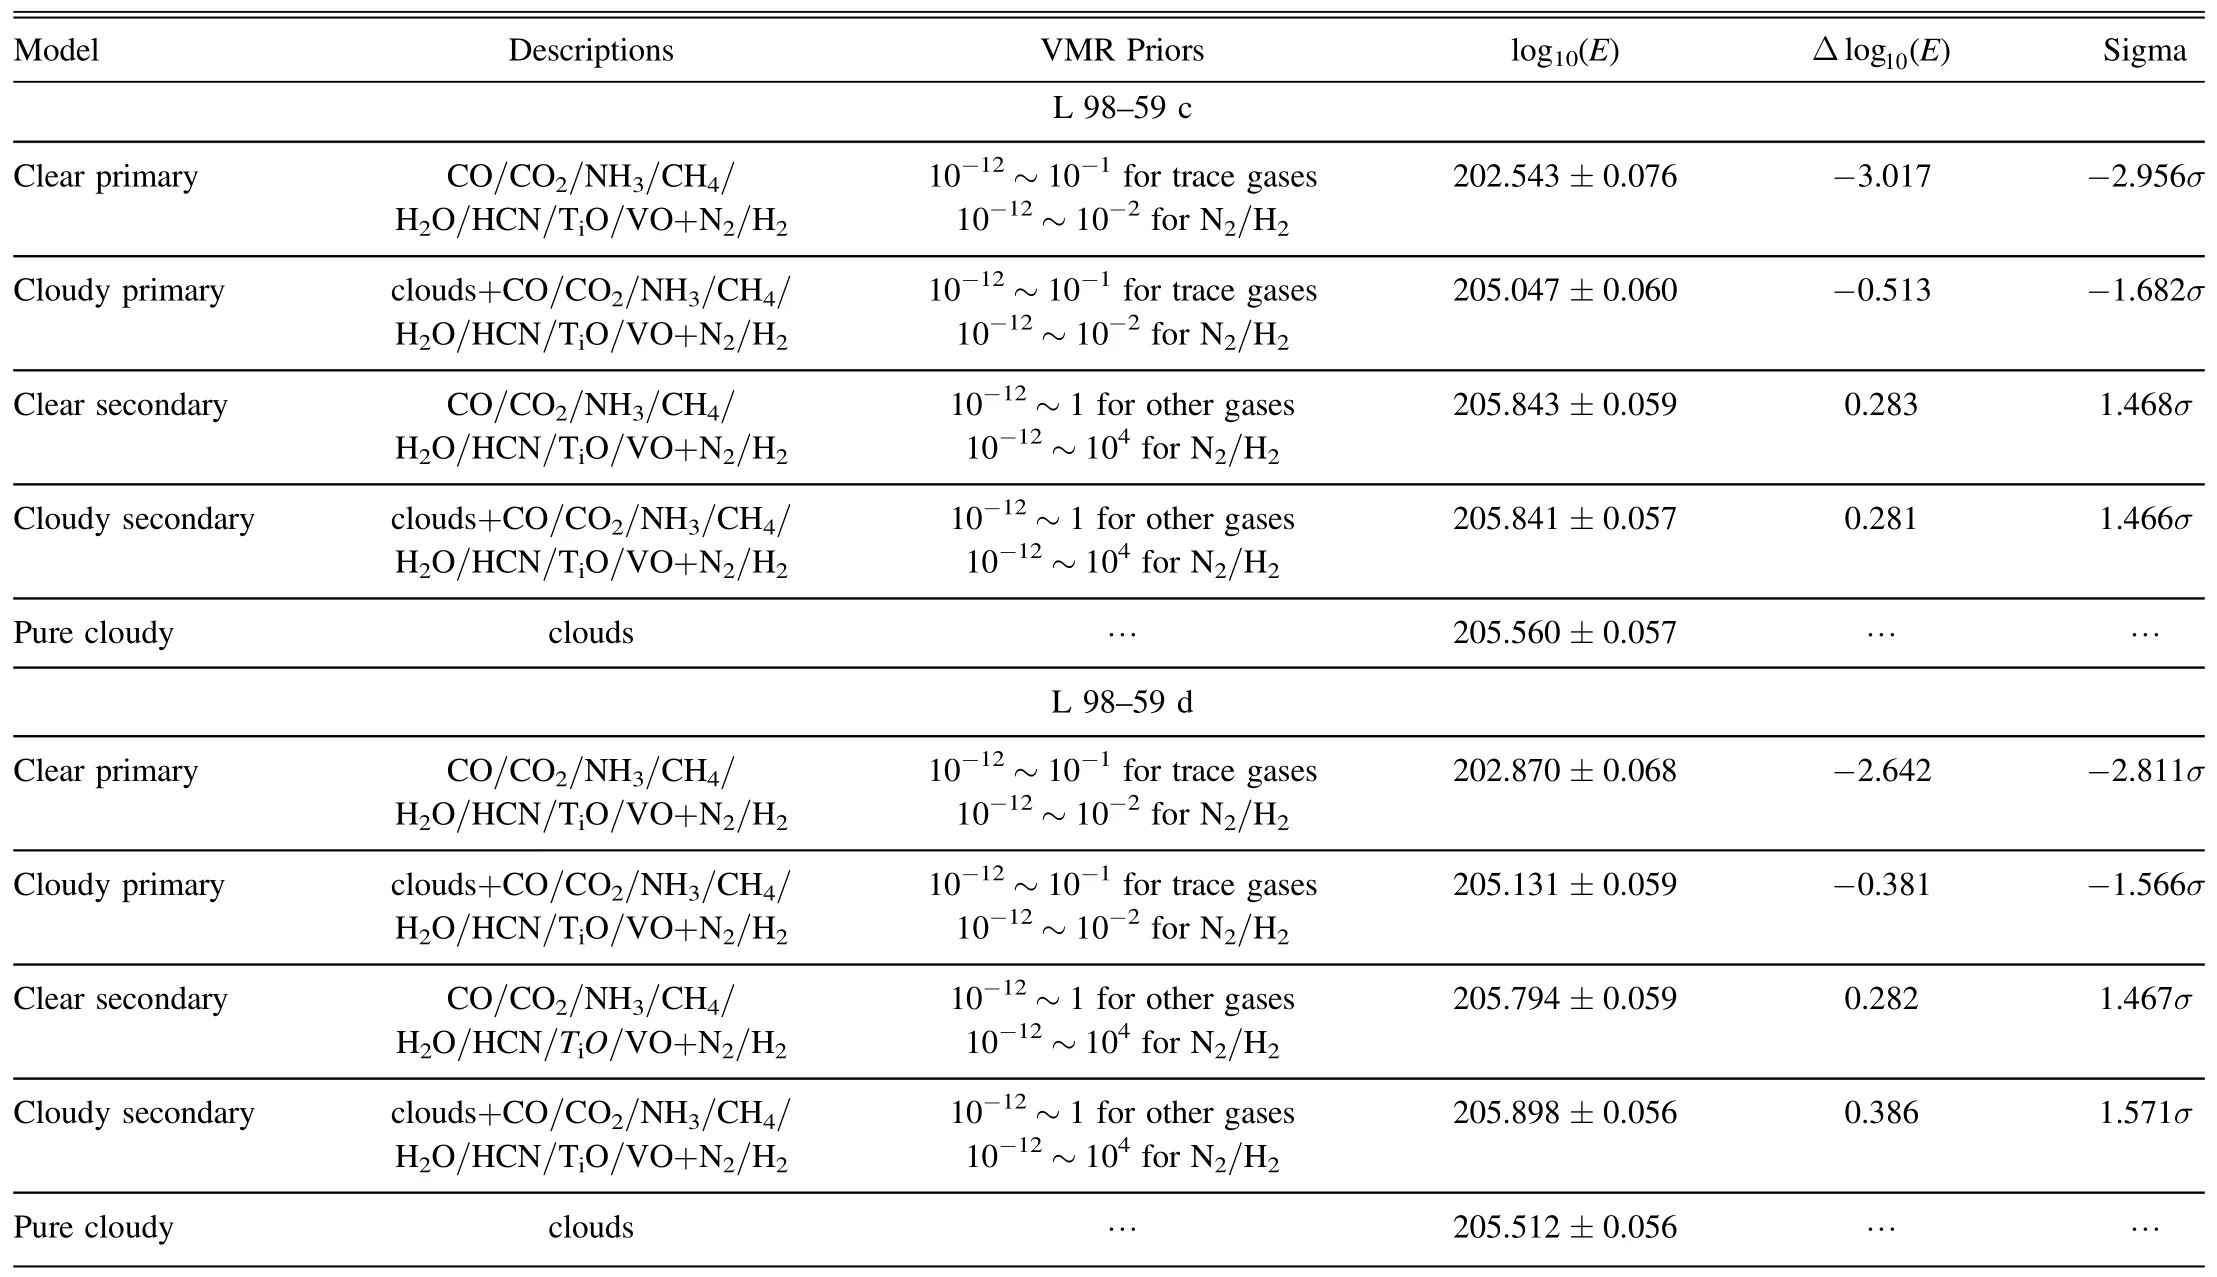
Table 2 Statistical Values of Different Models: Bayesian Evidences and Sigma

Table 3 The Retrieval Parameters of Different Models for L 98–59 c and L 98–59 d

Table 4 The χ2 and Reduced-χ2 for Different Stellar Contamination Models

Table 5 The Retrieval Results in the Case of Different Stellar Contamination Models
3.3.Future Missions
In this work,each planet has only been observed at one transiting window.Thus more observations from HST/WFC3 G141 can provide more reliable and precise spectral results.In addition,observations from JWST would also be very powerful in the study of the planetary atmosphere models(Constantinou&Madhusudhan 2022;Damiano et al.2022;Hinkley et al.2022;Whittaker et al.2022).JWST can provide unprecedented observations of exoplanet atmospheres due to its unmatched infrared sensitivity,higher spectral resolution and widerwavelength coverage,which will enable detection of more subtle molecular absorption features in the atmosphere.
JWST will observe planets c and d in Cycle 1.Here we generate the theoretical transmission spectra of L 98–59 c and L 98–59 d from one single transit using the NIRISS GR700XD spectrograph on JWST,assuming a cloudy secondary atmospheric model for both planets.The simulated spectra are depicted in Figure 8.We can clearly see that there are no strong molecular absorption features in the wavelength range of JWST/NIRISS,which agree with a flat-line spectral model.By comparing the future observations from JWST with these simulated spectra,we will be able to put more constraints on the planetary atmospheric models.Thus,we strongly recommend JWST to cover these small rocky planets in its observation plan.

Figure 8.Theoretical spectral model of L 98–59 c (left panel) and L 98–59 d (right panel) in the wavelength range of JWST/NIRISS GR700XD,together with the predicted noise in one single transit visit run.
4.Conclusions
Characterizing the atmospheric properties of terrestrial planets is a very important topic in exoplanet study nowadays.In this paper,we present the near-infrared transmission spectra obtained with the HST/WFC3 G141 grism for the terrestrial planets L 98–59 c (1.4R⊕) and L 98–59 d (1.5R⊕),which are the two outer planets in the multi-planet system L 98–59.We also study the possible impacts of contamination from stellar activity.We find similar atmospheric retrieval results for both planets.We can reject the model of a clear primordial atmosphere dominated by hydrogen with about 3σ confidencefor both planets.From the similar Bayesian evidences obtained when fitting the other four atmospheric models,we conclude that these two planets may either have no atmosphere,or have a secondary generation thin atmosphere with a high molecular weight,or have a primary atmosphere with a thick opaque cloud layer.Future measurements from JWST can be used to put more constraints on their atmospheric properties,and demonstrate which scenario is more appropriate.
Knowing the diversity of planetary processes is important for understanding our planet Earth.Thus Pidhorodetska et al.(2021) advocate that this transiting multi-planet system is an excellent target for comparative planetary study.By investigating the transmission spectra of three transiting planets which are formed in the same protoplanetary disk and are orbiting the same star,the system-wide trends in the atmospheric composition and volatile retention can be revealed (Damiano et al.2022).Pidhorodetska et al.(2021)evaluated the detectability of certain spectral features from the three transiting terrestrial planets using simulated transmission spectral observations from HST and JWST.Based on the empirically determined cosmic shoreline,the relative size and insolation flux of planet L 98–59 b places it within the regime of significant atmospheric loss(Zahnle &Catling 2017;Pidhorodetska et al.2021).Thus L 98–59 b is likely to have lost its primary atmosphere caused by efficient hydrodynamic escape (Demangeon et al.2021).Theoretical calculations suggest that the retention of a pure-H2O atmosphere is also difficult because of a high escape efficiency(Johnstone 2020).All these scenarios agree well with the HST observations(Damiano et al.2022;Zhou et al.2022).L 98–59 c and d are also near the cosmic shoreline,and have likely experienced a runaway greenhouse phase (Demangeon et al.2021;Pidhorodetska et al.2021).Their higher masses may have inhibited mass loss,leaving them likely with a Venus-like atmosphere dominated by CO2.However,unlike JWST (Ahrer et al.2022;The JWST Transiting Exoplanet Community Early Release Science Team et al.2022),HST does not have the power to detect CO2,which has a strong opacity near 4.3 μm.Our analysis of the HST data in this paper has ruled out the possibility of a hydrogen dominated clear atmosphere for both planets c and d.A secondary atmosphere from volcanic outgassing or volatile retention such as CO2cannot be completely ruled out (Kite et al.2020;Swain et al.2021;Damiano et al.2022),which is consistent with this postrunaway greenhouse scenario.Future confirmation of volatile absorption features,such as CO2,in these planets can help to understand the planet-mass-dependent atmospheric retention of terrestrial planets(Demangeon et al.2021;Pidhorodetska et al.2021;Damiano et al.2022).
Acknowledgments
We thank our anonymous referee for prompt and insightful comments that led to significant improvement of the manuscript.We thank Professor Giovana Tinetti,whose visit triggered this study.We thank Angelos Tsiaras,Ingo Waldmann and Ahmed Al-Refaie for their instructions on how to use Iraclis and TauREx.We acknowledge the financial support from the National Key R&D Program of China(2020YFC2201400),National Natural Science Foundation of China (NSFC,Grant Nos.12073092,12103097,and 12103098),the science research grants from the China Manned Space Project (No.CMS-CSST-2021-B09,B12),Guangzhou Basic and Applied Basic Research Program (202102080371),the Strategic Priority Program on Space Science,the Chinese Academy of Sciences (Grant No.XDA15020601),China Postdoctoral Science Foundation (No.2020M672936),the Fundamental Research Funds for the Central Universities,Sun Yat-sen University,Hainan Provincial Natural Science Foundation of China under Grant No.122RC546 and the National Natural Science Foundation of China under grant Nos.12063001
This work is based on observations with the NASA/ESA Hubble Space Telescope,obtained at the Space Telescope Science Institute(STScI)operated by AURA,Inc.The publicly available HST observations presented here were taken as part of proposal 15856,led by Thomas Barclay.These were obtained from the Hubble Archive,which is part of the Mikulski Archive for Space Telescopes.
Appendix Additional Figures
The posterior distributions of all of the models are shown in the Appendix (Figures A1–A10).

Figure A1.The atmospheric retrieval posterior distributions of the clear primary atmosphere model for L 98–59 c.

Figure A2.The atmospheric retrieval posterior distributions of the clear primary atmosphere model for L 98–59 d.

Figure A3.The atmospheric retrieval posterior distributions of the cloudy primary atmosphere model for L 98–59 c.

Figure A4.The atmospheric retrieval posterior distributions of the cloudy primary atmosphere model for L 98–59 d.

Figure A5.The atmospheric retrieval posterior distributions of the clear secondary atmosphere model for L 98–59 c.
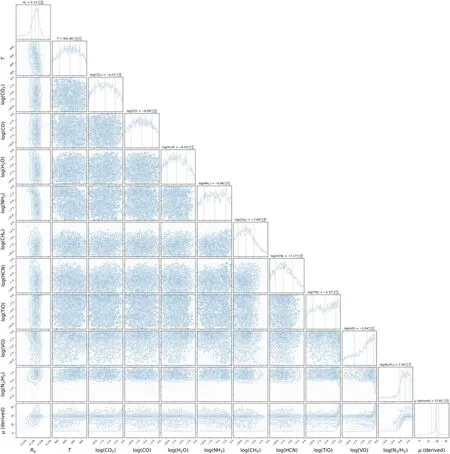
Figure A6.The atmospheric retrieval posterior distributions of the clear secondary atmosphere model for L 98–59 d.

Figure A7.The atmospheric retrieval posterior distributions of the best fit cloudy secondary atmosphere model for L 98–59 c.

Figure A8.The atmospheric retrieval posterior distributions of the best fit cloudy secondary atmosphere model for L 98–59 d.

Figure A9.The atmospheric retrieval posterior distributions of the pure cloudy atmosphere model for L 98–59 c.

Figure A10.The atmospheric retrieval posterior distributions of the pure cloudy atmosphere model for L 98–59 d.
ORCID iDs
 Research in Astronomy and Astrophysics2023年2期
- Research in Astronomy and Astrophysics的其它文章
- Application of a Magnetic-field-induced Transition in Fe X to Solar and Stellar Coronal Magnetic Field Measurements
- Simulation-driven Wind Load Analysis and Prediction for Large Steerable Radio Telescopes
- Gravitational Wave Radiation from Newborn Accreting Magnetars
- Power-law Distribution and Scale-invariant Structure from the First CHIME/FRB Fast Radio Burst Catalog
- Solar Active Region Magnetogram Generation by Attention Generative Adversarial Networks
- Construction and Validation of a Geometry-based Mathematical Model for the Hard X-Ray Imager