
Correction of the Temperature Effect of Muon Counts Observed at the Guangzhou Station
2023-03-25 07:36:24CaoLongXuYangWangGangQinandPingBingZuo
Cao-Long Xu ,Yang Wang ,Gang Qin ,and Ping-Bing Zuo
1 School of Science,Harbin Institute of Technology,Shenzhen,Shenzhen 518055,China;ywangsz@hit.edu.cn,qingang@hit.edu.cn
2 Laboratory for Space Weather Storms,Institute of Space Science and Applied Technology,Harbin Institute of Technology,Shenzhen,Shenzhen 518055,China
Abstract Muons are the main component of secondary cosmic rays,and the variation in muon intensity indicates the variation in primary cosmic ray intensity.However,before using muons to study the variation in the intensity of cosmic rays,it is necessary to eliminate the atmospheric effects,such as pressure and temperature effects.In this work,the temperature effect of the muons is corrected in terms of empirical method by using ground temperature.The temperature correction is applied to the muon data observed at the Guangzhou station during the period 2010–2021 after a barometric correction.It is found that the effect of seasonal variations in temperature on muon counts is greatly eliminated in the corrected data.Furthermore,the muon data are well correlated with the neutron data in comparison,which verifies the reliability of the corrected muon data.Our results show that the correction of muon data by using ground temperature is an effective method.
Key words: atmospheric effects–Sun: activity–(ISM:) cosmic rays
1.Introduction
Primary cosmic rays are energetic charged particles from the galaxy.They are stable particles that are accelerated to enormous energies by sources in our universe.On their way to the Earth,primary cosmic rays are strongly modulated by the solar wind and the heliospheric magnetic field.The intensity of cosmic rays reflects the level of solar activity.Primary cosmic rays enter the atmosphere of the Earth and interact inelastically with the nuclei of the atmosphere,producing many secondary hadrons.Furthermore,the energetic hadron interacts with the nucleus of the atmosphere,and the process is the hadron cascade.In the process,the secondary particles produced are mainly nucleons and mesons.The main meson components are π mesons and κ mesons,which can interact again or decay into muons.All these secondary particles are called secondary cosmic rays.
Secondary cosmic rays propagate through the Earth’s atmosphere,preserving information about the variability of primary cosmic rays.However,muon counts can be affected by meteorological effects,in particular,variations in atmospheric pressure and temperature can seriously affect the muon counts.The meteorological effects depend on the latitude,longitude and altitude,at which the observation site is located,as well as on the shielding effects around the detector.Removing the effects of atmospheric pressure and temperature will significantly improve the sensitivity of the muon counts to the intensity of cosmic rays,allowing to better monitor the primary cosmic rays.
Over the years,several theoretical models of meteorological effects have been proposed.Based on these models,temperature corrections can be made.The most common of these temperature correction methods are: the integral method(Duperier 1949;Dorman 1954;Maeda &Wada 1954;Sagisaka 1986;de Mendonca et al.2013,2016;Savić et al.2021) and the empirical method (Blackett 1938;Trefall 1957;Wada 1961;Dorman 2004;de Mendonca et al.2013,2016).Each method has its own advantages and disadvantages.The advantage of the integral method is that it is more theoretically complete;the disadvantage is that the correction requires a vertical profile of the temperature of the atmosphere,which is not easily available.The advantage of the empirical method is that the temperature data required for calibration is readily available,while its disadvantage is that only the effect of temperature variations at a certain altitude is considered.Secondary cosmic rays have multiple components.Besides muon counts,neutron counts can also indicate cosmic ray intensity,and there is no significant temperature effect in neutron counts.Therefore,we can check the result of the temperature effect correction by comparing muon counts with neutron counts.
In the work of de Mendonca et al.(2013),secondary cosmic ray data were used from a detector in San Juan,Argentina(31.5°S,68.5°W,2550 m over sea level) with a geomagnetic cut-off rigidity of 9.8 GV,while the data used in this work are detected from Guangzhou (23.6°N,113.2°E,20 m over sea level) with a geomagnetic cut-off rigidity of 16.0 GV.de Mendonca et al.(2013) has shown that the temperature effect can be well corrected using ground temperature.Since the temperature effect of the muon detector varies with the location,the possibility of using the ground temperature for temperature correction of the observed muons at the Guangzhou station is an issue that needs to be investigated.In this work,we investigate whether the muon data from the Guangzhou station can be corrected using ground temperature.We use the neutron data to compare the temperature corrected muon data.Comparison between the neutron data and the temperature corrected muon data is used to check the reliability of the temperature correction method.In Section 2,we discuss the correction method for the pressure effect.In Section 3,we discuss the correction method for the temperature effect.In Section 4,we show the results of the muon correction using the ground temperature.Finally,Section 5 summarizes the results of the study.
2.Pressure Effect
Three kinds of different effects are actually included in the pressure effect: absorption effect,decay effect and generation effect.Using ground-based detectors to observe the muon,the atmospheric absorption effect on the muon dominates during the increase of atmospheric pressure,so there is a negative correlation between the air pressure and the muon count.For barometric pressure correction,one of the common approaches is to assume that the relationship between atmospheric pressure and muon count is (Tang et al.2004)
HerePis atmospheric pressure (mb),P0is the reference atmospheric pressure(mb),Nobsis the number of muons before correction,β is the coefficient of barometric correction,andNcorr_Pis the number of muons after barometric correction.Barometric corrections have been completed in the muon data provided by Chinese Space Science Data Center.For the muon station at Guangzhou,P0is taken as 1000 mb and β is taken as−0.12% (mb)−1.
3.Temperature Effect
After the pressure correction,the temperature effect still remains in the muon counts.The temperature effect depends not only on the decay process of muons,but also on the production and decay processes of π mesons in the atmosphere.Depending on the generation mechanism,temperature effects can be divided into negative and positive effects (Dorman 1954).As the atmospheric molecules heat and expand,more muons decay due to the increase of muon propagation paths,resulting in a decrease in muon intensity on the ground,which leads to the negative effect.At the same time,more π mesons are generated,leading to resulting in an increase in the number of muons produced by π meson decay,which leads to the positive effect.Observations of muons using ground-based detectors are dominated by negative temperature effects.Therefore,during the heating and expansion of the atmosphere from winter to summer,the muon counts generally show a minimum in summer and a maximum in winter.
Since the intensity of the muons is related to the temperature along the entire vertical path throughout the atmosphere,the temperature effect can be given by the following relation:
Here,(ΔN/N)Tis the normalized deviation of the muon intensity associated with the temperature effect,xis the atmospheric pressure,α(x)is the temperature coefficient at that atmospheric pressure,and ΔT(x)is the temperature deviation at that atmospheric pressure.This method is called the integral method.The integral method considers the temperature along the entire vertical atmospheric path.Theoretically,the integral method can describe the effect of temperature variations on the intensity of cosmic rays.However,there are limitations of the integration method in the practical application.First,temperature data at all altitudes are needed,which are difficult to obtain.Second,the equation assumes that each layer of the atmosphere responds to temperature changes independently of the other atmospheric layers.Third,the temperature coefficient α is essentially due to a variety of physical processes,so only approximate values can be given from theory.
There is another way to describe the temperature effects,called the empirical method.The method considers only the effect of the ground temperature and the temperature of the generating layer (which is defined as the height of maximum secondary particle production) on muon intensity
Here,ΔT(hG) is the deviation of the ground temperature,and ΔT(hM) is the deviation of the temperature at the generating layer.Comparing the muon data corrected for pressure and temperature effects with the neutron data,it is found that the temperature effect can be well removed by considering only the ground temperature deviation.In other words,the muon data can be corrected for temperature effect using the following equation
In de Mendonca et al.(2013),the temperature effect was corrected by using Equations (2),(3)and (4)respectively,and the results of the three methods were compared.They found that all three methods work well,and integrating method(2)is slightly better than the other two methods.They also found that in Equation (3),the first term on the right-hand side of the equation plays a major role,while the second term has no significant effect.In other words,variations in muon counts correlate well with variations in ground temperature,while there is little or no correlation with variations in temperature of the maximum generation layer.Therefore,based on the results,both Equations (3) and (4)indicate that variations in muon counts correlate well with variations in ground temperature.
The muon data with barometric corrections are provided by Chinese Space Science Data Center.The resolution of data is 5 minutes.If the data were corrected using the integral method,the temperature distribution from the ground level to the top of the atmosphere should be needed,but the temperature data is not currently available from observations.According to numerical simulations,the Global Forecasting System (GFS)numerical model provided by the National Centers for Environmental Prediction (NCEP) can give temperature data at different altitudes (http://www.nco.ncep.noaa.gov/pmb/products/gfs/).However,the time resolution of the data available on the website is only 6 hr,which is fully insufficient for the actual calculations required in this work.On the other hand,the data provided by the numerical models are not as reliable as the observational data.Therefore,we do not intend to use the integral method for temperature correction.
In fact,the meteorological effects of the muons are caused by microscopic processes of particle interactions.Existing correction methods only consider macroscopic physical quantities,such as pressure and temperature,and separate the correction for the two quantities.Therefore,it is impossible to accurately calculate the effect of meteorological changes on muon counts over the entire propagation path.In practice,none of the three methods mentioned above is perfect and each has its own advantages and disadvantages.Theoretically,method (4) is less theoretically complete than method (2),but the ground temperatures required for method (4) can be measured accurately,whereas the distribution of temperature at different altitudes required for method (2) cannot be obtained accurately.In the study,the method (4),which is the correction method using the ground temperature,is used for temperature effect correction in practice.
4.Temperature Correction of Muons Observed at the Guangzhou Station
The large scintillation telescope at the Guangzhou station has been in operation since 1989.Scintillation telescopes are excellent ground-based instruments for observing cosmic rays with high precision,long duration,and excellent stability.The local vertical geomagnetic cut-off rigidity at the Guangzhou station is approximately 16.0 GV.The scintillation telescope consists of 24 independent detector units.The telescope converts the signal from the 24 individual units into a voltage signal,then converts the voltage signal into a count every five minutes.The telescope has two layers and can detect the muons in five directions:east,south,west,north and vertical.The data are provided by Chinese Space Science Data Center,National Earth System Science Data Sharing Infrastructure,National Science and Technology Infrastructure of China (http://spacescience.geodata.cn).The data provided by Chinese Space Science Data Center have already been corrected for barometric pressure effect but not yet for the temperature effect.The time intervals of muon data are 5 minutes,while the time intervals of the temperature data are half an hour,so we performed cubic spline interpolation of all the temperature data for calculation.
The variation in muon counts is related to both Earth’s atmospheric conditions and solar activities.In order to accurately obtain the effect of atmospheric temperature on muon counts,the effect of solar activity needs to be minimized.Solar Cycle 24 is an extremely weak cycle,and the year 2020 is the lowest duration of solar activity in the cycle.The year 2020 can be used as a base period,and muon data for all other years can be corrected with the correction parameters obtained in 2020.Using Equation (4),
we fit the muon counts and the temperature data to obtain the temperature coefficientKG.Here,Ncorr_Pis muon counts with pressure corrections,and〈Ncorr_P〉is the yearly average of muon counts.The coefficientKGcan be used for temperature correction of muon counts in any year.We set
Here,Tis temperature and〈T〉 are the yearly average of temperature.In fact,the muon counts are particularly large.For example,in the vertical direction,the counts of cosmic ray muons are about 2×10⁵per hr.The data counts provided by Chinese Space Science Data Center are obtained by dividing the true count by a number,32 in the vertical direction and 16 in the other directions.The resulting vertical count is about 520 counts per 5 minutes.A linear fit ofxandyby the least squares method gives the muon temperature correction factorKGand the correlation coeffciient.The unit ofKGis (oC)-1.The unit of muon counts is counts/(5 minutes),and the unit of temperature is Celsius.
Figure 1 shows the time profiles of muon counts in different directions for the year 2020.In order to clearly show the results,we average the counting rate for 24 hr.Each point in the figure is the daily average value of the muon counting rate.As the evolution patterns are similar for the different directions,we only show the results for the vertical and the eastern directions.The geometric factors are different in each direction,so the counts vary considerably in different directions.In the left panels of the figure,the top panel shows the time profile of the daily average temperature,the middle panel shows the time profile of raw vertical muon counts without temperature correction,and the bottom panel shows the time profile of the temperature corrected vertical muon counts.The three panels on the right are the same as the three panels on the left,except for the muon direction.The right panels show the time profiles of muon counts in the eastern direction.

Figure 1.Comparison of temporal changes in muon counts and temperature before and after temperature correction in 2020.The unit of temperature is Celsius and the unit of muon count is counts/(5 minutes).

Figure 2.Figure 2 is the same as Figure 1,except for the different time period.
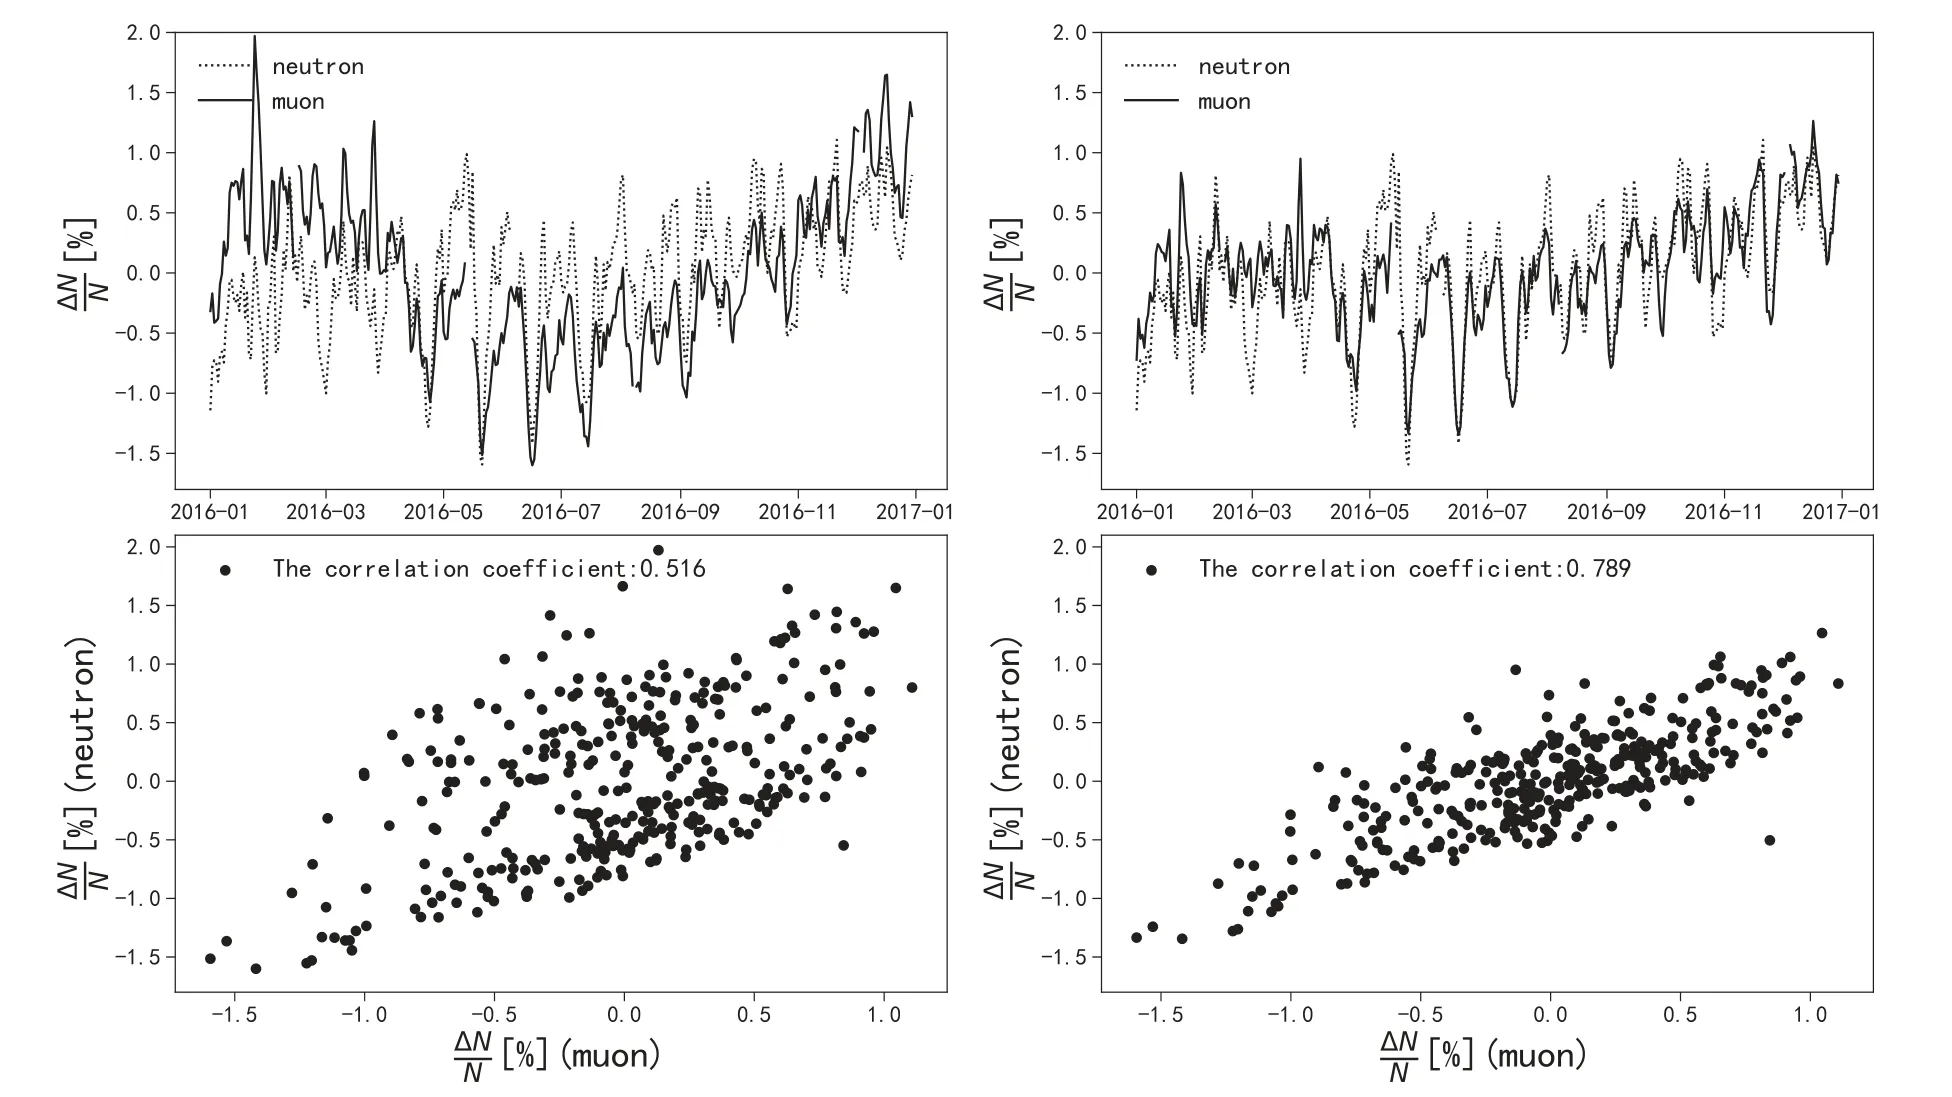
Figure 3.Comparison of the normalized deviation of muon counts and neutron counts before and after temperature correction in 2016.
Comparing the time profiles of temperature with the raw muon data without temperature correction,the inverse correlation of temperature with muon counts is clearly shown.From January–March,the temperature is lower and the muon counts are larger,while from June to August,the temperature is higher and the muon counts are smaller.Comparing the muon data before and after temperature correction,it is obvious that the temperature effect of muon counts is well suppressed.KGcan be obtained for the five directions: vertical,east,west,south and north,which are equal to −0.0602%,−0.0669%,−0.0500%,−0.0676%,and −0.0505% per °C,respectively.After obtaining the coefficients for each direction,the temperature corrected muon counts are obtained as follows:
Figure 2 shows a comparison of the muon counts before and after the temperature correction in 2016,and the format is the same as Figure 1.Comparing the time profiles of temperature with the raw muon data without temperature correction,the inverse correlation of temperature and muon counts is also clearly indicated.The muon counts are larger at lower temperatures,while they are smaller at higher temperatures.Comparing the muon data before and after temperature correction,it is obvious that the temperature effect of muon counts is well suppressed.
To examine the effect of temperature calibration in muon counts,we compare the normalized deviation of neutron and muon counts.In addition to muon detectors,neutron monitors are also widely used to study variations in the intensity of cosmic rays.The PSNM neutron station at Chiang Mai,Thailand (18.9°N and 98.5°E,2560 m) is very similar to the Guangzhou station in terms of latitude,longitude and geomagnetic cut-off rigidity.The meteorological effects in neutron data from the PSNM station (Mangeard et al.2016;Ruffolo et al.2016)have been rigorously corrected,so that the neutron data can be used for comparison to check the accuracy of the muons.
In Figure 3,the top left panel shows a comparison of the time profiles of the normalized deviation of neutron counts and raw vertical muon counts before temperature correction.It can be seen that the overall difference in the normalized deviation of neutron and muon counts is large,approaching 1% in some time periods.The lower left plot shows the correlation coefficient of 0.516 between neutron and muon counts before temperature correction.The two panels on the right show a comparison of the normalized deviation of neutron and vertical muon counts after temperature correction.Comparing the top left and top right panels,it can be seen that after the temperature correction,the normalized deviation of neutron and muon counts tends to be the same,and the difference between them is much smaller.The lower right panel shows the correlation coefficient of 0.789 for the normalized deviation of neutron and muon counts after the temperature correction,which is much higher than the correlation coefficient before the calibration.In 2016,particle counts dropped several times,which is a result of the modulation of cosmic rays by the strong interplanetary magnetic field.For the majority of cases the drops appear in both neutron and muon data.However,we also find that the normalized deviation is not fully consistent in neutron and muon counts.The variation of neutron count is more significant,which may be the result of the altitude difference.The neutron station located in Chiang Mai is at 2560 m above sea level,while the muon station located in Guangzhou is at 20 m above sea level.The difference in altitude of more than 2000 m may make the neutron data more sensitive to the variation of interplanetary magnetic field.

Figure 4.The time profiles of the normalized deviation of muon counts in different directions after temperature correction in 2016.
Between 2016 March and October,there are several periodic decreases in muon counts.It can be seen that although the muon counts show a periodic decrease,the same periodic decrease can be seen in the neutron data.There is no significant temperature effect in the neutron data,so the phenomenon is not due to the temperature effect.The decrease in cosmic rays is related to solar activity and is caused by the influence of the interplanetary magnetic field and the solar wind associated with the corotating Interaction Regions,so the muon count decreases periodically with solar rotation.In Figure 3,we can see that,in years of intense solar activity,the muon data cannot be corrected with the temperature data of that year.For example,in the 2016,the effects of the interplanetary magnetic field and the solar wind are present,resulting in a periodic decrease in muon counts between 2016 March and October.If the 2016 temperature data are used to correct for the effect of temperature in the 2016 muon data,then errors due to solar activity are introduced in the muon data.The year 2020 is the solar minimum in solar cycle 24,and the change in muon counts during this period can reflect the effect of temperature on muon counts.Therefore,using the correction parameters for 2020 to correct the muon data for other years is appropriate.
Figure 4 shows the time profiles of the normalized deviation of muon counts in different directions after correction in 2016.From top to bottom are the results in the vertical,east,west,south and north directions.The figure shows that the normalized deviation of muon counts in different directions is very close.Therefore,as long as the vertical count rate is consistent with the neutron count rate,it can be concluded that the count rates in the other four directions are also consistent with the neutron count rate.The pattern of change in the other years is similar to that of 2016,so we only plot the muon counts for 2016.Figure 5 shows a comparison between the normalized deviation of neutron counts and corrected vertical muon counts over time for different years.The muon data are incomplete for some years in the figure,so for muon counts are not available for some time periods.A comparison of the muon counts with the neutron counts shows that the variation in the two kinds of particle counts remains consistent for most of the time and the values are very close to each other.This result shows proves that the temperature correction is valid,and the muon data can be used to represent the variation in cosmic ray intensity above Guangzhou.

Figure 5.Comparison of the normalized deviation of neutron counts and corrected vertical muon counts over time from 2010 to 2020.
5.Conclusions
In the work,temperature corrections are made to the muon data provided by the Guangzhou station.Using the period of 2020 as the basis,muon temperature correction factors are obtained for five directions: vertical,east,west,south,and north.These coefficients for 2020 are used to apply temperature corrections to the data from other years.Neutron data from the PSNM station are used to compare with temperature corrected muon data,and it is found that the two data sets show a high correlation.The correlation between the normalized deviation of muon and neutron counts is significantly improved by temperature correction.Since neutron counts can indicate the cosmic ray intensity,the good correlation between the temperature corrected muon dataNcorr_PTand neutron data shows thatNcorr_PTcan be used to describe the cosmic ray intensity well.
The meteorological effects of muons are difficult to eliminate completely,because the existing correction methods only consider macroscopic physical quantities,such as pressure and temperature.However,variations in muon data are due to microscopic processes of particle interactions.At the same time,it is not possible to accurately calculate the effects of pressure and temperature on muon counts over the entire propagation path.In this work,the ground temperature is used for the temperature correction,and the method achieves good results.In the future,we will analyze the microscopic processes of muons during propagation,which will help to optimize the method of temperature correction.
Acknowledgments
The authors thank the anonymous referee for valuable comments.We are partly supported by grants NSFC 41774182,NSFC 42074206,and NSFC 41874206.Special thanks to the contributor of the muon data,Yong-hong Cheng,for help with the muon meteorological correction.We acknowledge the use of muon data from the Chinese Meridian Project,and Neutron monitor data from Doi Inthanon provided by courtesy of the Princess Sirindhorn Neutron Monitor Program.
 Research in Astronomy and Astrophysics2023年2期
- Research in Astronomy and Astrophysics的其它文章
- Formation and Destiny of White Dwarf and Be Star Binaries
- Determination of Distance,Extinction,Mass,and Age for Stars in LAMOST DR7
- Fractions of Compact Object Binaries in Star Clusters: Theoretical Predictions
- A Two-limb Explanation for the Optical-to-infrared Transmission Spectrum of the Hot Jupiter HAT-P-32Ab
- The First Photometric and Spectroscopic Study of Contact Binary V2840 Cygni
- Galaxy Interactions in Filaments and Sheets: Effects of the Large-scale Structures Versus the Local Density