
Discussion on “Impact of orientation of blast initiation on ground vibrations” [J Rock Mech Geotech Eng 15 (2022) 255-261]
2023-02-21 09:50:56TadeuszChrzan
Tadeusz Chrzan
Poltegor-Instytut,Open-pit Mining Institute,Wroclaw,Poland
Keywords: Peak particle velocity (PPV)Initiation orientation Wave superimposition Blast initiation
ABSTRACT Recently,Garai et al.(2022) published a paper on the impact of orientation of blast initiation on ground vibrations.However,some of the claims are not supported by the results of the given tests.In Fig.1(see Fig.8 in Garai et al.,2022),there are contours of measured vibration velocities in 4 directions(every 90°)and an incorrect interpretation between them.By placing all measured vibration velocity values (Gerai et al.,2022)at well-defined points on a single figure,it was not possible to precisely determine the type of vibration velocity,such as radial,tangential and vertical vibration velocities,with their different shapes.An incorrect conclusion was also drawn about the direction of the highest vibration velocity.The paper by Garai et al.(2022)measured the vibrational velocity of the medium through which the seismic wave passed,but used the incorrect term shock wave.The shock wave would have destroyed the seismic measuring instruments.A superposition of the vibrational velocity was considered,but not combined with the vibrational frequency of the seismic wave.This paper presents a method for selecting the time delay between successively initiated explosive charges to the measured frequency of the seismic wave,so that the direction of initiation of the explosive charges does not affect the vibration velocity of the ground through which the seismic wave passes.The theoretical and measured shapes and waveforms of radial velocity and tangential velocity in an opencast lignite mine are then presented.Moreover,the conditions for the formation of shock wave,transition wave and seismic waves are presented.
1.Introduction
The Discussion to the study of Garai et al.(2022) includes two aspects:
(i) In Figs.2 and 4,there are no marked places of research results,and
(ii) In Tables 2 and 3,there is no given frequency of seismic wave vibrations for the peak particle velocity (PPV) in radialPPVxand tangentialPPVydirections,and no division of PPV inxandy-direction.
It is reported that the data concerning the above issues are missing in the description of the research (Garai et al.,2022).The placement of vibration velocity measurements from the radial and tangential directions on a single graph is incorrect and therefore led to incorrect conclusions.To analyze the superposition of the seismic wave velocity with the applied time delays,it is necessary to know the vibration frequency of the seismic wave.The vibrational frequency of the seismic wave was not analyzed in the work of Garaiet al.(2022).Unfortunately,no description of the method is shown in Fig.8 in Garaiet al.(2022) for determination of the direction of the highest seismic wave vibration velocity.In addition,there is no mention of relevant literature.
2.Analysis of a contour mapping
Fig.1.Comparison of PPV contours at (a) Giddi-C and (b) Belpahar OCP (see Fig.8 in Garai et al.,2022).
The data recorded at two different mines now plotted against the scaled distance (SD) in contour mapping.Fig.1 (see Fig.8 in Garai et al.,2022) presents the comparison of contour mapping of PPV against its SD plotted for Giddi-C and Belpahar opencast coal mining (OCP).The orientation where the highest PPVs were recorded is shown with a red arrow.The highest PPV line coincides with the initiation orientation,which is also true as per the concept of wave superimposition(Garai et al.,2022).This statement was not confirmed because the measurement data was not measured in the direction marked by the arrow.The direction in which the highestPPVxandPPVywere recorded could be accurately determined if such measurements were taken at a constant distance from the vibration source along the circumference of the circle at,for example,5°intervals.Fig.1 is not reliable because the contour shape of PPV cannot be arbitrarily drawn between 2 measurement points,90°apart without considering the direction of measured vibration velocityVxorVy(see Fig.6a,b,and 7).
Placing the measured points,i.e.radial vibration velocityVx,tangential vibration velocityVy,and vertical vibration velocityVzof different shapes on one figure,resulted in a misinterpretation about the direction of the highest vibration velocity(see Figs.1 and 3).The direction of the blue arrow in Fig.3(see Fig.1 in Garai et al.,2022) coincides with the direction of the red arrow in Fig.1.This direction should be perpendicular to the red line (see Fig.3) that connects charges with the same delay or increasing or decreasing delays.Unfortunately,for the red line in Fig.3,counting from the front of the face,there are consecutive charges with a delay of 153 ms(1 row),161 ms(2 row),186 ms(3 row),and 177 ms(4 row).Charges initiated in this order do not form a vibration front in one direction as presented in Garaiet al.(2022).To prove the assumed thesis that the highest PPV contour line coincides with the initiation orientation,it was necessary to perform measurements of the speed of vibrations in the direction indicated by the arrows and to prove that this is indeed the case.
Fig.2.Types of the waves in a seismic wave,and their oscillations and the directions of the velocity measurements of the vibrating particles (Vx;Vy;Vz) (Moore and Richards,2022).
3.Impact of orientation of blast initiation on ground vibrations
Fig.3.A general blasting patch and its vibration monitoring setup during experimental blasts conducted at opencast mines (see Fig.1 in Garai et al.,2022).
Fig.4.General blast hole sequencing pattern adopted at Giddi-C OCP (see Fig.5 in Garai et al.,2022).
The PPV values were plotted on a contour plot against SD in Garai et al.(2022).The concept of predicting the magnitude peak velocity of vibrations is to use the SD,which is developed by the United States Bureau of Mines(USBM)(Duvall and Fogelson,1962).The SD (Siskind et al.,1980) is a combination of the distance between the vibration source,the measurement point,and the maximum charge on the delay.The SD is defined as follows:

whereDis the absolute distance between the vibration source and the measurement point/station (m),andWis the maximum blasting materials (BM) charge per delay (kg).The radial peak velocity (Vx=PPVx) or tangential peak velocity (Vy=PPVy) of the vibrating particles is determined by
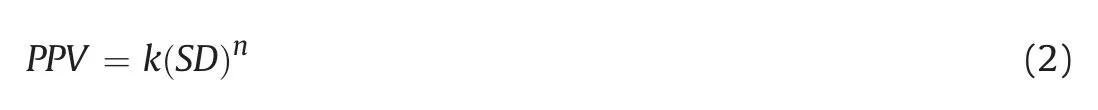
wherekandnare the constants (Siskind et al.,1994;Sayadi et al.,2013;Tripathy et al.,2016),depending on the site and geological conditions,andx-andy-direction measurements (see Fig.2).
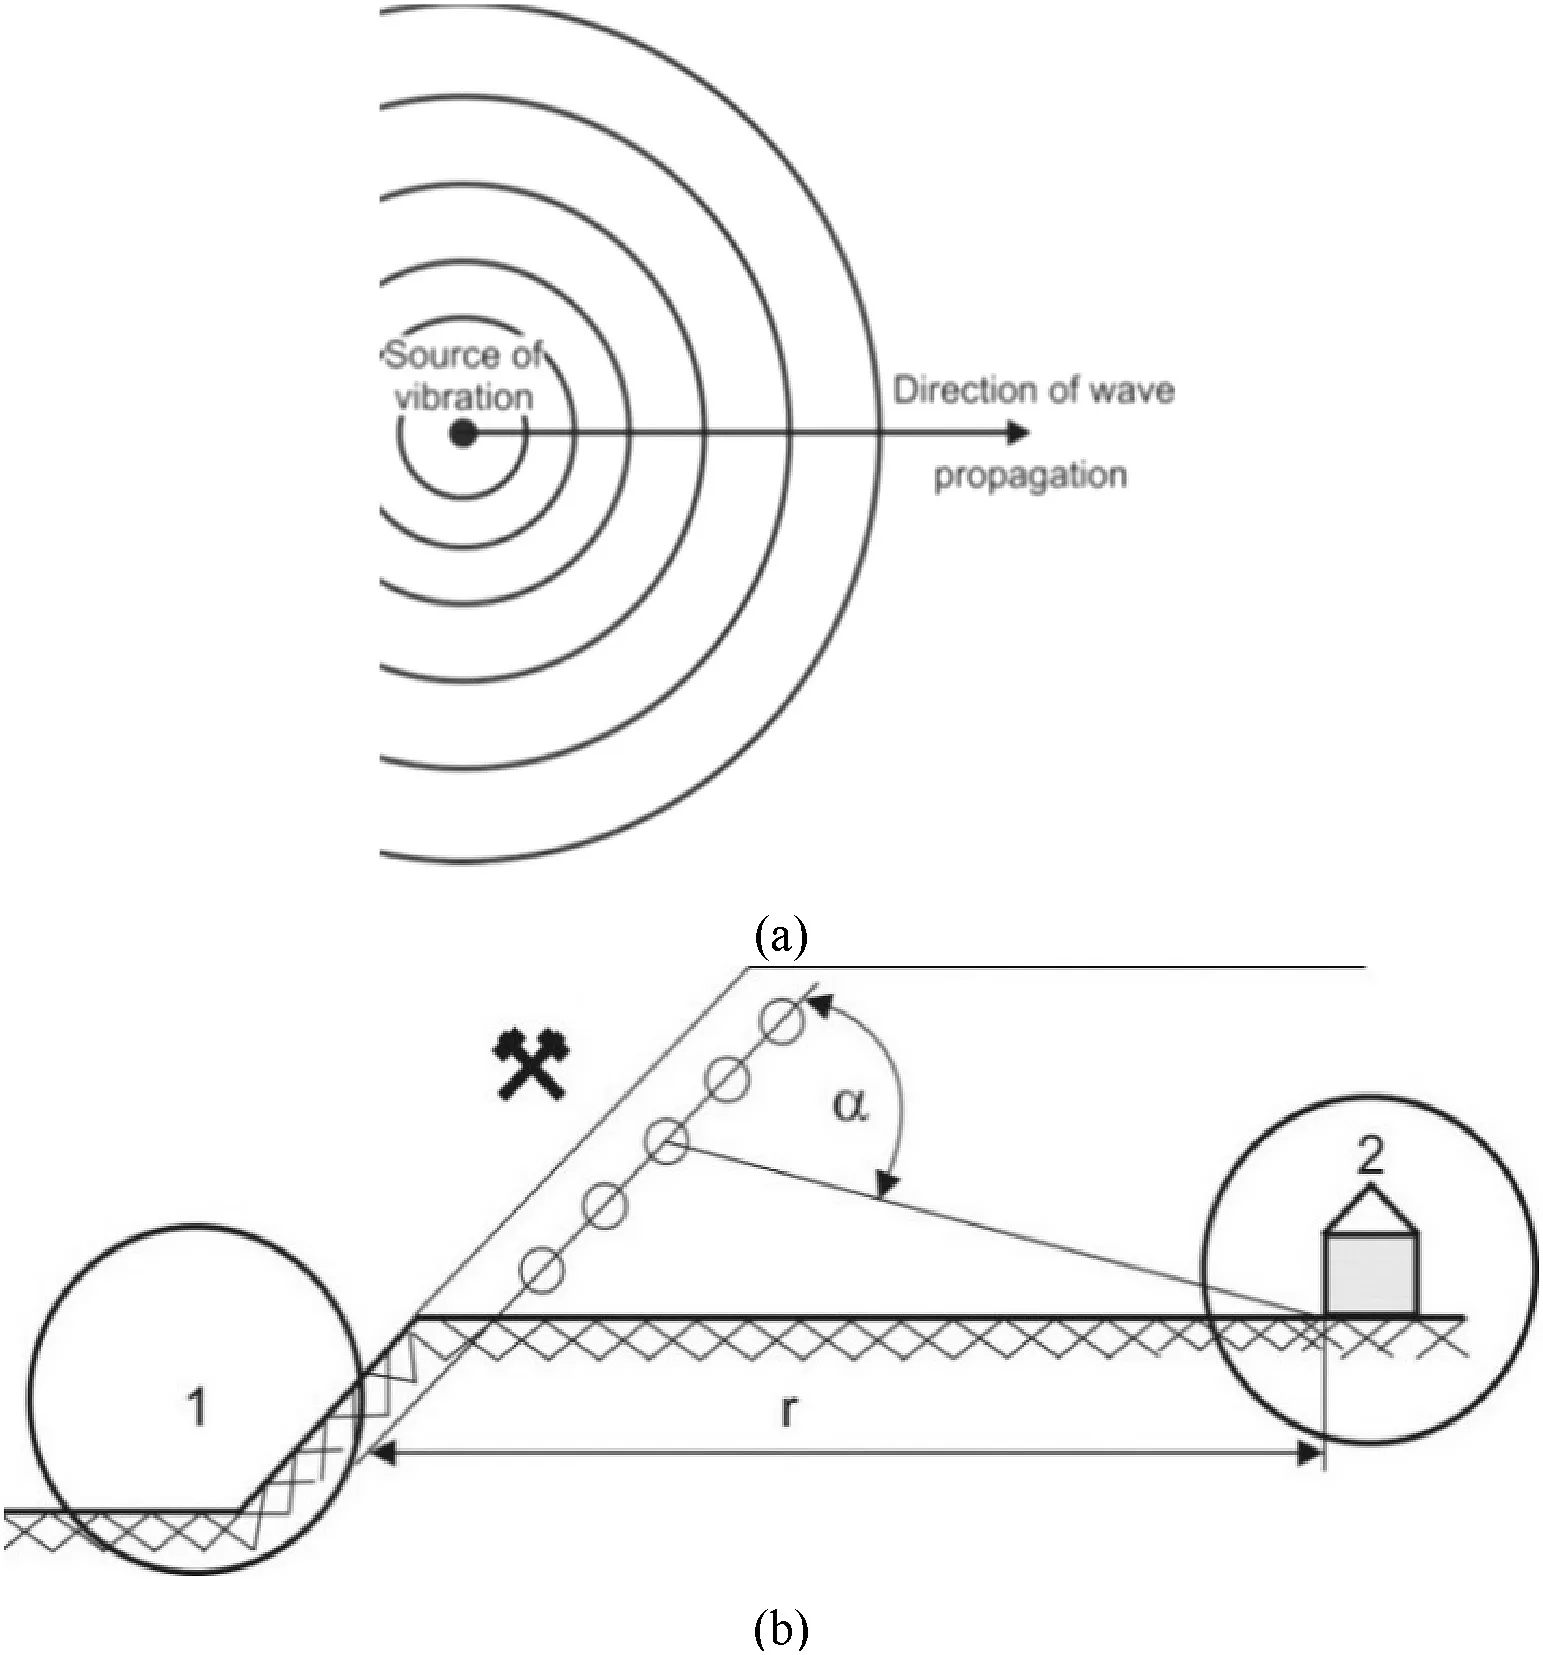
Fig.5.(a)Circular directional distribution of horizontal velocity Vxy of vibrations(own elaboration);and (b) Outline of a place of vibration formation/mine “1”,bench blasting/and the distance “r “between the mine and the building “2”,which is affected by vibrations and the directional angle α (own elaboration).
Inx-direction,the longitudinal wave equals the radial velocity(Vx=PPVx),and iny-direction,transverse wave equals the tangential velocity (Vy=PPVy) (see Fig.2).Thex-direction connects the measuring point with vibration source,andy-direction is perpendicular tox-direction.For circular distribution of vibration velocity,the shape of PPV contour between the left and right measuring points in Fig.3(see Fig.1 in Garai et al.,2022)and Fig.4(see Fig.5 in Garai et al.,2022)is known.If the measurements of the vibration velocityVxwere deposited in one figure,and the measured values of the vibration velocityVywere deposited in another figure,the contour shapes of the vibration velocity similar to Figs.6a,b and 7 could be obtained.Analysis of the sequence of explosive initiation (see Figs.3 and 4) shows that the general direction of explosive initiation is from the right side of the face to the left side of the face.
At the Giddi-C and Belpahar mines surveyed,it was noted that maximum PPV values were recorded behind the blast face,and minimum PPV were in front of the face upstream of the blasts.For the Giddi-C mine,based on Eqs.(1)-(4),it is found that there is an average reduction in PPV of 22.15%in the left orientation(see Fig.1),40.15%in the right,and 64.34%in front of the face compared to the PPV of the behind the face (Garai et al.,2022).
From Eqs.(2) and (3),it is apparent that in the left-hand direction,the vibration velocity is 18% higher than that in the righthand direction.Similarly,Eqs.(5)-(8) were obtained for the Belpahar mine.Eqs.(5)-(8)show that there is an average reduction in PPV of 11.9% in the left orientation (see Fig.4),31.22% in the right orientation and 76.9% in front of the face compared to the PPV of the behind the face at the Belpahar mine(Garai et al.(2022).From Eqs.(6)and(7),in the left direction,the vibration velocity is 19.32%higher than in the right direction.If there is no depleted deposit,gully,or wide layer of heterogeneity between the vibration source and the right seismometer,it can be argued that there is an approximately 20% increase in vibration velocity in the left direction of charge initiation,compared with that in the right direction.If this applies to the unknown frequency not given in Garai et al.(2022) and uses the delay of 17 ms between blast holes,the study of Garai et al.(2022) becomes true.
Compact rocks are generally mined using blasting materials(BM),which causes vibrations in the mining rocks and ground outside the mine area.These vibrations are transmitted by seismic waves propagations in all directions and have negative effects on roads and infrastructures.Basically,the seismic vibrations generated during mining rocks using BM can propagate along a circular path,with equal energy in each direction,just like waves on water from a stone thrown into it,(see Fig.5a) (Nicholls et al.,1971;Siskind et al.,1994;Sayadi et al.,2013;Tripathy et al.,2016;Chrzan,2021,2022).
In Fig.5b,the directional angle of measurement between the line of blast holes and that connects the measurement point/house with central blast hole is marked,and the distance between the vibration source and the object is also given.
4.Theoretical analysis and measurement results
The unit circular distribution of radial component of vibration velocity(Vx)is a function of the directional angle(see Fig.6a),and it follows that the radial component of vibration velocity for the directional angle in the range(0°-90°)has the shape of a semicircle in each quarter of a circle and varied value in directionx-axis.Fora=0°,we haveVx=0;fora=90°,Vx=Vxmax.From Fig.6b,it shows that the tangential component of the vibration velocity(Vy)for the directional angle in the range (0°-90°) has the shape of a semicircle in each quarter of a circle and varied value in directionyaxis.Fora=0°,we haveVy=Vymax,and fora=90°,Vy=0.
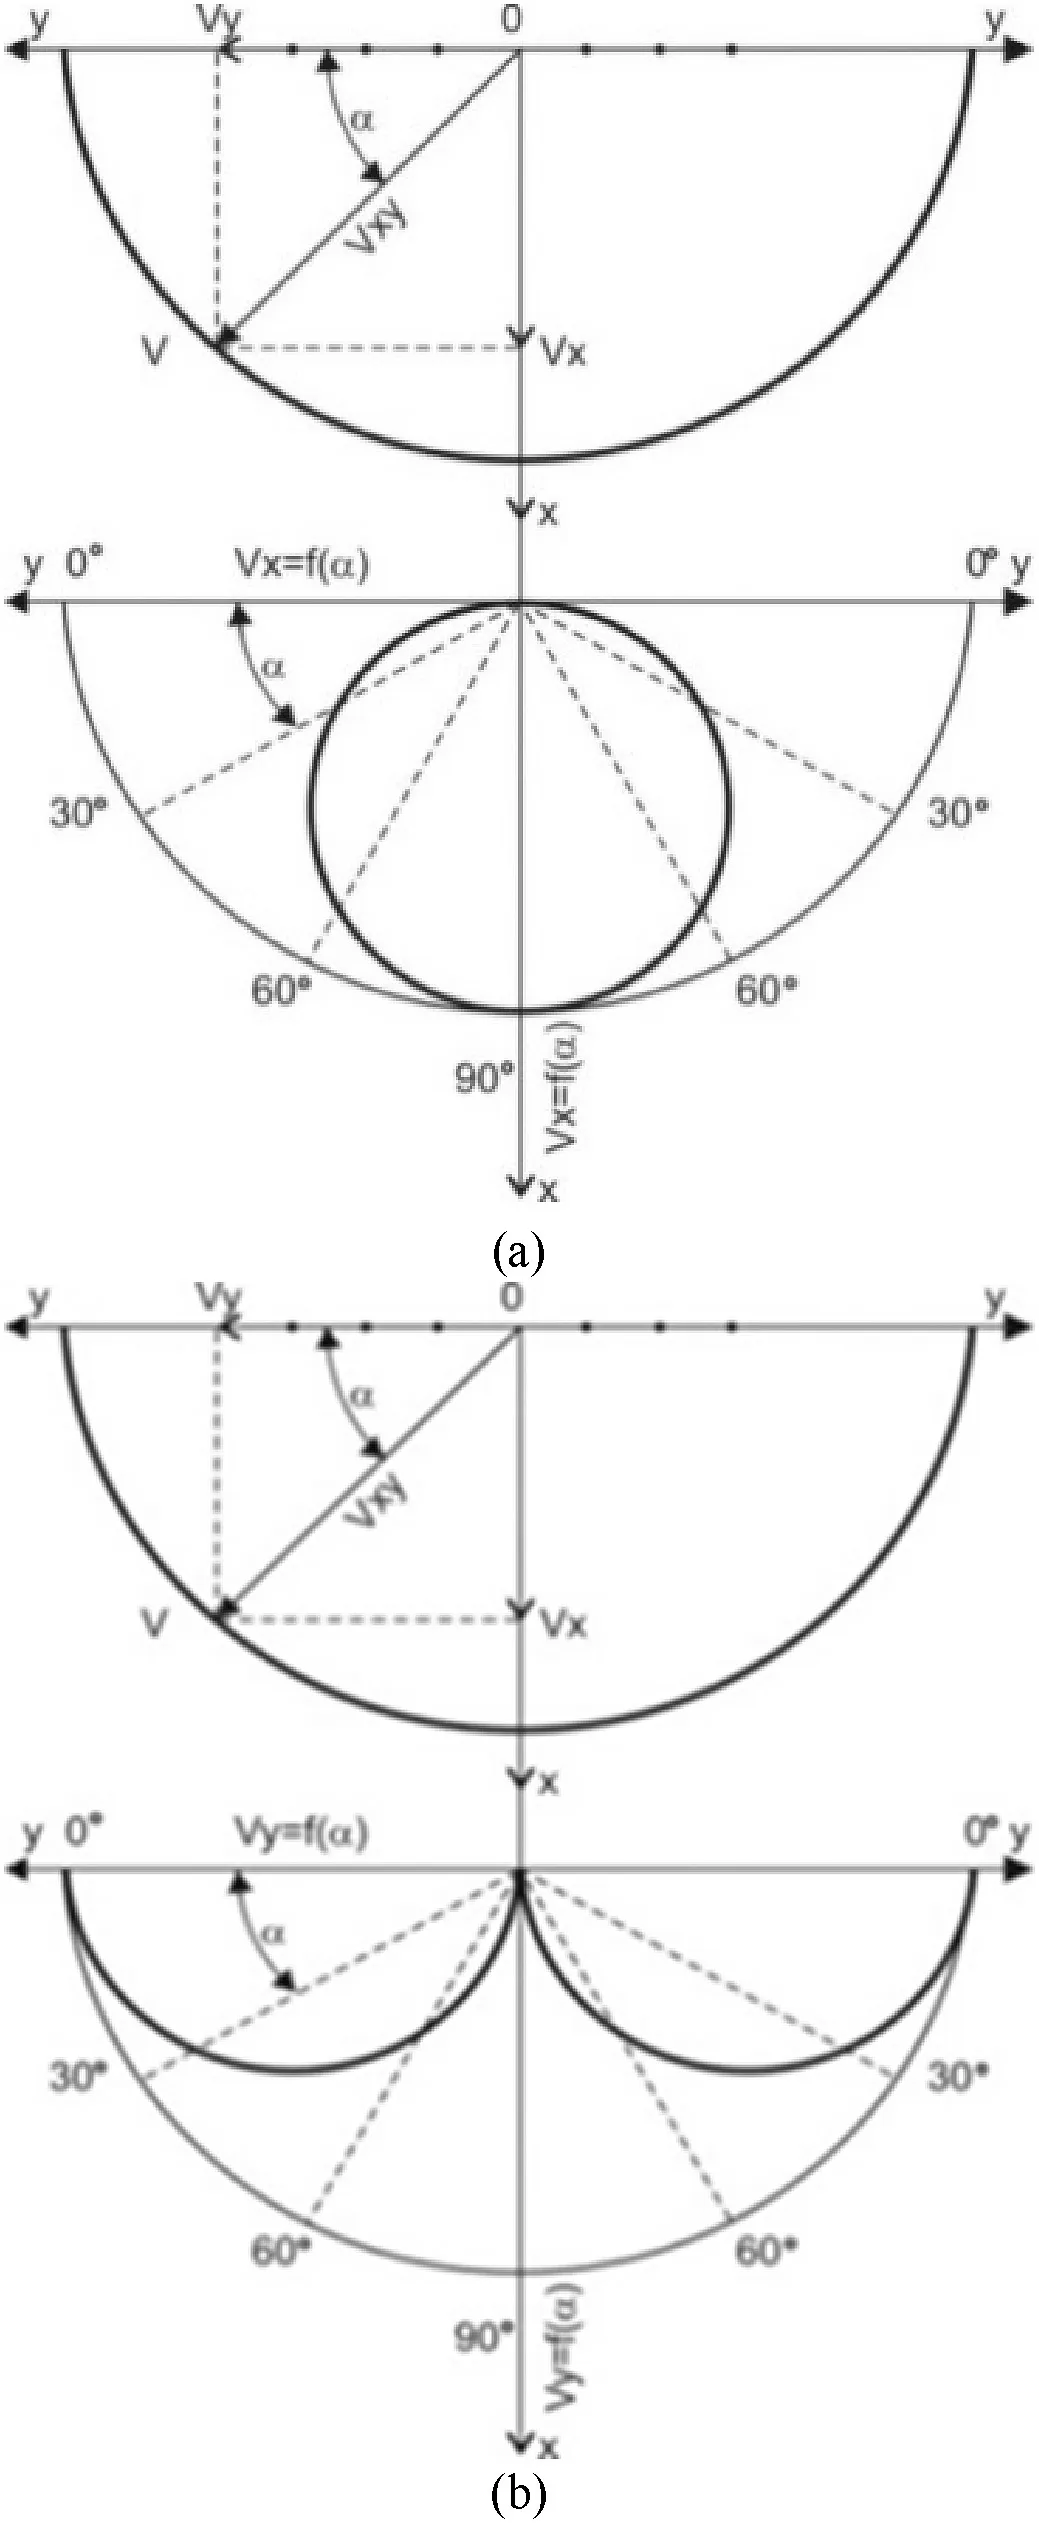
Fig.6.(a) Graphical representation of the shape and value of the unit vector of resultant vibration velocity Vxy and radial Vx of the vibration velocity of the wave as a function of the directional angle;and (b) Graphical representation of the shape and value of the unit vector of the resultant vibration velocity Vxy and tangential Vy of the vibration velocity of the wave as a function of the directional angle (Chrzan,2022).
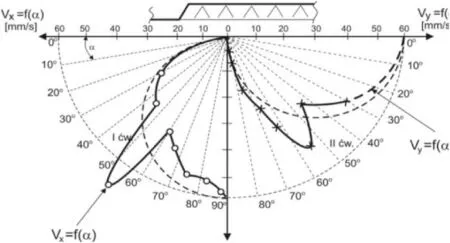
Fig.7.Circular directional distribution of horizontal radial velocity Vx= PPVx,and tangential velocity Vy= PPVy of vibrations as a function of directional angle a;the 1st quarter of the circle (after Onderka,1971).“o” represents the marked values of measurement points (Vx),“x” presents marked values of measurement points (Vy).
Fig.8.A general presentation of shock wave propagation during blasting(see Fig.9 in Garai et al.,2022).
Fig.6a and b shows that the radial and tangential vibration velocities have different values depending on the directional angle.Point 0 is in the middle hole,and it is in front of the face.Thex-axis arrow indicates the direction behind the face.They-axis coincides with the line of blast holes and the velocityVxis perpendicular toy-axis.Inx-andy-direction,the horizontal components of radialVxand tangentialVyof the vibration velocity on the tested object can be measured.The unit value of the resultant velocity vector for a circular distribution can be written in the sum of the component vectors:
whereRis the radius of the circle with value 1.
In Fig.7,a=55°is the angle of inclination of the inhomogeneity in the overburden,with the of horizontal radial velocityVxandVy(Onderka,1971).The dashed line marks the theoretical circular distribution ofVxandVy;as illustrated in Fig.6a and b.
5.Detonation waves,shock wave,seismic waves
In both mines,the minimum PPV are in front of face because free face reflects the shock wave generated due to blasting.While,in front of the blasting face,the free face will reflect the waves and propagation of shock waves,and the PPVs will also be minimum(Garai et al.,2022).
According to the description,Fig.8 (Fig.9 in Garai et al.,2022)shows the propagation of the shock wave during blasting.The text(Garai et al.,2022)does not state how the direction of initiation(see blue arrow,in Fig.8) should be determined from the detonation waves,and no additional literature was quoted.
The peak velocities of the detonation and shock waves were not measured,Garai et al.(2022) only measured the PPV.In Fig.8,unfortunately,there is no measured the PPV,vibration.There is also no information in the scientific literature that the detonation waves reach the free face.There is a confusion in Fig.8.It is common that the detonation velocity is the speed where the detonation wave passes through the BM in the borehole.It is apparent that the detonation velocity(Dick and Fletcher,2004)depends on the type of BM and the hole diameter(see Fig.9).
Fig.9.Influence the type of BM and the hole diameter on BM detonation velocity/Yaxis velocity (feet/s), X-axis hole diameter (inches) (Dick and Fletcher,2004).
Fig.10.Plot of the kinetic energy transfer of the shock wave caused by the explosion of 6 kg of Nitro Toulene Triple(TNT)on a steel plate,with measurement distance of 50 cm(Chrzan,2021).
It can be seen from Figs.3 and 4 that the first hole filled with BM is fired immediately.When firing multiple rows,a time delay is used between the holes,as well as a time delay in relation to the previous row.The successive firing of all holes causes vibrations of the mined rock and then that of the ground outside the deposit,in a form of seismic wave vibration.The firing of the BM charge causes a shock wave (Chrzan,2021),measurements were taken on a steel plate placed over the BM (see Fig.10).The BM produces the first shock wave,and then the second intermediate wave transforms into the third wave (a harmonic seismic wave with low vibration amplitude),as shown in Fig.10.The shape of the graph of kinetic energy vs.time produced by a BM explosion is similar to the theoretical shape of the vibrational velocity of the shock wave,transient and seismic wave,as displayed in Fig.11.
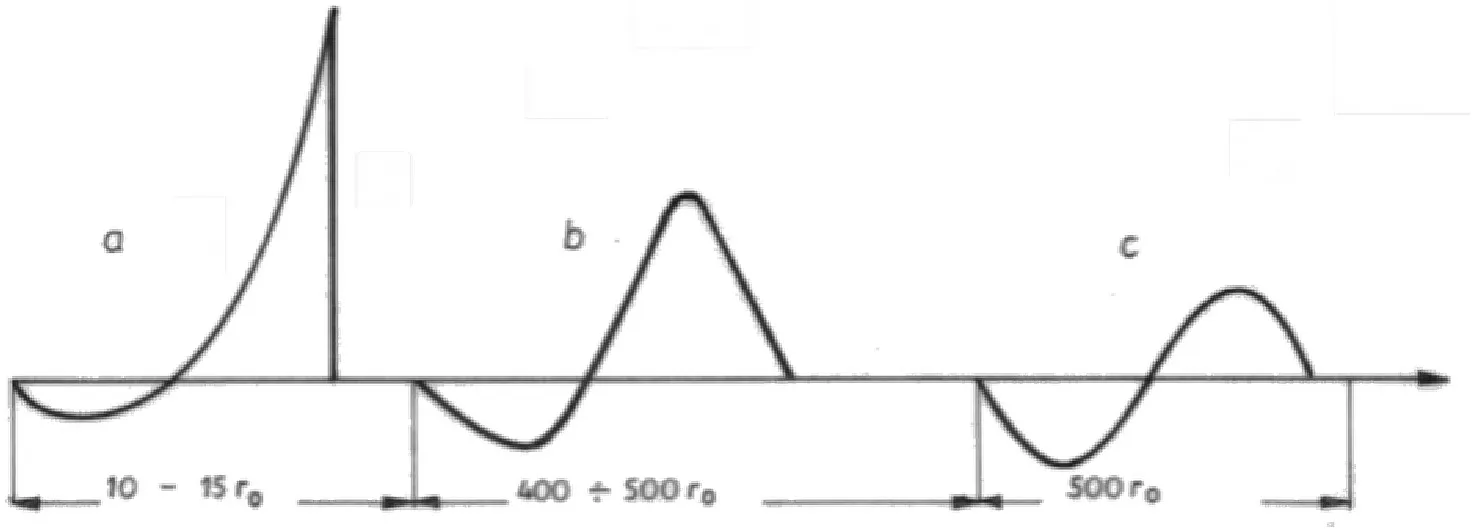
Fig.11.Theoretical waveforms.The distances of their generation as a function of the borehole radius “ro” (a is the shock wave,b is the intermediate wave,and c is the seismic wave)Shapes of the wave vibration velocities similar to those of kinetic energy Fig.10.
The measurement in Fig.10 show that the vibration frequency of the intermediate wave is lower than that of the seismic wave,approximately by 9%.On the other hand,the vibration amplitude of the intermediate wave is about 2 times that of the seismic wave.The theoretical shape of shock,intermediate and seismic waves,as well as distances of generation are a function of borehole radius for compact rocks,as presented in Fig.11.The figure shows that for a borehole with a diameter of 160 mm,the shock wave has a length of 120 cm,and it is completely contained in the burden.The length of the intermediate wave is 40 m,and it is completely contained in a block of the medium with lengthL=S*m=4.5 m*30=135 m(S=spacing;m=number of holes in 1 row),where the first full seismic wave propagates above 40 m.Thus,it is not a shock wave as claimed in Garai et al.(2022),but an intermediate wave at length up to 40 m.It is only at distances between 40 m and 135 m that the seismic wave is reflected from the free face.
The measurements of vibration velocity at 30 m from BM charges exploded in rocks are shown in Fig.12,and it confirms that there is no registration of shock wave and intermediate wave.The first wave registered on the seismogram is a seismic wave,with a small vibration amplitude as shown in Fig.12.
Fig.12 shows the superposition of vibration velocity during a millisecond firing.In the middle of the seismogram,a superposition of vibration velocities can be seen as a result of the millisecond firing of subsequent holes.Table 2 in Garai et al.(2022)shows that the shortest distance between the measuring point and the vibration source is 50 m.From this,it follows that only the velocity of seismic wave vibrations was measured.Detonation waves and shock waves in Fig.8,unfortunately,do not concern the deposit in the studied Belpahar mine and Giddi-C mine.
6.A method for selection of the time delay for a given frequency
To author’s knowledge,it is not possible to calculate the frequency of vibrations,generated before and during blasting works and the vibration period (T).In order to calculate the vibration period (T),15 different correlative relations are used to determine the timetp=T/2 of blast in the next holes (Onderka et al.,2003;Chrzan,2021).They are all based on coefficients multiplied by the size of the burden or spacing.Using these relationships,one can obtain the timetp(basically 10-50 ms)of firing of the next hole,as shown in Fig.13.At present,there are no relationship for determining the frequency of vibrations before blasting works.A method is given for determining the maximum frequencyfxmaxandfymaxof seismic wave vibrations in a deposit.With the same production parameters of blasting works at the time of previous blasting,the frequencyfxmrandfymrof seismic wave vibration can be measured at two points onx-andy-direction.The measured values offxmrandfymrare used to calculate the maximum frequencyfxmaxandfymaxof seismic wave vibrations in the deposit onX-andY-direction.Having the maximum frequencyfxmaxandfymaxof seismic wave vibrations in the deposit,we can determine the period of vibrationsTxandTyonx-andy-direction and the value of time delay during mining of charge BM of the next rock block.It is known that for the near field(Chrzan,2021),the maximum frequency of vibrations in the depositfxmaxandfymaxon the line having the directional angle∝=90°onx-andy-direction can be calculated by
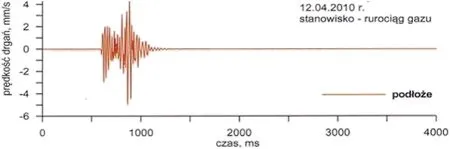
Fig.12.Sinusoidal seismograms of vibration velocity caused by firing of BM charge measurements on the ground. y-axis,vibration velocity (mm/s), x-axis,time (ms)(Chrzan,2021).
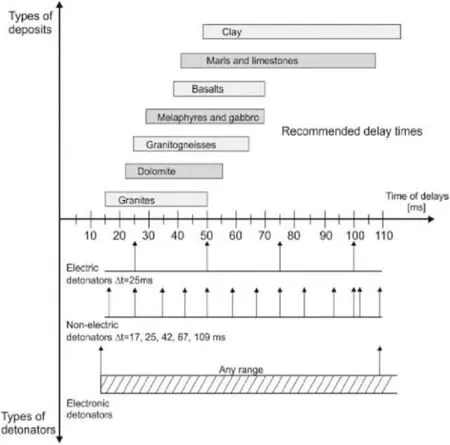
Fig.13.Selection of the blast delay time based on practice for different types of deposits (Chrzan,2021).
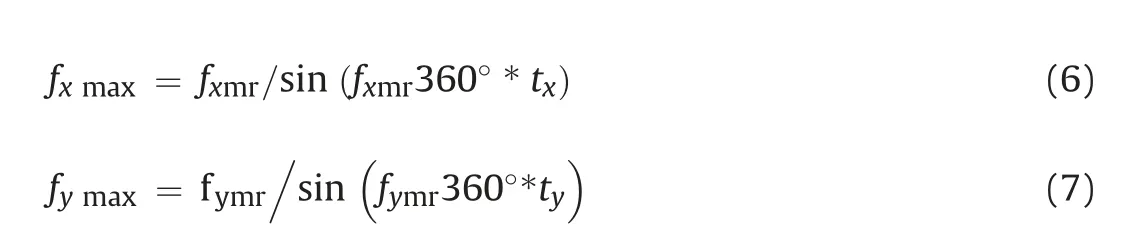
wherefxmrandfymrare the radial and tangential vibration frequency measured on the deposit at distance "r" inx-andy-directions;txandtyare the time for the wave to reach the"r"point:
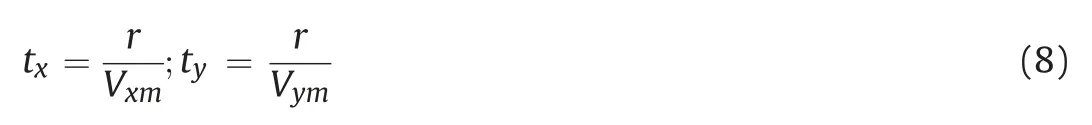
whereVxmandVymare the velocities of longitudinal wave on radial and tangential direction in the deposit.Knowing the maximum vibration frequency before blasting,we can calculate the period of vibrations so that the firing of the second hole takes place in the middle of the period of vibrationsTcaused by the first hole.
Firing the second hole at time pointtp=T/2 will result in 100%reduction of vibrations induced by the first hole (seex-andy-direction in Fig.14).Inx-direction,tp=Tx/2;iny-direction,tp=Ty/2.
7.Conclusions
The method of determiningPPVxandPPVycontours as a function of SD is a good idea to illustrate the directions with the smallest and largestPPVxandPPVy.However,testing in only 4 directions every 90°has poor accuracy compared to the 360 possible directions has the circle of the wheel.Increasing the accuracy of the method is possible by performing PPV measurements in 36 directions every 10°.The method is also more accurate and transparent if the radial vibration velocityPPVxis presented in one diagram and the tangential vibration velocityPPVyin another diagram.In the near field,it was found that for probably the same terrain and the same medium homogeneity between the vibration source and the left and right seismometers,different values of the vibration velocity occur (Garai et al.,2022).
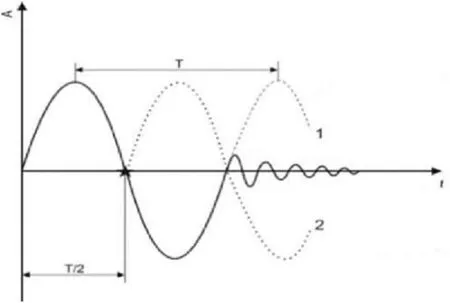
Fig.14.100%reduction of the amplitude of vibrations of the medium molecule caused by blasting in the first hole (see continuous line 1).Millisecond delay time tp= T/2,blasting in the second hole dashed line 2(see asterisk)and for the next“n"holes,tp=T/2.
(1) There is an approximately 20%increase in vibration velocity in the general (left) direction with the left direction of the charges initiation line compared to the opposite (right) direction.This relates to the unknown frequency of the generated seismic waves and the assumed time delay of 17 ms in the rows and charges of explosives placed in the blast holes of 30-90 pieces in 3 or 4 rows.
(2) By changing the orientation of the line of charge initiation,in relation to the threatened structure,thePPVxorPPVyacting on the object can be significantly reduced.
(3) ThePPVxandPPVycontouring method helps in identification of the orientation of the least and highestPPVxandPPVylines and in better understanding of ground vibration in any mine site and mine area.
(4) A method for selection of time delay for a given frequency is given,and the charge initiation direction does not cause an increase in vibration velocity in that direction.
(5) In the near field,it is found that the lowest values of the vibration velocity are found in front of the blasting face,thus the objects to protect against seismic vibrations should be located in this direction.
Declaration of competing interest
The authors declare that they have no known competing financial interests or personal relationships that could have appeared to influence the work reported in this paper.
 Journal of Rock Mechanics and Geotechnical Engineering2023年1期
- Journal of Rock Mechanics and Geotechnical Engineering的其它文章
- Aims &Scope
- Investigation on microstructure evolution of clayey soils: A review focusing on wetting/drying process
- Impact of orientation of blast initiation on ground vibrations
- Unified description of different soils based on the superloading and subloading concepts
- Self-sealing of fractures in indurated claystones measured by water and gas flow
- Saturated hydraulic conductivity of compacted bentonite-sand mixtures before and after gas migration in artificial seawater