Modelling the impacts of cover crop management strategies on the water use,carbon exchange and yield of olive orchards
Álvaro López-Bernal·Omar García-Tejera·Luca Testi·Francisco J.Villalobos,
Abstract Cover crops have long been proposed as an alternative soil management for minimizing erosion rates in olive stands while providing additional ecosystem services.However,the trade-offbetween these benef its and the competition for water with the trees makes the def inition of optimal management practices a challenging task in semiarid climates.This work presents an improved version of OliveCan,a process-based simulation model of olive orchards that now can simulate the main impacts of cover crops on the water and carbon balances of olive orchards.Albeit simple in its formulation,the new model components were developed to deal with different cover crop management strategies.Examples are presented for simulation runs of a traditional olive orchard in the conditions of southern Spain,evaluating the effects of different widths for the strip occupied by the cover crop (Fcc) and two contrasting mowing dates.Results revealed that high Fcc resulted in lower olive yields,but only when mowing was applied at the end of spring.In this regard,late mowing and high Fcc was associated with lower soil water content from spring to summer,coinciding with olive flowering and the earlier stages of fruit growth.Fcc was also negatively correlated with surface runoffirrespective of the mowing date.On the other hand,net ecosystem productivity (NEP) was substantially affected by both Fcc and mowing date.Further simulations under future climate scenarios comparing the same management alternatives are also presented,showing substantial yield reductions by the end of the century and minor or negligible changes in NEP and seasonal runoff.
Keywords Carbon exchange·Cover crops·Crop modelling·Evapotranspiration·Olea europaea L
Introduction
In the Mediterranean Basin,characterized by hot dry summers and cool wet winters,olive trees cover more than 10 Mha (FAOSTAT 2022).In many olive growing regions,the cultivation of this tree crop is done in extensive areas,shaping landscapes and becoming of an enormous relevance from economic and ecological perspectives.That is the case of Spain,where olive orchards represent one of the most extended crops,occupying 2.6 Mha.
Traditional rainfed olive cropping systems,characterized by low planting densities,low use of inputs and low canopy cover are still the most extended in Spain and many other olive growing regions.These systems usually occupy hilly areas with steep slopes,and soil management is traditionally based on repeated tillage and/or application of herbicides.These factors,in combination with the generally low canopy ground cover,and the occasional albeit recurrent high-intensity rainfall episodes typical of the Mediterranean-like climate,have led to severe soil erosion problems that threaten the long-term sustainability of olive orchards (Gómez et al.2014a,b).Moreover,olive farming has also been associated with other environmental issues such as diffuse pollution,loss of biodiversity and pressure on the scarcely available water resources (Carpio et al.2017).In many cases,some of these issues have been linked to the recent trend towards crop intensification,which involves the use of irrigation and machinery,higher planting densities and higher application of fertilizers and pesticides.
Existing literature indicates that the use of cover crops in the orchard alleys has a number of positive effects,such as reducing soil erosion rates and diffuse pollution (Francia et al.2006;Gómez et al.2011),increasing biodiversity (Paredes et al.2013;Gómez et al.2018),improving soil properties (Gómez et al.2009) and increasing CO2sequestration as soil organic matter (Soriano et al.2014;Chamizo et al.2017).In the light of some of these benef its,public policies in Spain under the EU Common Agricultural Policy regulations promote the adoption of cover crops by implementing mandatory requirements in olive orchards.Nevertheless,conventional soil management based on ploughing and/or herbicide applications are still a predominant feature.In this regard,farmers remain reluctant to adopt cover crops due to the risk of competition for soil water and subsequent yield reductions (e.g.Corleto and Cazzato 2008;Gucci et al.2012),given the scarcity of rainfall and the high evaporative demand in most olive growing areas.Previous studies in Southern Spain suggest that proper management of cover crops is key to avoid yield reductions,with species selection and time of mowing playing a crucial role (Abazi et al.2013;Sastre et al.2016).However,any management oriented towards ameliorating the detrimental effects on olive yield may also lead to a lower provision of the ecosystem services that the cover crops supply (Alcántara et al.2017).
Field experiments aimed at finding optimal strategies for cover crop management in specific orchards are challenged by the huge interannual variability in rainfall patterns of the Mediterranean climate,unless they comprise many years (Hernández et al.2005).Furthermore,experimental results can be difficult to extrapolate to other plantations due to differences in stand characteristics (e.g.canopy ground cover) and management (e.g.irrigated/rainfed),soil properties (e.g.water holding capacity),weather conditions and cover crop species.Crop simulation models are powerful tools for answering practical questions related to the assessment of management alternatives in specific environmental scenarios.
Recently,López-Bernal et al.(2018) developed Olive-Can,a process-based model for olive orchards that simulates growth,development and yield through a highly detailed characterization of the water and carbon balances.OliveCan accounts for the effects of weather,soil attributes and some management operations including localized irrigation,pruning,tillage and harvest.This study introduces a new model component simulating the effects of cover crops on the water and carbon balances of olive orchards within the framework of OliveCan.In doing so,the model could be applied to explore optimum management strategies of cover crops for a wide range of climates,soils and stand typologies,thereby expanding the limited knowledge obtained from field studies.Simulation experiments are also presented for identifying best management practices to meet productive and/or environmental objectives under present and future climate scenarios.The specific goals of the study were:(1) to develop new OliveCan model components simulating the effects of cover crops on the water and carbon balances of olive orchards,(2) to evaluate the impacts of different cover crop management strategies in terms of oil yield,the main water balance components and the net ecosystem productivity (NEP),and (3) to provide insight into the environmental and productive sustainability of cover crops in olive orchards in the context of climate change.
Materials and methods
Model description
OliveCan is composed of two main interdependent components that are responsible for computing the water and carbon balances of the olive orchard,both of them requiring information on soil and tree traits,weather data and management operations.On the one hand,the water balance component solves separately the water balance for two soil zones representing the dry and wetted (by irrigation emitters) surface fractions.This soil compartmentalization approach allows OliveCan to mimic spatial differences in soil water content and root distribution associated to the use of localized irrigation.Thus,irrigation events only supply water to the wetted soil zone,while rainfall feeds both the dry and the wetted fractions.Losses of water via runoff,percolation,soil evaporation and root water uptake are independently calculated for each soil zone,which in turn is divided into a customizable number of layers of variable thickness.Vertical water redistribution between adjacent layers within the same soil zone is also simulated,but lateral flow between soil zones is never considered.On the other hand,the carbon balance component simulates the growth of the various organs composing tree biomass by simulating a number of processes such as photosynthesis,maintenance and growth respiration,partitioning (mediated by phenological state) and senescence of leaves and fine roots.OliveCan also simulates heterotrophic soil respiration,which allows the user to estimate the Net Ecosystem Exchange (NEE).Further details on the algorithms used to simulate the different processes can be found in López-Bernal et al.(2018).
To simulate the effects of a cover crop,it is critical to consider its impacts on the water balance.To do so,a third soil zone representing the fraction of soil occupied by the cover crop (Fcc) was added to the water balance component of OliveCan.Transpiration by the cover crop (Ecc,mm d-1) results in decreases of soil water content in the layers within the new soil zone that are explored by the roots of the cover crop.In the new model routines,Eccis calculated as:

whereEcc,potis potential cover crop transpiration (mm d-1),kis light extinction coefficient (dimensionless),GLAI is green leaf area index of the cover crop (m2m-2) and SWF1is a water stress factor (dimensionless) limiting transpiration that ranges from 0 to 1 as a function of relative soil water content (RSWC,dimensionless) as:

where RSWCcrit,eis a parameter representing the critical value of RSWC below which transpiration is limited.RSWC is def ined as:

Withθbeing the average water content in the soil layers explored by the roots of the cover crop (m3m-3) andθULandθLLthe soil water contents at the upper (i.e.f ield capacity) and lower (i.e.permanent wilting point) limits,respectively.
On the other hand,Ecc,potis calculated from the Penman-Monteith equation:

where Δ is the slope of the relationship between saturated vapor pressure and temperature (kPa K-1),Rnis net radiation (J m-2s-1),γis the psychrometric constant (kPa K-1),VPD is vapor pressure def icit (kPa),ρis air density (kg m-3),Cpis air specific heat (J kg-1K-1),andrcandraare canopy and aerodynamic resistances (s m-1).rais calculated from Villalobos et al (2016):

wherezis the reference height (m),his cover crop height (m),kkis von Kármán constant (0.4) andUais wind speed at the cover crop level (m s-1).The height of the cover crop is estimated as a function of the actual LAI:

wherehcc,maxis the maximum height of the cover crop and LAImaxrepresents its maximum attainable LAI.On the other hand,Uais computed from tree height (htree,m) and inversely related to tree canopy cover (GC):

whereUis wind speed (m s-1) at 2 m height (i.e.recorded in a weather station).A particular feature of the improved version of OliveCan is that it implements the model of radiation interception of Mariscal et al.(2000),so the Penman-Monteith equation (Eq.4) is applied considering explicitly the solar radiation reaching the soil strip occupied by the cover crop (assuming that it is centered in the middle of the alley).
Finally,the calculation ofEccrequires the growth of the cover crop to be simulated.GLAI is calculated from total standing leaf area index (LAI,m2m-2) and senescent leaf area index (SLAI,m2m-2).Both LAI,GLAI and SLAI vary dynamically during the cover crop growing cycle,which is subdivided into four consecutive phenostages.The transitions between phenostages occur at emergence (I),when new leaf area growth is stopped (II),at the start of senescence (III) and at the date of physiological maturity (IV).In the model,such transitions are triggered when cumulative thermal time since the germination date (GDD,°C d) exceeds a phase-specific threshold value (termed GDDIto GDDIV,depending on the transition).Phenostage I starts on the date of sowing or germination,which is a customizable input parameter,but the model delays it until the water content in the first layer of the soil is above a RSWC threshold (RSWCcrit,g) .The GDD for a given date “i” is calculated as:

whereTmed,iis average temperature of the day “i”,andTb,ccis base temperature of the cover crop.
During phenostage I,LAI,GLAI and SLAI remain set to zero.In a day “i” during phenostage II,the daily increase in LAI (ΔLAIi,m2m-2d-1) is computed as:

where ΔLAIpot,iis the potential LAI increase of the cover crop under optimal conditions in day “i” (see below),the coefficientFgis the soil fraction covered by grass within the cover crop strip (dimensionless,range 0 to 1) and SWF2is a water stress factor (dimensionless,range 0 to 1) that limits potential growth as a function of RSWC andEcc,max:

Potential LAI (LAIpot,m2m-2) dynamics during phenostage II follows a Gompertz-type function of GDD:

where LAImaxis the maximum attainable LAI anda2anda3are parameters related to the shape of the LAIpot-GDD curve.Then,for a given day “i”,ΔLAIpot,iis calculated as:

Leaf senescence is not considered in the first three phenostages,so the model satisf ies the condition GLAI=LAI while GDD < GDDIII.During phenostage IV,SLAI increases linearly with GDD from 0 at GDD= GDDIIIto LAI at GDD= GDDIV:

And,hence,GLAI can be deduced as:

Root growth of the cover crop is also simulated by considering that root depth (Zcc,m) is proportional to GDD during the first two phenostages:

where the parametera3represents the rate of vertical root penetration into the soil per unit of thermal time (m (°C d) -1).The model also constraintsZccso that it is not allowed to be higher than neither a maximum attainable value (Zcc,max) nor soil depth.The simulation ofZccis relevant for the cover crop model component,as it determines the soil layers that the model takes into account for the calculation of SWF1and SWF2.
BesidesEcc,the model also considers that the presence of the cover crop affects the calculations of inf iltration,surface runoffand soil evaporation in the corresponding soil compartment.Thus,the curve number,used in the calculation of the former two is parameterized according to Romero et al.(2007),while potential soil evaporation in the strip (Es,pot,cc,mm d-1) is reduced below that of the bare dry soil compartment (Es,pot,dry,mm d-1) following:

With regard to the impacts of the cover crop on the carbon balance of the orchard,aboveground biomass production by the cover crop (Bcc,g m-2) is calculated from intercepted photosynthetically active radiation (IPARcc,MJ PAR m-2) and radiation use efficiency (RUEcc,g MJ PAR-1),and it is constrained in case of soil water def icit:

IPARccis calculated from solar radiation (Rs,MJ m-2) andτccas:

On the other hand,RUEccis determined from the product of a reference value at 380 ppm (RUEcc,380,g MJ PAR-1) and a factor (FRUE,dimensionless) that depends on the atmospheric carbon dioxide concentration (Ca,ppm):

where the coefficientsf1(dimensionless),f2(dimensionless) andf3(ppm-1) determine the shape of the RUEcc-Car elationship,which saturates at highCa,in any case (Gifford 1992).
Daily net assimilation by the cover crop is deduced from the increases in biomass production as:

where PVccis a production value (g G g DM-1,where “G” is for glucose equivalents and “DM” for dry matter),PCcc,ris the partitioning coefficient to roots (dimensionless) and 44/30 accounts for the conversion of g G into g CO2.Then,NEE (g CO2m-2day-1) can be computed as:

where GTP is gross tree photosynthesis,Fccis the fraction of the soil occupied by the cover crop strip and RESPtreeand RESPHare tree and soil heterotrophic respiration rates (the last two already calculated as in the previous version of OliveCan).According to this equation,the model considers NEE > 0 when CO2is moving from the atmosphere into the ecosystem.Finally,at mowing,it is assumed that Bccis incorporated as litter into the upper soil layer carbon pool.Additionally,the soil carbon pool is fed by root turnover.For each soil layer “i”,root biomass is calculated considering its thickness (L(i),m) in relation toZcc:

I n silico experiments
Simulation experiments were performed for a rainfed olive orchard in southern Spain,considering different widths for the strip occupied by the cover crop and mowing dates.The purpose of the simulations was to evaluate how different cover crop management alternatives affect the water and carbon balances of a traditional olive orchard in Southern Spain,with special emphasis on those related to the productivity of the trees and some of the environmental benef its commonly associated to the use of cover crops (increase in NEP and reduction of surface runoff).
Weather data required for running the model (i.e.daily values of solar radiation,maximum and minimum air temperature,rainfall,wind speed and vapor pressure) were taken from actual records collected in an automated station placed in ‘La Reina’ farm (Córdoba,Spain,37.8° N,4.9° W,100 m altitude) for 20 years (2001-2020).During that period,average annual rainfall was 617 mm a-1(range 384-987 mm a-1) while the reference evapotranspiration (ET0,Allen et al.1998) was 1283 mm a-1(range 11471382 mm a-1).A 1 m depth clay loam soil was considered.pH was set at 8.5 and bulk density at 1.3 g cm-3.Soil organic carbon was initialized at 0.7%.The simulated orchard had a density of 208 trees ha-1,with trees regularly spaced at 8 m × 6 m.Pruning was implemented every two years,maintaining ground cover around 35% over the whole simulation period,and it was assumed that fruits were always harvested on December 10th (Table S1).All in all,the weather,soil and orchard characteristics considered for the simulations are representative of many rainfed olive growing areas in Southern Spain.
With regard to the cover crop management alternatives evaluated,simulations were performed for five different widths of the cover crop strip (Fccof 10%,20%,30%,40% and 50% of ground cover,which is equivalent to 0.8,1.6,2.4,3.2 and 4.0 m wide strips) and two contrasting mowing dates (March 1st and June 1st).The cycle of the cover crop started on October 11th,water content permitting.A good establishment of the cover crop was always assumed (Fg=1).
Finally,simulations were repeated for future climate scenarios considering the same soil,stand and management alternatives.Future scenarios were generated for four temporal horizons (2021-2040,2041-2060,2061-2080 and 2081-2100) by manipulating temperature and vapor pressure using the real 2001-2020 weather set described previously as baseline.The magnitude of the temperature increase adopted for each scenario was set according to the average for RCP scenario 8.5 calculated by the IPCC (2021).On the other hand,vapor pressure (VP) was increased in proportion to temperature so that relative humidity was kept constant in all the scenarios.The changes were applied daily,irrespective of the month or season.No variation in annual rainfall was considered among the different scenarios.Besides,Cawas set for each temporal horizon according to the RCP8.5 scenario for greenhouse emissions (IPCC 2021).Table 1 shows information on key weather variables andCafor the five temporal horizons.
Model calibration
For the simulations,the values of the parameters included in the cover crop model component were primarily taken from the literature for Poaceae species used as cover crops,when available.In this regard,kwas taken from Movedi et al.(2019) forLolium multif olrum,whileZcc,maxandhcc,maxwere taken from field experiments withBromus rubensby Soriano et al.(2016).As tall grasses usually exhibit lower values ofrcin relation to the reference grass (Allen 1986),a value of 50 s m-1was used.The duration of the cycle was adjusted prior to simulations so that the transitions between phenostages occurred -on average for the 2001-2020 scenario-on October 20th (emergence),April 21th (end of vegetative growth),May 4th (start of senescence) and May 29th (physiological maturity),assuming a base temperature of 0 °C (Gómez and Soriano 2020).Parameters shaping the LAIpotversus GDD relationship (Eq.12) were fitted to data resulting from simulations with CERES-Barley (Jones et al.2003) performed for the same site and assuming a low planting density.RSWCcrit,eand RSWCcrit,gwere set to 0.3 and 0,respectively,the latter implying that germination proceeds on October 11th unless soil water content is equal or lower thanθLL.The parameters involved in Eq.20 were fitted considering the following constraints:(1) at the CO2compensation point (assumed at 100 ppm),RUEccis null,(2) atCa=380 ppm,RUEccshould equal RUEcc,380,which was given a typical value for C3 species (1.5 g (MJ PAR)-1) and,(3) reports from experiments of CO2enrichment for wheat (Rudorffet al.1996;Manderscheid et al.2003) and C3 species in general (Gifford 1992) suggest that doubling CO2concentration results in a relative increase in RUE around 30% (i.e.atCa=760 ppm,RUEcc=1.95 g (MJ PAR)-1).PVccwas def ined according to Penning de Vries et al.(1974) assuming a biomass composition with 90% carbohydrates,7% proteins and 3% lipids,which led to a value of 1.32 g G (g DM)-1.Finally,PCcc,rwas set as 0.3.Table S2 provides a complete list with the parameter values used for the simulations in this study.
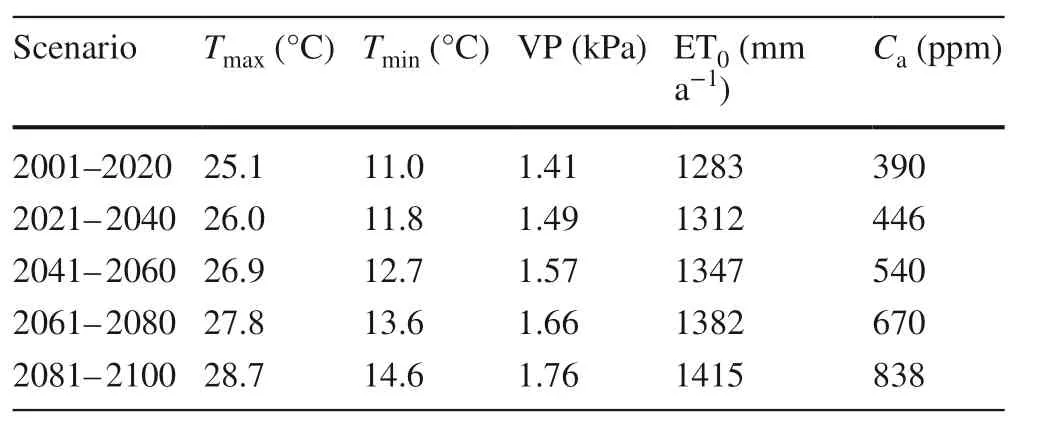
Table 1 Annual averages of maximum (Tmax) and minimum temperatures (Tmin),average vapor pressure (VP),reference evapotranspiration (ET0) and atmospheric CO2 concentration (Ca) in the five temporal horizons considered for the simulations
Results
Present scenario
BothFccand mowing date affected the evapotranspiration (ET) of the orchard so that the higher theFccand the later the mowing date,the higher the estimates of ET (Fig.S1).Average values ranged from 454 to 470 mm a-1when the cover crop was removed on March 1st and from 458 to 491 mm a-1when mowing was applied on June 1st.Soil evaporation (Es) represented the major ET component,with average values in the intervals from 242 to 229 mm a-1(mowing on March 1st) and 237-204 mm a-1(mowing on June 1st) (Fig.1).The lowest and highest values ofEscorresponded to the widest and narrowest strips,respectively,irrespective of the mowing date.
For early mowing,negligible differences on tree transpiration (Etree) were noticed among the differentFcc(Fig.1).On a seasonal basis,Etreewas always in the range 161-163 mm a-1for these simulations.Comparatively,lower values (in the range 135-156 mm a-1) were found for late mowing,withEtreebeing negatively correlated withFcc.For the most unfavorable case (i.e.Fcc=50%),the average seasonalEtreewas reduced by 17% when comparing late with early mowing.
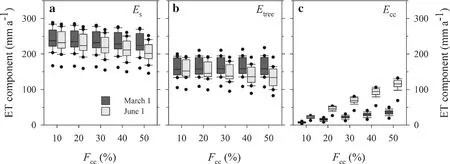
Fig.1 Box plots of seasonal soil evaporation (a,Es),tree transpiration (b,Etree) and cover crop transpiration (c,Ecc) for simulations under different ground covers of the grass strips (Fcc =10%,20%,30%,40%,and 50%) and mowing dates (March 1st and June 1st).The boundaries of the boxes indicate 25th and 75th percentiles,while the horizontal line marks the median.Whiskers indicate 10th and 90th percentiles;the outliers are presented as dots.Data obtained from simulations of the 2001-2020 scenario
The magnitude of transpiration by the cover crop (Ecc) was heavily inf luenced by bothFccand mowing date.Eccranged from 7 to 36 mm a-1for early mowing and from 23 to 114 mm a-1for late mowing,with the higher values of the interval corresponding toFcc=50%.Hence,the contribution ofEccto the ET of the orchard was modest for narrow strips and/or early mowing,but substantial for wide strips and late mowing (up to 23% of ET forFcc=50% and late mowing).
Wide strips contributed to reduce the number and magnitude of runoffevents.Considering the whole simulation period (i.e.2001-2020) and early mowing,there were 167 days with runoffrates > 2 mm forFcc=10%,but only 32 days forFcc=50%.On the other hand,maximum daily runoffrates over the 20-year period were 49 and 22 mm d-1forFccequal to 10% and 50%,respectively (Fig.2 a).On a seasonal basis,the average water lost through surface runoffwas 89 mm a-1forFcc=10% and 15 mm a-1forFcc=50% (Fig.2 b).Simulations mowing the cover crop on June 1st led to almost identical results,as model calculations of the curve number are not affected by mowing date.
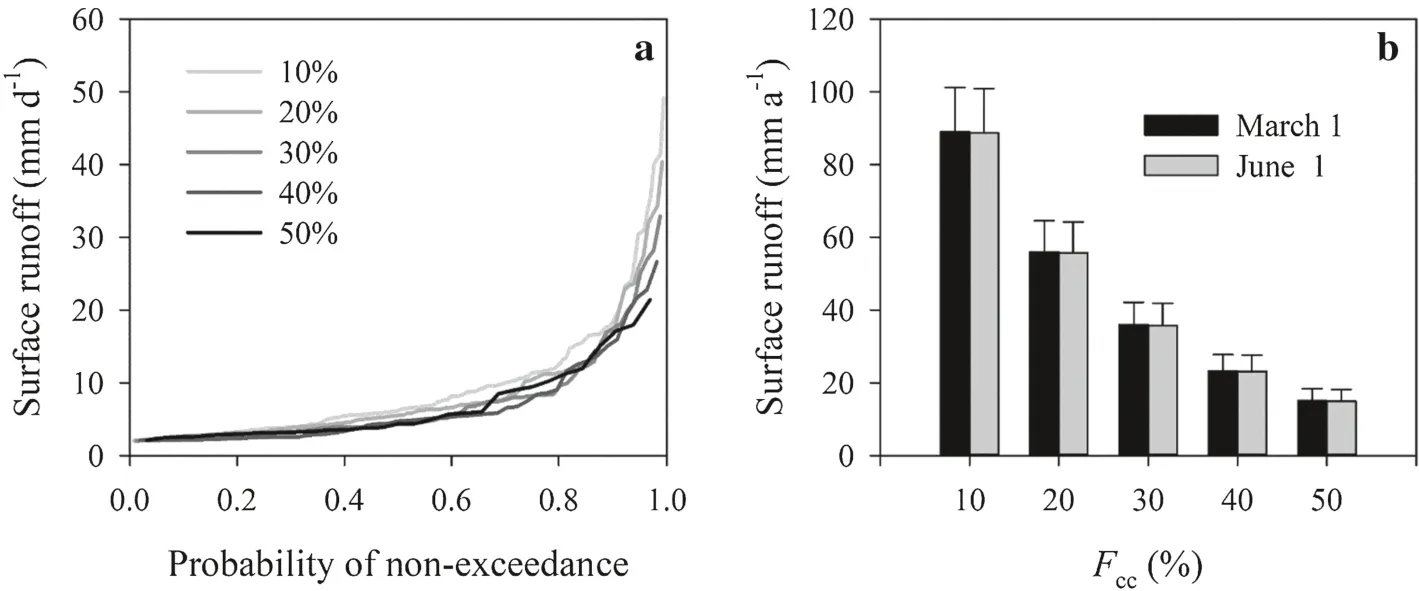
Fig.2 a Cumulative frequency distributions for runoffevents exceeding 2 mm d-1 for simulations applying mowing on March 1st in the 2001-2020 scenario.Each series represents a different width of the cover crop strip (Fcc of 10%,20%,30%,40%,and 50%).b Aver-age seasonal runoffrates as a function of Fcc (10%,20%,30%,40%,and 50%) and mowing date (March 1st and June 1st).Error bars indicate standard error
Average water losses through deep percolation ranged from 72 to 129 mm a-1for early mowing,and from 69 to 109 mm a-1for late mowing (Fig.S2).Contrarily to the case of runoff,here the highest values in the intervals correspond the widest strips (Fcc=50%),while the narrowest (Fcc=10%) exhibited the lowest percolation rates.This phenomenon was due to the higher inf iltration of rain water in wider strips during autumn-winter,the period when most of the annual rainfall is concentrated (Fig.3) andEccis still relatively small.
The effect ofFccand mowing date on the seasonal course of soil water content is illustrated in Fig.3 for three contrasting cases:(1)Fcc=20% and mowing on March 1st,(2)Fcc=20% and mowing on June 1st,and (3)Fcc=50% and mowing on June 1st.Irrespective of the mowing date andFcc,soil water dynamics followed a similar pattern in autumn and winter,the period when most of the rainfall is usually concentrated.However,the patterns diverged among management alternatives in spring,reaching,by early summer,a maximum average difference of 40 mm when comparing the results forFcc=20% and early mowing with those ofFcc=50% and late mowing.Differences among management alternatives were gradually reduced during the summer,as soil water content approached the permanent wilting point due to the lack of precipitations,and gradually reduced with rainfall episodes in autumn.Both olive flowering (the average date was April 29th) and the earliest fruit growth stages coincided with the period of maximum differences in water availability among management alternatives.
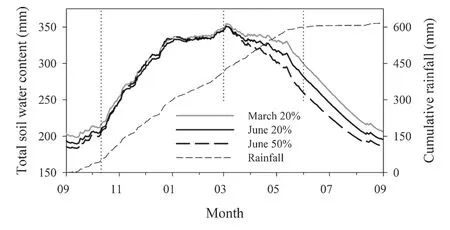
Fig.3 Mean seasonal course of soil water content for three of the simulated alternatives of cover crop management (Fcc =20% and mowing on March 1st,Fcc =20% and mowing on June 1st,Fcc =50% and mowing on June 1st) in the 2001-2020 scenario.The thin dashed line shows cumulative rainfall since September 1st.Values of both soil water content and cumulative rainfall were obtained as averages of the 20 years for each day.The vertical dotted lines indicate the dates of the start of the cover crop cycle and the two contrasting mowing dates
Model estimates of olive fruit productivity were barely affected byFccfor simulations mowing the cover crop on March 1st.Average oil yields ranged from 966 (Fcc=10%) to 983 kg ha-1(Fcc=50%) (Fig.4).For late mowing,oil yields were comparatively lower,particularly for the wider strips.Values ranged from 818 (Fcc=50%) to 934 kg ha-1(Fcc=10%),which imply that late mowing resulted in yield decreases in the interval 3%-17% in relation to earlymowing.Regardless of management,yield inter-annual variability was high (coefficient of variation of around 25%).Looking at the data year-by-year,oil yields were only poorly correlated to cumulative precipitation (since September 1st) or total soil water content on March 1st (Fig.5).
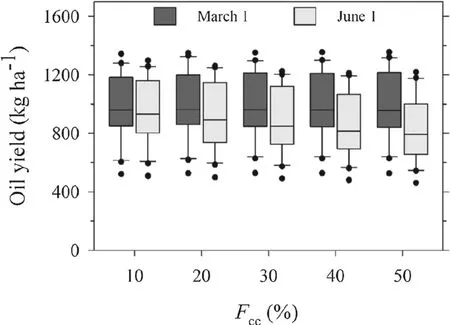
Fig.4 Box plots of oil yield for simulations under different ground covers of the grass strips (Fcc =10%,20%,30%,40%,and 50%) and mowing dates (March 1st and June 1st).The boundaries of the boxes indicate 25th and 75th percentiles,while the horizontal line marks the median.Whiskers indicate 10th and 90th percentiles;the outliers are presented as dots.Data obtained from simulations of the 2001-2020 scenario
In all the evaluated alternatives,NEE rates were positive (CO2entering the ecosystem) for most of the year,peaking by mid-spring.Nevertheless,negative values (CO2leaving the ecosystem) also occurred in all cases during the summer.Figure 6 provides insight into the seasonal dynamics of NEE by plotting cumulative values since September 1st for three simulations differing in eitherFcc(20% versus 50%) or mowing date (March 1st versus June 1st).While the cover crop was present and considering the same mowing date,NEE rates were always higher for the widest strip.On the other hand,for the sameFcc,NEE rates did not differ much between mowing dates for most of the year,except for the spring period between them (March-May).Integrating the CO2fluxes on a seasonal basis and considering all the simulated management alternatives,average NEP ranged from 774 (Fcc=10%) to 1104 g CO2m-2a-1(Fcc=50%) for early mowing,and from 882 to 1658 g CO2m-2a-1for late mowing (the extremes of these ranges corresponding toFcc=10% andFcc=50%,respectively) (Table S3).Estimates of the ecosystem water productivity (WPeco),def ined as the ratio of NEP to ET,ranged from 1.7 to 2.3 g CO2L-1for early mowing and from 1.9 to 3.4 g CO2L-1for late mowing (the extremes of these ranges corresponding toFcc=10% andFcc=50%,respectively).
The relative contribution of the cover crop to net primary productivity (i.e.the sum of net photosynthesis by both trees and cover crop) varied as a function of both mowing date andFcc.It was rather low as compared with that of the trees for early mowing or very narrow strips,but similar in magnitude for late mowing and highFcc(Fig.7).NeitherFccnor mowing date had a substantial influence on model estimates of soil heterotrophic respiration.
Late mowing always resulted in higher values of soil organic carbon (SOC) by the end of the 20-year simulation period than early mowing (Fig.S3).Fccslightly affected final SOC for early mowing,but it had a large influence for late mowing (the higher theFcc,the higher the final SOC).The extreme values were 2506 (early mowing,Fcc=10%) and 2715 (late mowing,Fcc=50%) g C m-2.
Future scenarios
Neither ET,runoffnor percolation changed substantially when comparing simulation outputs for the different climatic scenarios.Some changes in the relative weight of the major ET components were noticed (Fig.S4).In this regard,Eswas 5-7% higher for the 2081-2100 scenario in relation to the present (2001-2020),regardless of the management alternative.Most of this increase was compensated by decreases inEtreealone for simulations considering mowing on March 1st,asEccremained similar or even increased slightly in the future scenarios.By contrast,bothEtreeandEccwere reduced for late mowing conditions,with the latter being the most affected component (in absolute terms) for simulations withFcc> 20%.
On average,crop yield decreased through the twentyf irst century for all management alternatives (Fig.8,Fig.S5).Comparing the farthest scenario (i.e.2081-2100) with the present,oil yield decreased by 27% for early mowing,irrespective ofFcc,and between 13 (Fcc=50%) and 23% (Fcc=10%) for late mowing.In any case,late mowing andFcc=50% resulted in the lowest oil yields for all the temporal horizons considered.An increase in the inter-annual variability in oil yield was also noticed for the farther temporal horizons.In this regard,the coefficient of variation of oil yield was around 25% for 2001-2020 scenario and around 45% for 2081-2100 (small differences among management alternatives).
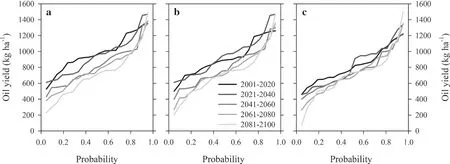
Fig.8 Cumulative frequency distributions for oil yield considering different temporal horizons within the twenty-f irst century.Each panel shows the results for a different management alternative:a cover crop strip with Fcc =20% mowed on March 1st,b cover crop strip with Fcc =20% mowed on June 1st and,c cover crop strip with Fcc =50% mowed on June 1st
On average,both photosynthesis and respiration rates increased for the simulated climate change scenarios as compared with the present (2001-2020),except for soil heterotrophic respiration which did not change much.NEP increased slightly throughout the century (particularly in the first half) for simulations applying early mowing (Fig.9).By contrast,NEP barely differed among temporal horizons when considering late mowing.
Discussion
The benef its of cover crops in olive and other woody crops have been extensively documented in the literature (e.g.Gómez et al.2011;Alcántara et al.2017;Kavvadias and Koubouris 2019),but it has also been proved that the management of these systems requires fine-tuning to prevent excessive yield losses (Alcántara et al.2011;Gucci et al.2012;Abazi et al.2013;Michalopoulos et al.2020).The optimal management of the cover crop can differ from year to year for a given site,or from site to site,due to weather fluctuations and differences in climate conditions,soil traits,orchard characteristics and cover crop species.In this context,the evaluation of alternatives in field experiments provides limited information to support orchard-or year-specif cimanagement decisions,hence making the development of dedicated modelling tools of paramount interest.
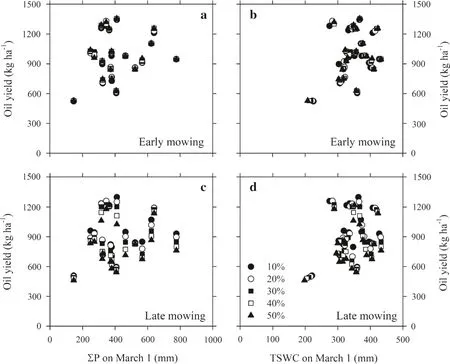
Fig.5 Oil yields estimated in the simulations under early (a,b) and late (c,d) mowing as a function of cumulative rainfall since September 1st (∑P; a,c) or total soil water content (TSWC; b,d) on March 1st.Each symbol corresponds to a different scenario for the percentage of ground covered by the cover crop strip (Fcc)
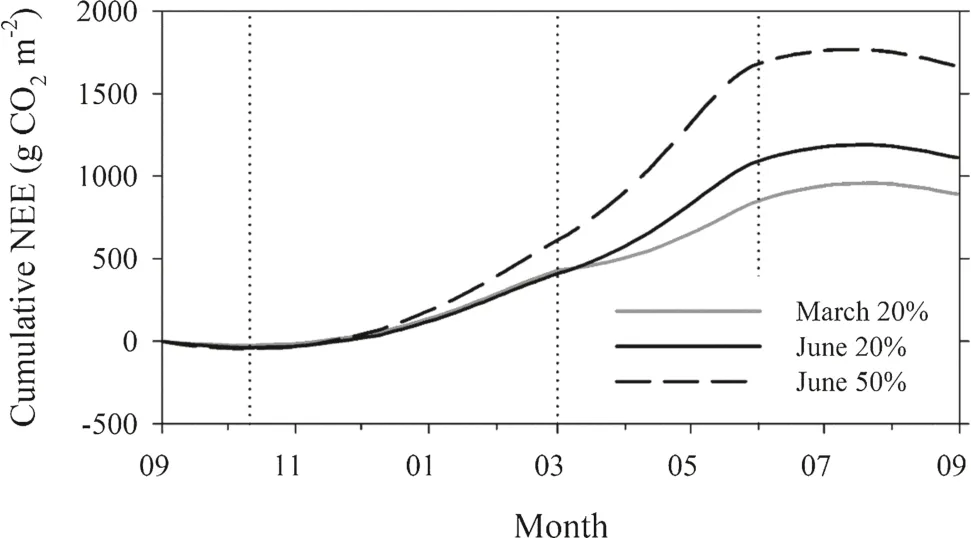
Fig.6 Mean seasonal patterns of cumulative Net Ecosystem Exchange (g CO2 m-2) since September 1st for three of the simulated strategies of cover crop management (Fcc =20% and mowing on March 1st,Fcc =20% and mowing on June 1st,Fcc =50% and mowing on June 1st) in the 2001-2020 scenario.Cumulative values of NEE > 0 stand here for C moving from atmosphere into the ecosystem,and they were obtained as averages for the 20 years.The vertical dotted lines indicate the dates of the cycle start for the cover crop and the alternative mowing dates
Although some models of agroforestry systems including trees and grasses have been developed in the past (e.g.WalNulCAS,Van Noordwijk and Lusiana 1999;Hi-sAFE,Dupraz et al.2019),only two have specifically focused on orchards or vineyard agroecosystems under semiarid conditions.In this regard,WaLIS (Celette et al.2010) and WABOL (Abazi et al.2013) simulate the effects of different soil and cover crop management strategies on the water balance of vineyards and olive orchards,respectively.The latter provides a better mathematical representation of some of the processes according to their authors,while the former has been adapted and incorporated into a simple model of growth and development of olive trees (Moriondo et al.2019).In our work,a sophisticated process-based model of olive orchards (i.e.OliveCan,López-Bernal et al.2018) has been improved by introducing new model components that simulate the water use and growth of cover crops when present.The new version of OliveCan presents some advantages over WaLIS and WABOL,since it allows the user to quantitatively evaluate the impacts of cover crops on olive yield and NEE,apart from those linked to changes in the main water balance components.Besides,OliveCan accounts for the effect of tree shading on the strip,providing higher level of detail to the simulation of bothEccand biomass production by the cover crop (implicit in Eqs.(4 and 18)).
The formulation of the new cover crop model components generally followed simple approaches to prevent an excessive number of parameters,but many of the processes simulated rely on already validated and/or widely used methods.However,some of the parameters (e.g.those in Eq.(12) and the GDD thresholds) should require local calibration,given the high diversity in the botanical composition of cover crops used in olive orchards (Alcántara et al.2017).In this regard,further studies evaluating growth and developmenthabits of promising or usual cover crop species (like those by Alcántara et al.2011 or Gómez and Soriano 2020) may help in providing valuable information for calibration purposes.
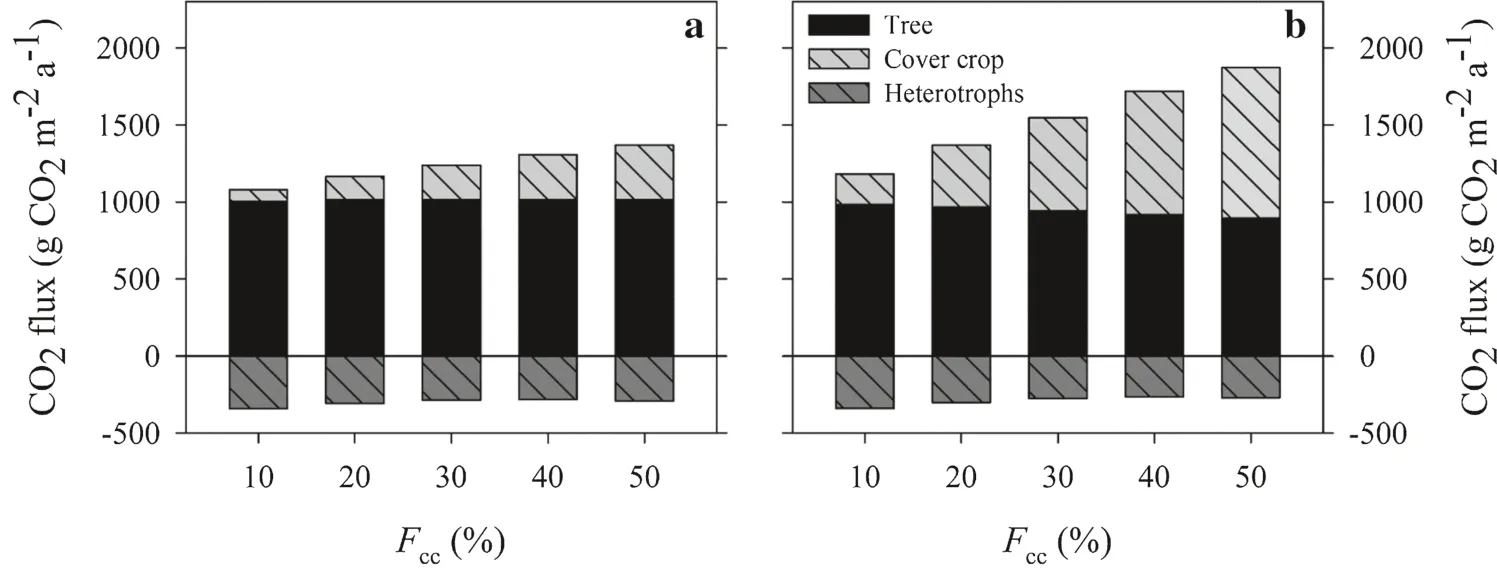
Fig.7 Average net CO2 fluxes for trees,cover crop and soil heterotrophs as a function of the width of the cover crop strip (Fcc =10%,20%,30%,40%,and 50%) and mowing date (a March 1st,b June 1st).Positive CO2 fluxes stand here for C moving from atmosphere into the ecosystem.Values are annual averages for the 2001-2020 scenario
Even if not parameterized for a specific cover crop species,the results of our in silico case study seem sound when compared with published experimental data for similar environmental and orchard management conditions.In this regard,mowing early in the spring is reported to lead to similarEtreeand yield to those under bare soil management (Abazi et al.2013;Alcántara et al.2017).This agrees with the fact thatFcchardly affected those variables in the simulations assuming mowing on March 1st (Figs.1 and 4).Under late mowing,the differences in total soil water content in late spring between the narrowest and widest strips were around 30-40 mm (Fig.3),which is close to the differences among cruciferous cover crops and bare soil that can be deduced from data collected in a 2-year experiment in the same site as our simulations (Alcántara et al.2011).In a meta-study on vineyards and olive orchards under cover crop soil management (Gómez et al.2011),runoffcoefficients ranged from 1.9% to 25% while our model estimates ranged from 3 to 15%,depending onFcc.Finally,we only found three studies determining CO2fluxes in olive orchards under cover crop soil management (Nardino et al.2013;Brilli et al.2016;Chamizo et al.2017).The three used the eddy covariance technique for at least one complete season and provide disparate values of NEP in the range from 513 to 4590 g CO2m-2a-1.Despite NEP was heavily influenced by the management alternative in our simulations,model estimates always remained within this interval (Table S3).On the other hand,the work by Chamizo et al.(2017) estimated NEP under bare soil management in a large separate plot within the same olive orchard.According to their findings,the use of a spontaneous cover crop mowed on late April practically doubled NEP as compared with the bare soil plot,which is similar to the differences observed between the narrowest and widest strips evaluated in our work for late mowing (Table S3).
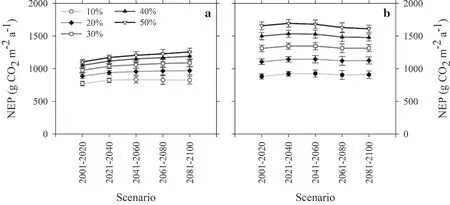
Fig.9 Variation in Net Ecosystem Productivity (NEP) for different temporal horizons within the twenty-f irst century.The two panels show results for early (a) and late (b) mowing and each series correspond to a different width of the cover crop strip (Fcc =10%,20%,30%,40%,and 50%).Error bars indicate standard error
Our simulation outputs reveal thatFccplays a big role in determining the impacts of the cover crop on the carbon and water balances of the orchard and its productivity,particularly when it is not controlled in early spring (Figs.2 and 4;Table S3).Even if such result was somehow expected,this is the frist work providing quantitative evidence,as no previous study has evaluated the impact of this factor,to the best of our knowledge.Another interesting finding was the poor correlation between oil yield and either cumulative rainfall or total soil water content on March 1st (Fig.5).This implies that it is difficult to establish robust in-season recommendations for the control date of the cover crop based only on those variables.This result stems from the perennial nature of olive trees and their alternate bearing habits (which is considered by OliveCan).Hence,even if the soil water content of a given year is very high on March,a low fruit load (offyear,depending on previous year fruiting conditions) would set a limit to potential yield.On the other hand,oil yield also depends on the water status of the orchard at the time of flowering and throughout the fruit growth period,and this is only poorly represented from information on the cumulative rainfall or total soil water content on March 1st.
Uncertainty is almost unavoidable when using crop models in climate change studies due to the input data used and the set of assumptions adopted in the modelling approach,and the in-silico analysis presented in this work is not different in that respect (Mairech et al.2021).In our future scenarios,climate change only modif ies the environment by increasing air temperature,CO2concentration (both according to RCP8.5) and vapor pressure.Model runs showed a trend for olive yield to decrease throughout the twenty-f irst century,particularly during its second half.The relative reductions for 2081-2100 were generally similar in magnitude to those reported by Mairech et al.(2021) for traditional rainfed orchards under bare soil management on southern Spain.In any case,yield decreases in this work were not originated by lack of fulf ilment of chilling requirements for flowering and sterile years,as it has been the case in other simulation studies (Morales et al.2016;Lorite et al.2022).Regarding management alternatives,late mowing and highFccalso resulted in the lowest yield under future scenarios.Interestingly,early mowing led to yields being irresponsive toFcc,as it was the case in the present scenario (Fig.S5).This suggests that,when controlled early in spring,the use of cover crops might still be as viable as traditional bare soil management even in the (near) future,which is in accordance with Gómez et al.(2014a,b).
Conclusions
This works presents an improved version of OliveCan that simulates the main effects of cover crops on water use,carbon exchange and yields at the orchard level under different management strategies.The model allows the user to quantitatively estimate management effects on yield and on some of the variables related to the provision of ecosystem services by the cover crop (e.g.runoff,NEP),simultaneously.Therefore,OliveCan is suitable for identifying best management practices conciliating productive and environmental objectives,which may have practical applications for developing policies or decision support systems in the future.The in silico experiment presented in this study indicate thatFccheavily influences the impacts of the cover crop on the water and carbon balances of the orchard and olive yield when it is not controlled until late in spring.It must be noted that these results were obtained for a traditional rainfed orchard in a specific soil and site in southern Spain and so that they may vary for contrasting environmental conditions or orchard typologies to those considered in the simulations.The model,in any case,has the potential to evaluate cover crop management strategies under different climatic,soil and orchard scenarios.
 Journal of Forestry Research2023年1期
- Journal of Forestry Research的其它文章
- Journal of Forestry Research
- Tree ecophysiology in the context of climate change
- Leaf thermal tolerance and sensitivity of temperate tree species are correlated with leaf physiological and functional drought resistance traits
- Near-infrared leaf reflectance modeling of Annona emarginata seedlings for early detection of variations in nitrogen concentration
- Light intensity and hydrogel soil amendment differentially affect growth and photosynthesis of successional tree species
- A soil quality index for subtropical sandy soils under different Eucalyptus harvest residue managements
