Near-infrared leaf reflectance modeling of Annona emarginata seedlings for early detection of variations in nitrogen concentration
Rafaela Lanças Gomes·Marília Caixeta Sousa·Felipe Girotto Campos·Carmen Sílvia Fernandes Boaro·José Raimundo de Souza Passos·Gisela Ferreira
Abstract Nitrogen (N) monitoring is essential in nurseries to ensure the production of high-quality seedlings.Nearinfrared spectroscopy (NIRS) is an instantaneous,nondestructive method to monitor N.Spectral data such as NIRS can also provide the basis for developing a new vegetation spectral index (VSI).Here,we evaluated whether NIRS combined with statistical modeling can accurately detect early variations in N concentration in leaves of young plants of Annona emarginata and developed a new VSI for this task.Plants were grown in a hydroponics system with 0,2.75,5.5 or 11 mM N for 45 days.Then we measured gas exchange,chlorophyll a fluorescence,and pigments in leaves;analyzed complete leaf nutrients,and recorded spectral data for leaves at 966 to 1685 nm using NIRS.With a statistical learning approach,the dimensionality of the spectral data was reduced,then models were generated using two classes (N def iciency,N) or four classes (0,2.75,5.5,11 mM N).The best combination of techniques for dimensionality reduction and classification,respectively,was stepwise regression (PROC STEPDISC) and linear discriminant function.It was possible to detect N def iciency in seedlings leaves with 100% precision,and the four N concentrations with 93.55% accuracy before photosynthetic damage to the plant occurred.Thereby,NIRS combined with statistical modeling of multidimensional data is effective for detecting N variations in seedlings leaves of A.emarginata.
Keywords Mineral nutrition of plants·Nearinfrared spectroscopy·Spectral vegetation index·Digital signature·Statistical learning·Fluorescence of chlorophyll a
Introduction
Annona emarginata(Schltdl.) H.Rainer is a non-domesticated tree species that is distributed from northeastern to southern Brazil (Maas et al.2015) and considered to be in a vulnerable state,according to the Rio Grande do Sul red list of flora (CONSEMA 2002).Greenhouse-produced seedlings are important for the reforestation and recovery of degraded areas (Tokunaga 2005),and the rootstock is used for Annonaceae fruit such as atemoya.
In the global context of climate change,the tropics are highly prone to changes in rainfall and temperature regimes (Walsh et al.2015),and to increases in atmospheric CO2.These changes affect plant metabolism such as respiration (Ryan 1991) and the balance of some nutrients and elements such as N (Rennenberg et al.2009),which is a critical constituent of amino acids,nucleic acids (Souza and Fernandes 2006),proteins such as ribulose-1,5-bisphosphate carboxylase/oxygenase (RuBisCO) (Lawlor et al.1989),and other metabolites (Mur et al.2016).Monitoring the concentration of plant nutrients in field situations and in nurseries is thus important.
Because N is a structural element,a deficiency or excess of N in plants can lead to metabolic disorders and often visible symptoms.These metabolic disorders can be assessed initially at the molecular level (Nunes-Nesi et al.2010).With longer durations of N def iciency,damage to the photosystem occurs,and these disorders become noticeable at the photochemical level (Chen et al.2015).Eventually,the carboxylation phase of RuBisCO activity and its regeneration and efficiency are compromised (Campos et al.2019),and the damage to the plant becomes visible as reduced growth,chlorosis and leaf necrosis.Nitrogen (N) therefore needs to be supplied before any visual signs appear,that is,before plant metabolism is entirely and irreversibly compromised and the effects of the def iciency can still be reversed.Thus,N def iciency needs to be detected as early as possible.
A technique to rapidly and nondestructively measure leaf N concentrations in nurseries will help ensure that highquality seedlings are produced at lower cost.Concentrations can be directly determined by destructive,time-consuming chemical analysis or indirectly using nondestructive nearinfrared spectroscopy (NIRS),which is nearly instantaneous.NIRS relates to the binding nature of the molecules in a sample.Thus,based on the leaves spectral characterization,the molecular composition can be determined (Fonseca et al.2002).Because the technique not only quantif ies the amount of N in the leaves,but is also sensitive to the physiological changes caused by the N def iciency,N def iciency can be identif ied before any signs of a def iciency are visible.The goodness of fit of the model,however,must be verif ied by comparing the acquired ref lectance patterns in a target to an established pattern (Otto 1999).
NIRS has been used to quantify N and other elements and compounds in leaves of different species.Hattey et al.(1994) used NIRS to analyze the N and starch content in cotton leaves that were collected over 3 years to improve the equation bias and coefficient of determination.Among nutritional elements in leaves of different citrus tree species,Galvez-Sola et al.(2015) found that NIRS was most prof icient at estimating N content.Using leaves ofPopulusspecies,Fernández-Martinez et al.(2017) was able to predict N content,discriminate carbon isotopes,and evaluate chloroplast pigments and antioxidants with excellent accuracy,above 80%.
In the situations just described,NIRS provides an indirect measure of the N content.Depending on the device used,wavelength bands can be obtained that are correlated with molecules that contain N (e.g.,proteins) and with molecules that are related to physiological reactions that result from a lack of N (e.g.,starch) or an excess (e.g.,alkaloids) (Jensen 2002).Among the bonds of molecules that reflect in the NIR,N-H is one of them (Curran 1989).
Small changes in sample preparation and other environmental factors can have a significant impact on the spectral characterization of a target (Siesler et al.2001);thus,the technique will require specific modifications or calibrations for each application.Therefore,in this work,we propose statistical learning method to classify the spectral data related to each treatment and thus validate the results instead of the common method of constructing a calibration curve with a direct correlation between the amount of N present and its reflectance.Thus,we can decide the model specification by the number of N concentration classes,allowing for small changes in the samples to be mitigated.With this,if it is not possible to identify all classes,such as several different concentrations of N,then at least more general classes can be identif ied such as N def iciency versus N.
As a consequence of this modeling,it is possible to propose a group of vegetation spectral indices (VSI).These are combinations of specific wavelengths that are related to plant parameters we want to measure.In general,the best-known VSI used to measure N are formed by wavelengths in the visible spectrum and correlated with the visual signs (symptoms) that result from a long exposure to different concentrations of N in plants.
In the present work,we assessed whether NIRS in combination with statistical modeling can be used for the early detection of variations in the N concentrations in leaves of seedlings ofA.emarginata.We also propose an index based on near-infrared wavelengths that can be used to detect metabolic changes that results from N def iciency but are not yet visually identif iable,that is,before damage becomes irreversible.
Materials and methods
Experiments and data collection
The experiment was done in a paddy-fan greenhouse of the Department of Biostatistics,Plant Biology,Parasitology and Zoology,at the Institute of Biosciences of UNESP,on the Botucatu (state of São Paulo) campus.Seedlings ofAnnona emarginatavariety (Schltdl.) H.Rainer Terra-fria (Araticum-de-terra-fria),from the Seed Production Center of São Bento do Sapucaí,from CATI (Coordination of Technical and Integrated Assistance) in São Bento do Sapucaí,state of São Paulo,were grown in the greenhouse without any temperature control in a hydroponic system in pots with approximately 1.5 L of Hoagland and Arnon (1950) no.2 nutrient solution,with 50% ionic strength,which is the recommended concentration for the species (Baron et al.2013;Campos et al.2019).After acclimatizing for 15 days,Hoagland and Arnon no.2 nutrient solution (1950) at 50% concentration was used as the basis for supplying the following concentrations of N treatments,0 mM N and 2.75 mM N (def iciency classes),5.5 mM N (control class),and 11 mM N (excess class) for 45 days (Table 1).We used two classes of N def iciency and only one excess because def iciencies are more common than an excess in forest seedling nurseries.The nutrient solutions were constantly airy with blowers and changed every 2 weeks (Baron et al.2013).The pH (from 5 to 6) and the electrical conductivity (from 0.9 to 1.30 mS cm-1) were also measured daily using a handheld pH meter pHep HI98107 (Hanna,Vöhringin,Germany) and a double measuring scale portable conductivity meter ATC CD-310 (PHTEK,Curitiba,Brazil).When needed,the pH was readjusted to the desired range using 1 M NaOH solution and HCl.
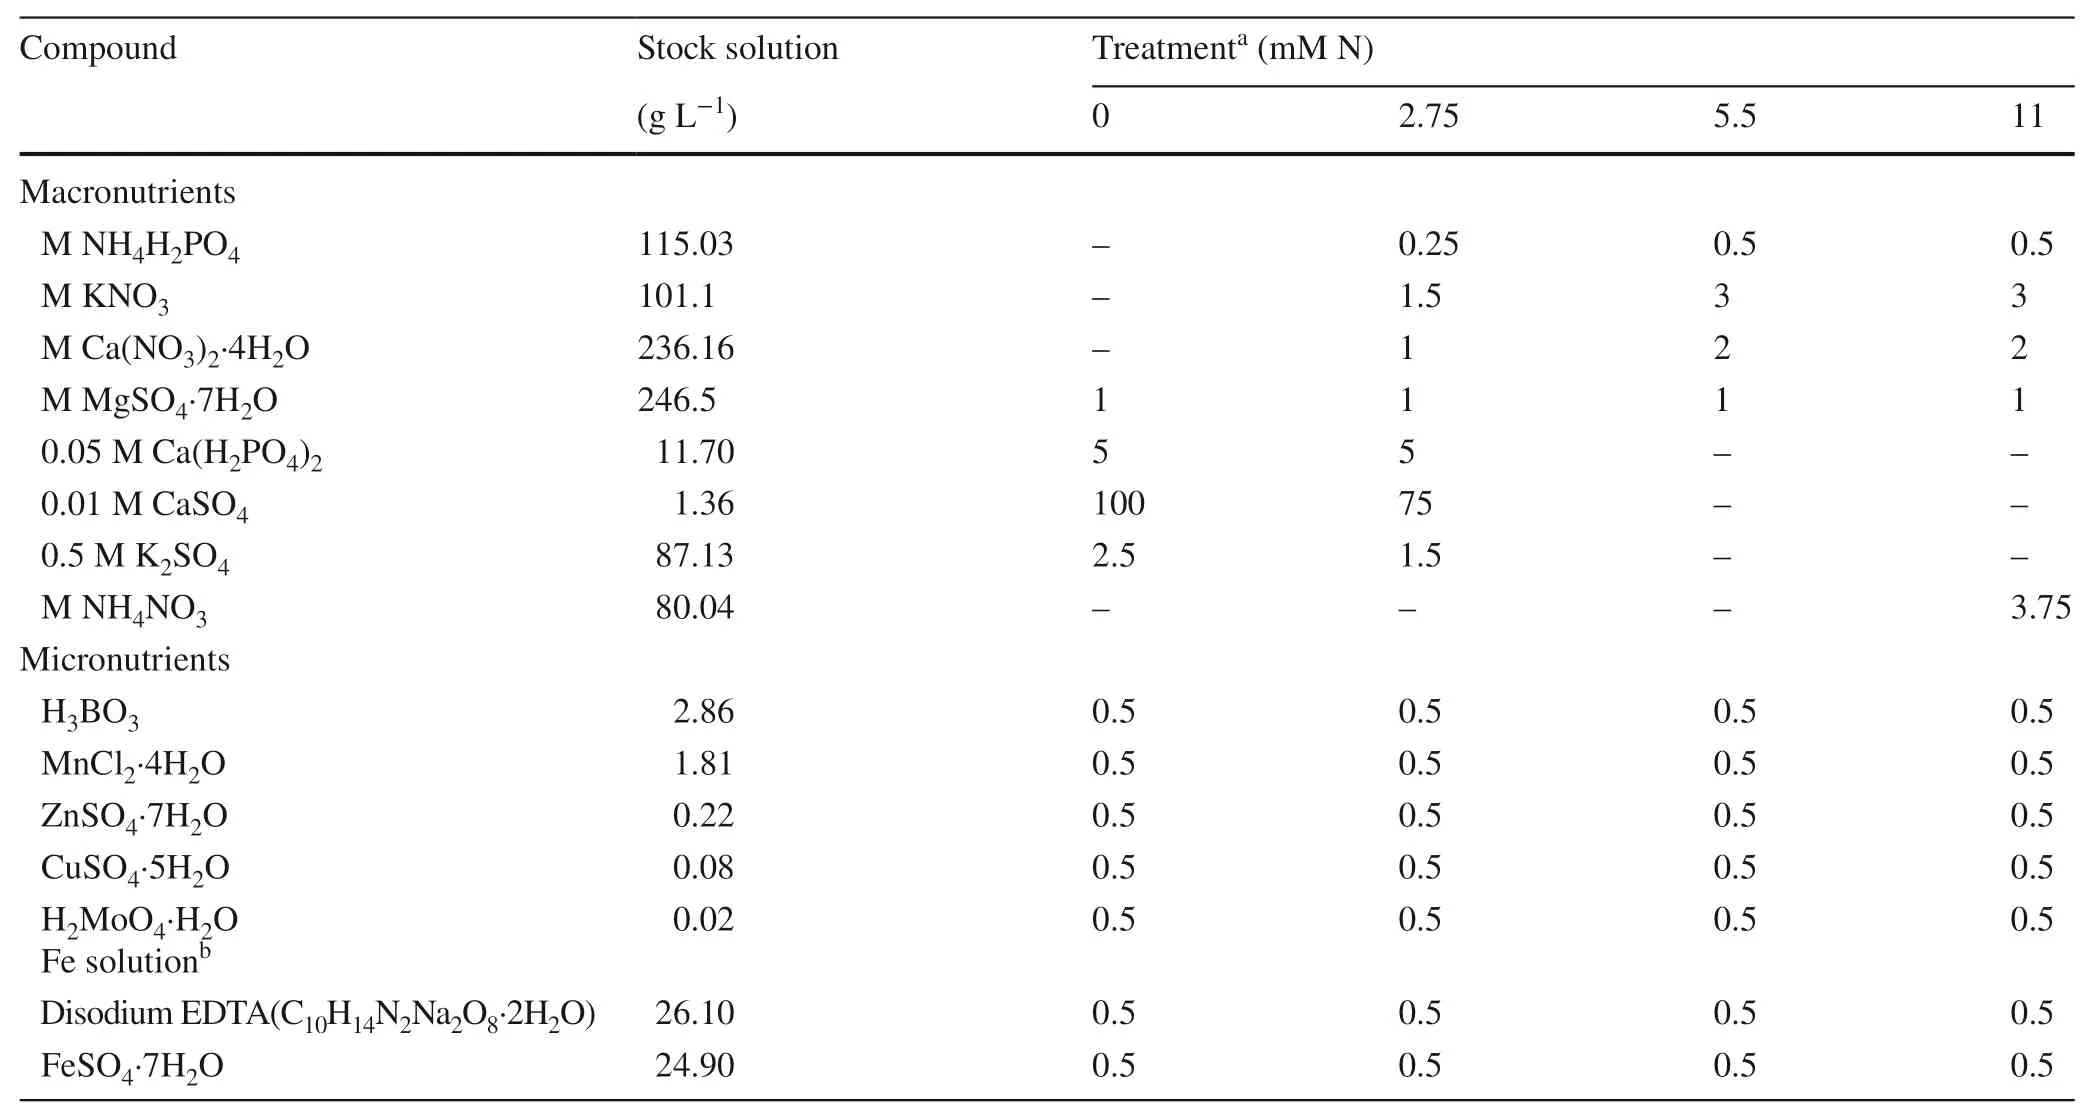
Table 1 Treatment solutions (N concentrations:0,2.75,5.5,and 11 mM) with nutrient solution no.2 of Hoagland and Arnon (1950),diluted to 50% ionic strength,with different nitrogen concentrations for hydroponically grown A.emarginata seedlings
The experimental design was entirely randomized.Each treatment was applied to 60 seedlings,totaling 240.From these seedlings,physiological analyses (gas exchange,chlorophyllafluorescence,leaf pigments,and complete leaf nutrient analysis) and spectral characterization of the leaves (NIRS) were performed.
Throughout the experiment,chlorophyllafluorescence and gas exchange were measured with a portable gas exchange and fluorometer system (model GSF 3000 Fl,Walz,Effeltrich,Germany) coupled with a fluorometer (LED-Array/PAM-Fluorometer 3055-FL,Walz).Fully expanded leaves and light fixed at 1200 μmol m-2s-1were used.Four evaluations were made over time,starting with the application of treatments,and then repeating every 15 days.Five repetitions were made per treatment,and the considered sample unit was the plant.
The chlorophyllafluorescence variables were effective quantum energy (ΦPSII);potential quantum energy (Fv'/Fm');photochemical quenching (qP);electron transport rate (ETR);energy dissipated in the form of heat by the antennas (D);and photochemical energy not dissipated and not used in the photochemical phase (Ex) (Demmig-Adams et al.1996).
The evaluated gas exchange variables were CO2assimilation rate (A);evapotranspiration rate (E);stomatal conductance (Gs) ;and internal CO2concentration in leaf (Ci) .From these measures,water-use efficiency (WUE) was calculated based on the relationship between CO2assimilation and transpiration rate and the instant carboxylation efficiency of ribulose 1,5-diphosphate carboxylase (RuBisCO) (A/Ci,i.e.,ratio of CO2assimilation and internal CO2concentration in the leaf) (Zhang et al.2001).
After the seedlings had been in the N solutions for 45 days,three mature leaves were randomly removed from the median part of the stem of each of the 240 plants (Lima et al.2007) for spectral characterization.Flame-NIR spectrometer (Ocean Optics (now Ocean Insight),Orlando,FL,USA) was used in the range of 966.03 to1685.09 nm,with a sensitivity of 5.51 nm.For each leaf,five scans were made and averaged,with an integration time of 9.1 ms.The light was calibrated using the white pattern from Ocean Optics for the maximum and minimal light in the environment.
For each treatment,N was quantif ied in the leaves using the leaf tissue analysis method at the soil analysis laboratory of the Department of Forest Science,Soils and Environment FCA/UNESP,in Botucatu,state of São Paulo.Four replicates,each comprising 2 g of dry mass of leaves from a pool of 15 randomly selected seedlings were used for each N concentration.
Chlorophyllaandb,carotenoids,and anthocyanins were extracted from leaves and quantif ied using the acetone-TRIS method,with four replicates,each comprising a pool of three seedling leaves selected at random.Three absorbance readings each were recorded at 470,537,647,and 663 nm for the respective pigments above using a Bel UV-M51 UV-Visible spectrophotometer (Bel Engineering,Monza,Italy) as described by Sims and Gamon (2002).
Statistical modeling
Physiological variables
Generalized linear models with gamma distribution and logarithmic link function were fitted for each physiological variable of each analysis (gas exchange,chlorophyllafluorescence,leaf pigments,and complete leaf analysis),considering the treatments as factors.The fitting quality of these models was initially analyzed using the deviations by degrees of freedom and,subsequently,by the standardized Pearson residual graphics (Nelder and Wedderburn 1972).Differences among treatments were compared using the Tukey-Kramer test (Westfall et al.1999) and the GENMOD procedure in SAS (University Edition;SAS Institute,Cary,NC,USA).
Leaf reflectance
The leaf reflectance data (NIRS) for three sampled leaves were averaged.
To verify the best combination of dimensionality reduction and classification techniques,we used the bootstrap simulation technique (Efron 1979).The entire data set (240 plants) was resampled randomly in two parts:70% for modeling and the remaining 30% for validation.This procedure was repeated 1000 times using the PROC SURVEY SELECT algorithm in Statistical Analysis System.
To facilitate the modeling,we reduced the dimensionality of the reflectance data using three techniques:principal component analysis (PCA) (Johnson and Wichern 2014),stepwise methodology (PROC STEPDISC procedure in SAS),and logistic regression,which was executed in two ways,considering either the binomial or multinomial response variables.
For variables with a binary response (N deficiency:0 mM N and 2.75 mM N;N:5.5 mM N and 11 mM N),generalized linear models with binomial distribution and logit link function were fitted.For variables with a multinomial response (N concentration treatments),generalized linear models with multinomial distribution and glogite binding function were fitted.For both logistic regression modelings,the PROC LOGISTIC procedure in SAS was used.
Subsequently,the model (classification) was validated using Fisher’s discriminant linear (LDF) and quadratic (QDF) function techniques (Johnson and Wichern 2014).For the classification either four classes (N concentrations) or two classes (N def iciency,N) were considered.
This approach can be considered as an artificial intelligence technique in the statistical learning category.This is a supervised method that learns from a subset of the data set (70%) and posteriorly is capable of classifying other samples of the data set,which were not used in the modeling (30%).In this way,the nutritional status of the seedlings in the production system can be predicted.
Binomial selection:reduction technique and rating technique
We can decide which combination of dimensionality reduction and classification techniques to use in two different ways.Most commonly,the correctness percentage of the classification technique is evaluated.We can also evaluate the efficiency of combining the reduction technique with the classification technique,which is def ined as the ratio of the correctness percentage of the classification technique to the number of wavelengths selected by the technique of reduction of dimensionality.Thus,methods that select fewer wavelengths and obtain high percentages of accuracy are more efficient than methods that select a large number of wavelengths and obtain equally high percentages of accuracy.
Vegetation spectral indices
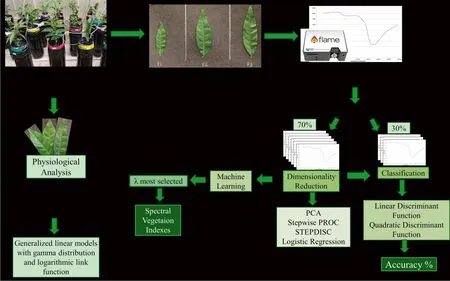
Fig.1 Summary of the methodology used for this study
From preliminary dimensionality reduction tests using machine-learning techniques,considering four and two classes,four wavelengths were selected.The reduction algorithms used were the Correlation-based Feature Selection (CFS),Wrapper,and Classif ier Subset Evaluator (CSE) in the software Weka (Waikato Environment for Knowledge Analysis;University of Waikato,Hamilton,New Zealand).
Based on the two by two combination of the selected wavelengths,spectral indices of vegetation (VSI) were suggested.Their formation was based on the architecture of the main VSI that are present in the literature used to ascertain N:(1) division of one wavelength by the other,such as pigment specific simple ratio (PSSR;Blackburn 1998),simple ratio (SR;Birth and McVey 1968),and blue/green index (BIG2;Zarco-Tejada et al.2005);(2) division of the sum of two wavelengths by the difference between the two wavelengths,such as the photochemical reflection index (PRI;Gamon et al.1992),normalized difference vegetation index (NDVI;Rouse et al.1974),and pigment-specific normalized difference (PSND;Blackburn 1998).We also generated indices by the dividing the difference between the two wavelengths by their sum.
After generating the indices,the most representative indices were selected using the SAS PROC STEP DISC selection procedure and the multinomial logistic regression.They were then tested in the classification with discriminant linear function and discriminant quadratic function.
Figure 1 summarizes the methodology used in this paper.
Results
Leaf reflectance
In relation to the average leaf reflectance curves for each treatment (Fig.2) and all samples,seedlings cultivated with 0 mM N (red) and 2.75 mM N (orange) grouped in a curve below,and those cultivated with 5.5 mM (blue) and 11 mM of N (green) are grouped in a curve above.In Fig.3,the reflectance boxplots for each N concentration show the data variability.Figures 4 and 5 show the boxplots for the 128 response variables (wavelengths) for the modeling and validation data set considering the classification into four classes and two classes,respectively.
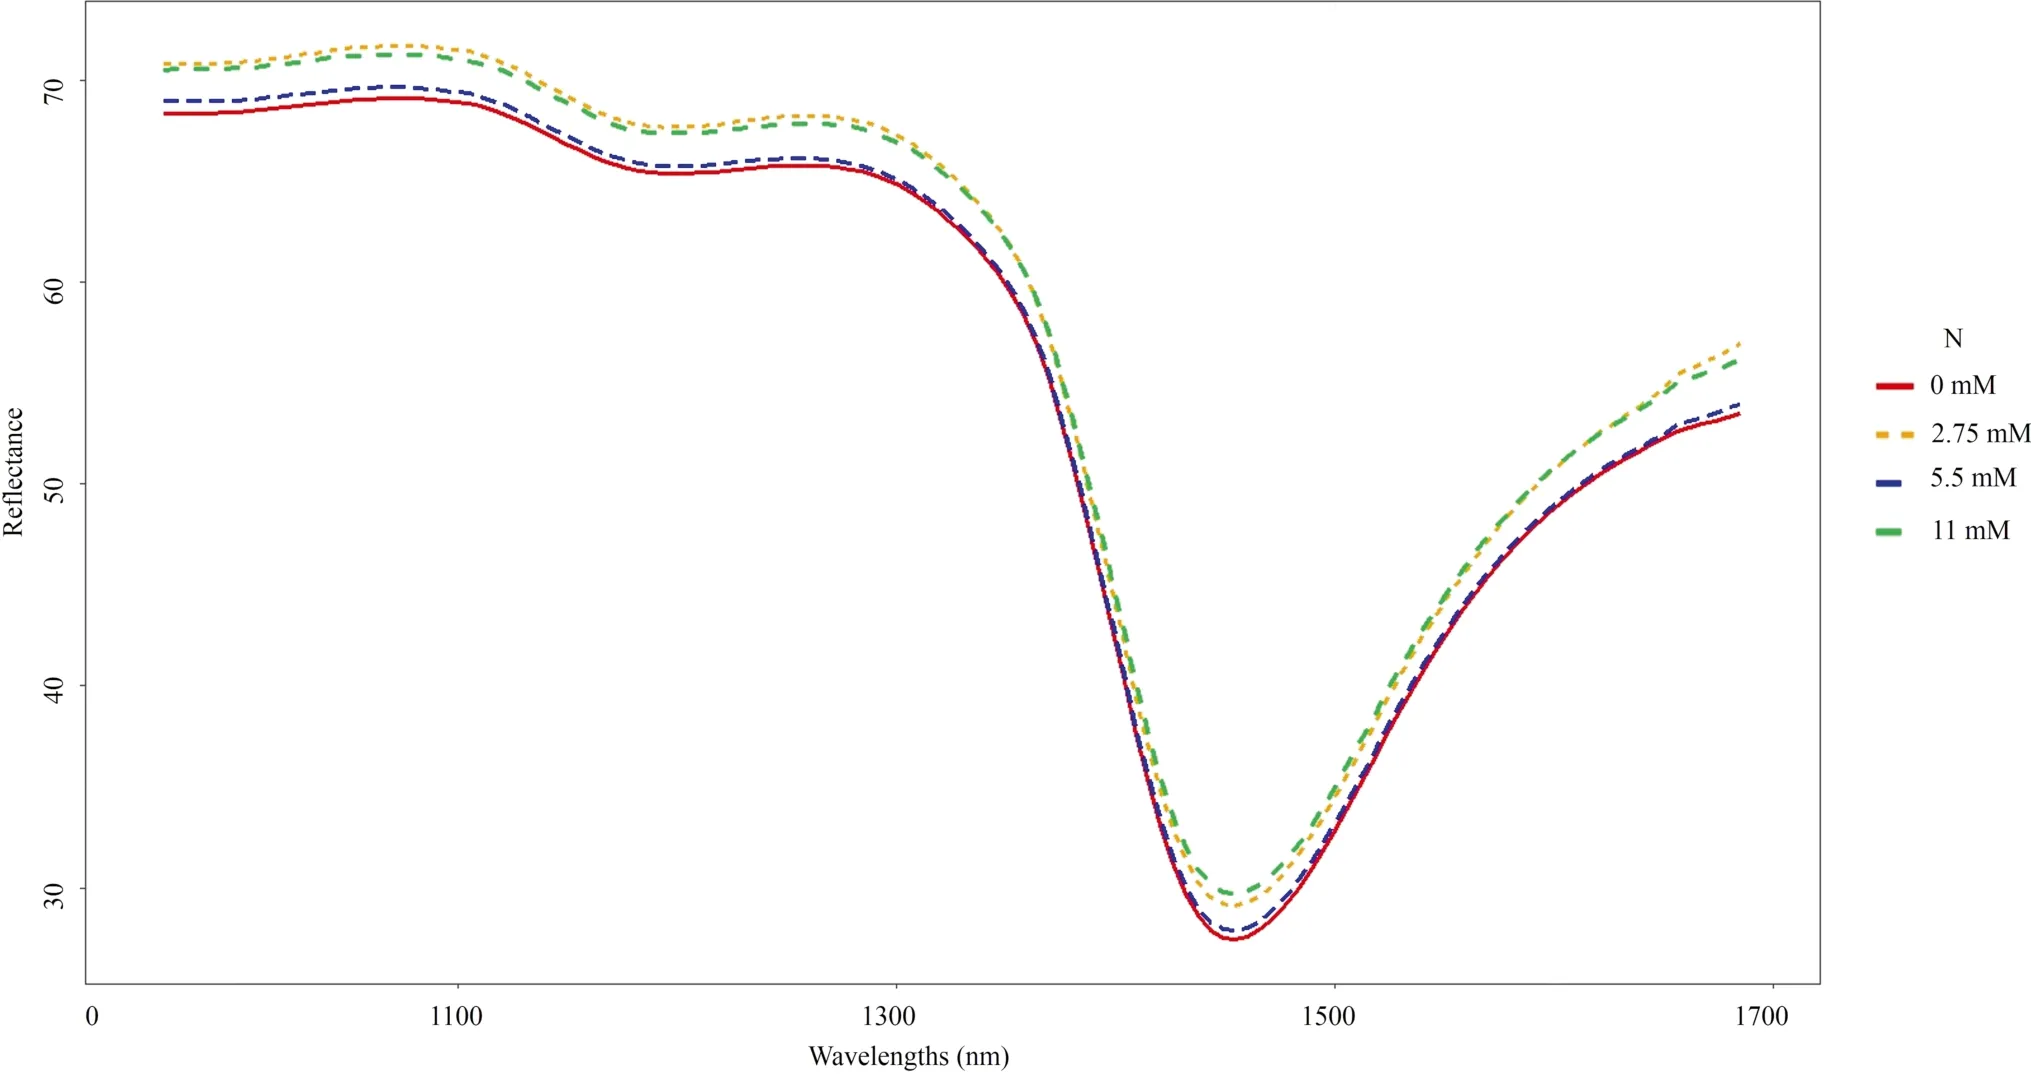
Fig.2 Average leaf reflectance curves from Annona emarginata cultivated in different nitrogen concentrations (0 to 11 mM,n =60)
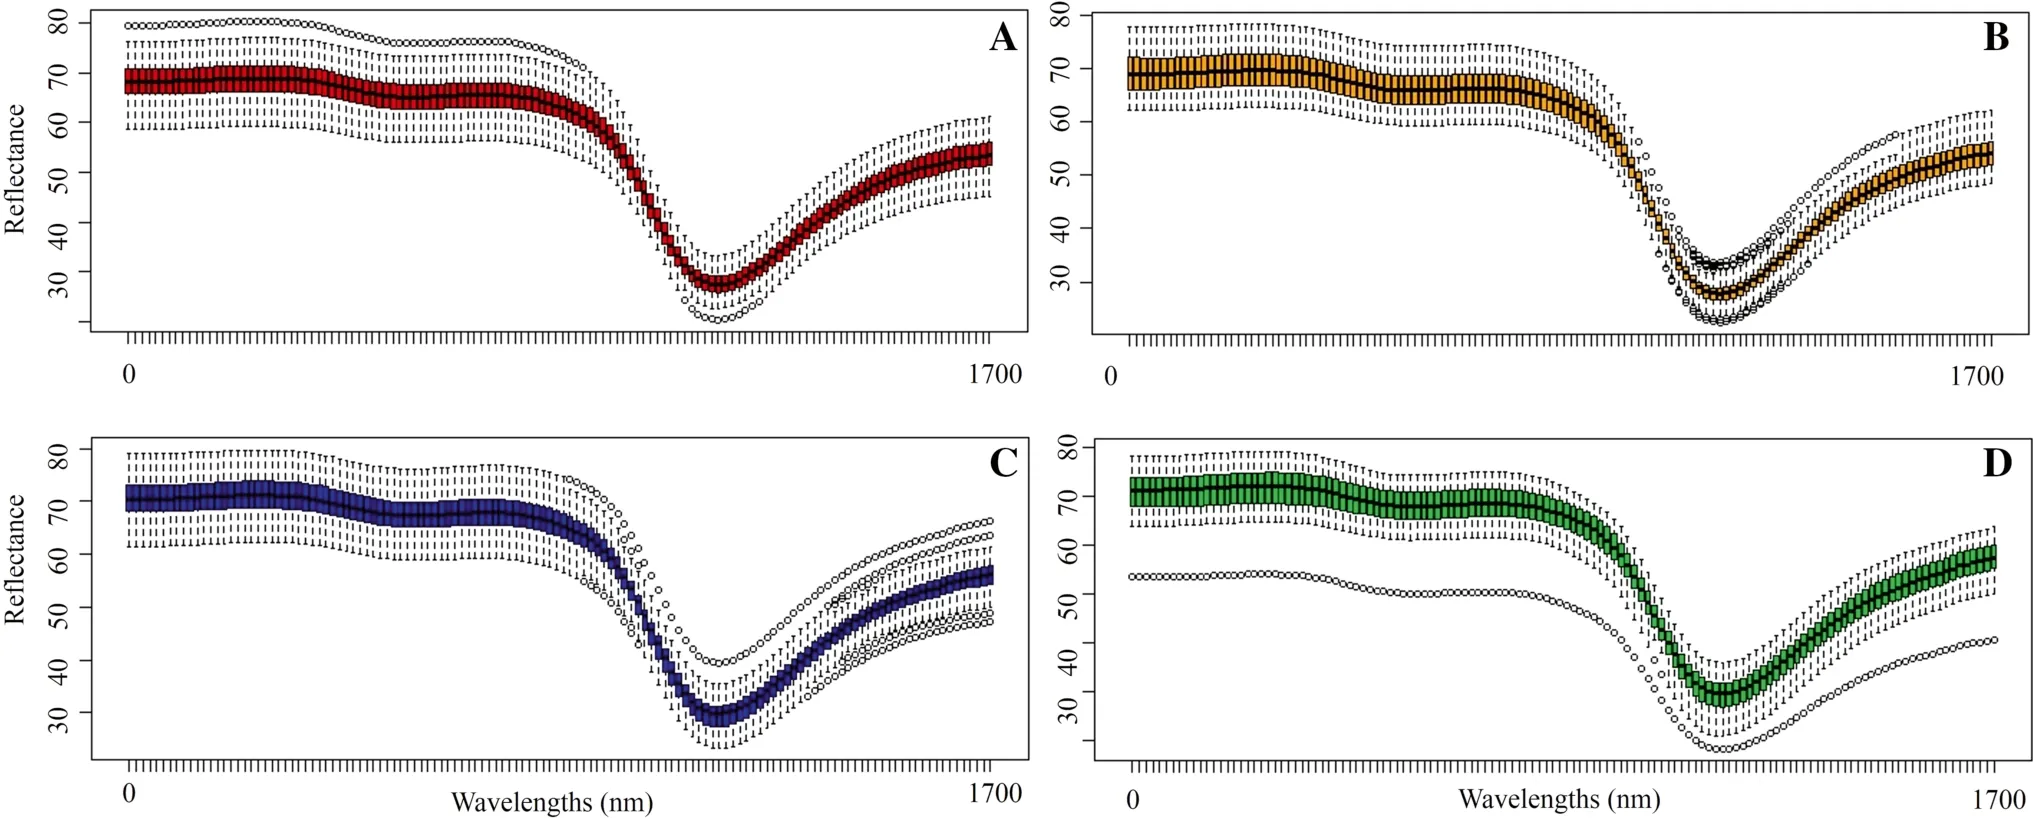
Fig.3 Reflectance boxplots (%) for Annona emarginata leaves cultivated in different nitrogen concentrations (n=60).A,B,C,and D represents 0,2.75,5.5 and 11 mM of N,respectively
Dimensionality reduction
Different sets of wavelengths were selected for classification into either four or two classes of N concentration.The technique that selected a greater number of wavelengths (nm) was proc step disc stepwise (Tables 2,3).The principal component technique reduced the data to two self-vectors composed of a linear combination of all wavelengths,accumulating 91.7% of the data variability for classification in four classes and 91.9% for classification in two classes.
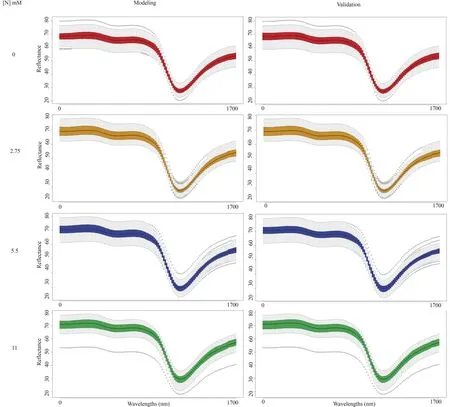
Fig.4 Boxplots of 128 response variables (wavelengths) for the modeling and validation data sets (from 1000 bootstrap resamplings) considering the classification into four classes (0,2.75,5.5 and 11 mM of N)
Table 2 shows that proc step disc stepwise selected 58 wavelengths to classify them into four classes,and logistic regression selected 16 wavelengths.Finally,11 wavelengths were selected by both techniques.For the classif ciation in two classes (Table 3),proc step disc stepwise selected 66 wavelengths and the logistic regression selected five wavelengths.Among these,four wavelengths were common on both classes.
Ranking
Observing the average hit percentages and standard error for the classification in two and four classes (Table 4),we noticed that the reduction by main components presented the worst-hit percentages in association with the discriminant linear function and with the discriminant quadratic function.The combination of reduction by PROC STEP DISC stepwise with classification by linear discriminant function had the highest correctness percentage for classification in four classes and two classes.

Table 2 Wavelengths selected by different dimensionality reduction techniques for rating young A.emarginata plants,based on leaf spectral characterization in four classes (0,2.75,5.5 and 11 mM of N)

Table 3 Wavelengths (nm) selected by different dimensionality reduction techniques for rating young A.emarginata plants,based on leaf spectral characterization in two classes (lacking N:0,2.75 mM of N;with N:5.5,11 mM of N)

Table 4 Average accuracy percentage for rating in two classes (N lack:0,2.75 mM of N;with N:5.5,11 mM of N) and four classes (0,2.75,5.5 and 11 mM of N) and standard error (in parentheses) of the spectral data from leaves of young A.emarginata plants for the different wavelengths sets selected by the different dimensionality reduction techniques LDF linear discriminant function,QDF quadratic discriminant function.Resulting from 1000 bootstrap resamplings

Table 5 Average accuracy percentage of the rating in four classes (0,2.75,5.5 and 11 mM of N) and standard error (in parentheses) for the selected indices by the different dimensionality reduction techniques
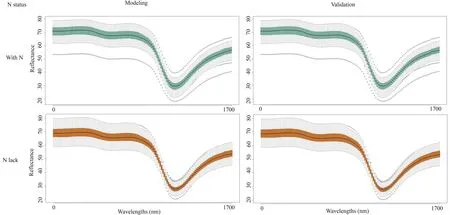
Fig.5 Boxplots of 128 response variables (wavelengths) for the modeling and validation data sets (from 1000 bootstrap resamplings) considering the classification into two classes (N lack:0,2.75 mM N;with N:5.5,11 mM N)
Vegetation spectral indices
The selected wavelengths were 1685 nm (R1685),1679 nm (R1679),1673 nm (R1673),and 1638 nm (R1638).From these,24 indices were formed:

The proc step disc stepwise technique selected six indices,I1,I5,I9,I13,I23,andI24,and the logistic regression technique selected four indices,I1,I13,I23,andI24.Table 5 shows the correctness percentages in the classification using the selected index sets as input variables.

Table 6 Average (+SE) potential quantum energy (Fv'/Fm'),energy dissipation in the form of heat by the antennas (D),and photochemical energy not dissipated and not used in the photochemical phase (Ex) of Annona emarginata seedlings at 45 days after start of treatments (0,2.75,5.5 and 11 mM of N) Averages followed by the same letter in a column did not differ significantly in a Tukey-Kramer test (P > 0.05,n =5)
As for the classifications for the selected index sets,the percentages of correct answers were homogeneous.As the difference in the correctness percentages is small,it is better to use the set of indices selected by logistic regression,which is smaller than the set selected bystep discusing any of the classification techniques.The wavelength of 1679 nm appears in three of the four selected indices,making it the prevalent in the chosen indices.
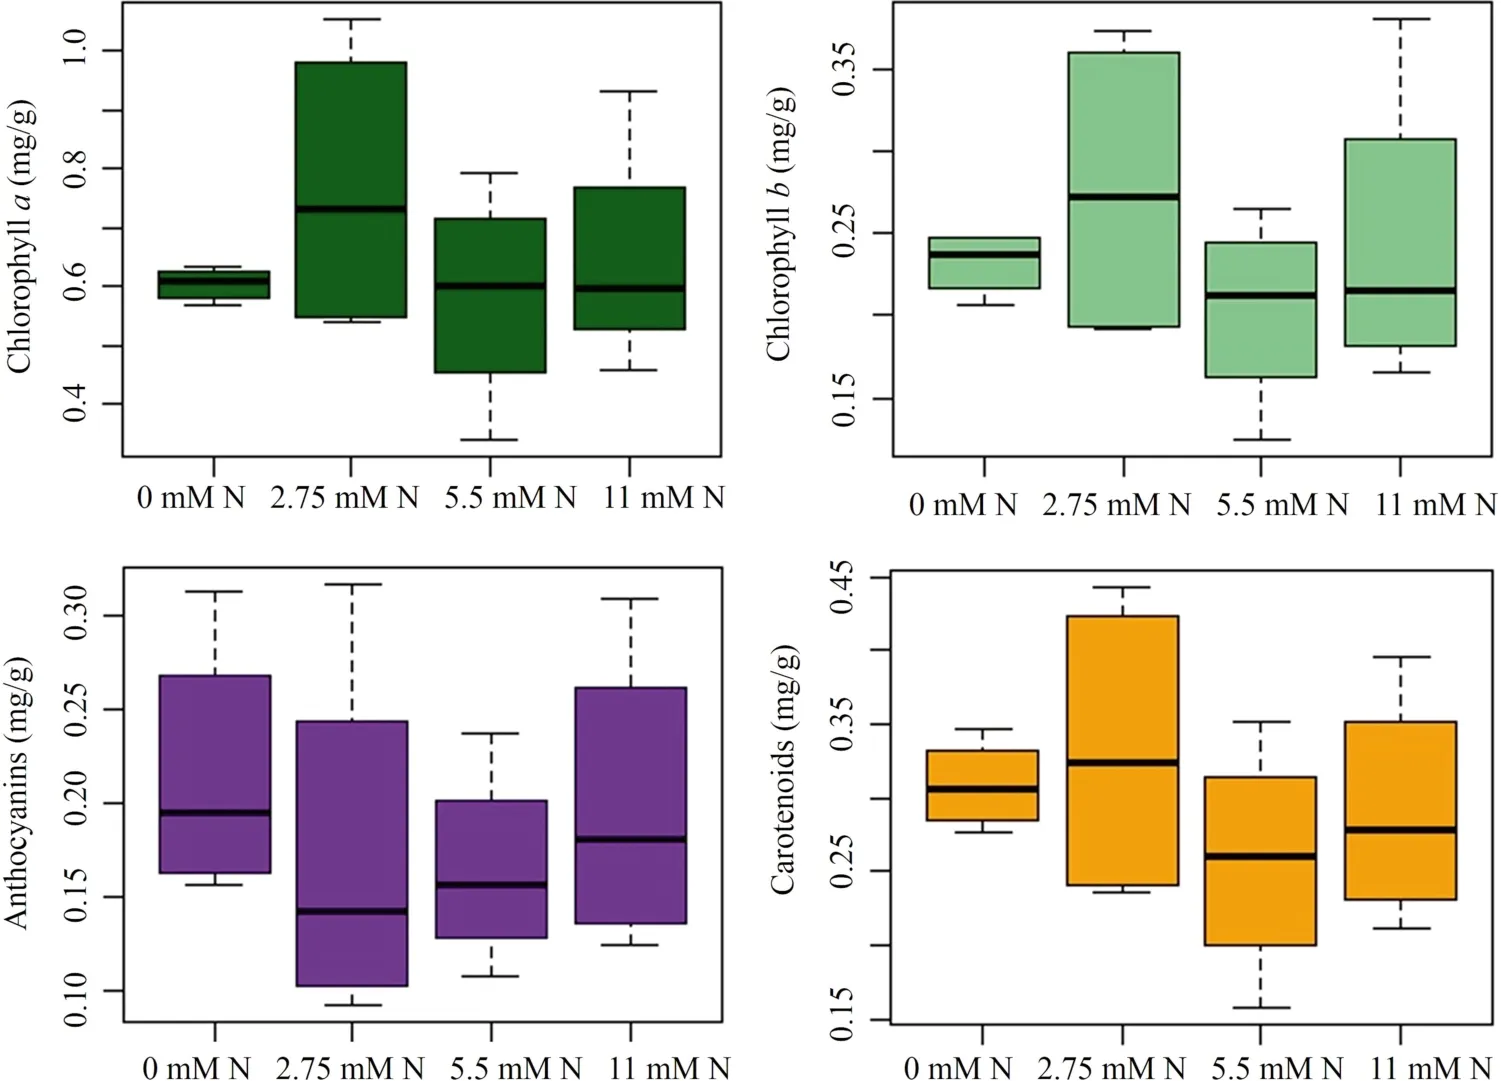
Fig.6 Boxplots of chlorophyll a,chlorophyll b,anthocyanins and carotenoids concentrations (mg/g fresh leaf tissue) in leaves of plants grown with 0,2.75,5.5 or 11 mM of N
Physiological analyses
As for the physiological analyses,the adjustment of the models was adequate,since the value of the deviations by degrees of freedom remained close to 1 and the analysis of the standardized Pearson residues showed the random residue around zero and fluctuating mostly between -2 and+2 (Nelder and Wedderburn 1972).
As for the gas exchange and fluorescence variables of chlorophylla,for transpiration (E),stomatal conductance (Gs),carbon assimilation (A),internal carbon (Ci),water-use efficiency (WUE),instantaneous efficiency of RuBisCO (A/Ci),effective quantum energy (ΦPSII),electron transport rate (ETR),and photochemical quenching (qP),there was no statistically significant difference detected by the generalized linear models among treatments in any of the analyzed moments (Tables S1 and S2).
For potential quantum energy (Fv'/Fm'),energy dissipation in the form of heat by the antennas (D),and photochemical energy not dissipated and not used in the photochemical phase (Ex),a statistically significant difference was observed (P< 0.05) among the N concentrations 45 days after the start of the treatments (time of leaf collection:time 4).According to the Tukey-Kramer test,the seedlings grown without N had greater heat dissipation (D) and lower ExandFv’/Fm’ when compared to the other treatments (Table 6).
The complete leaf analysis (Table S3) showed a difference in the concentrations of N in the leaves.Also,the plants in the solution without N had significantly less N in comparison with those in other treatments (Tukey-Kramer test,P< 0.05).For calcium,lower averages were found in seedlings in treatments that lacked N (0 and 2.75 mM of N).
For leaf pigments,there was no statistical difference for any of the variables tested according to the generalized linear models (P> 0.05;Fig.6).
Discussion
Statistical modeling
For high-dimensional multivariate sets,such as those for spectral data,dimensionality reduction is an alternative widely used to facilitate model adjustment.With a reduction in size,the classification technique is expected to become more efficient,due to the removal of redundant or nonexplanatory information.Wang et al.(2018) used selected spectral bands as input variables that corresponded to the desired chlorophyll and carotenoid information and thus increased the predictive power of their classification techniques to identify different concentrations of N in tea leaves.
The PCA is one of the best-known and most-used dimensional reduction techniques.However,its association with LDF and QDF generated the lowest percentages of correct techniques.This result was the opposite of that obtained by Yi et al.(2007),whose reduction in the dimensionality of hyperspectral data by PCA generated an increase in the correct classification of artificial neural networks in relation to the raw data,used to monitor leaf N concentrations in rice.
In this work,the stepwise proc step disc technique proved to be conservative,selecting a large number of wavelengths throughout the measured spectrum for classification in four and two classes.Logistic regression,on the other hand,is a more selective technique and selected fewer wavelengths,which were not evenly distributed in the measured spectrum.
If we evaluate only the averages of the correctness percentage of the techniques,the most recommended binomial of reduction and classification technique would be the proc step disc stepwise associated with the classification by linear discriminant function,regardless of the number of classes to be modeled.When evaluating the efficiency of the binomial (Table S3),the best combination becomes the reduction by logistic regression associated with the discriminant linear function,regardless of the number of classes to be modeled.
Physiological approaches
Generally,in greenhouses,a N def iciency is only noticed when visual signs such as the chlorosis of mature leaves begin to appear,but by this stage,the plant has already been damaged.Therefore,to prevent seedlings from reaching such stage,nurseries routinely apply N,which in many cases may be unnecessary,altering the balance of the C/N ratio (Nunes-Nesi et al.2010),wasting the fertilizer,and increasing costs.Thus,with the NIRS technique,metabolic changes in the plant can be captured before any visible signs of def iciency.This technique can also detect changes in N concentration.Therefore,the use of NIRS combined with other detection techniques and data processing could detect other changes that will guide management choices to produce better greenhouse seedlings at lower cost.
In theory,the low concentrations of N supplied toA.emarginataseedlings for 45 days were sufficient to generate biochemical changes in the leaves without causing any visual signs.These changes influenced the spectral signature,culminating in the separation of the average reflectance curves into two sets of curves to identify N def iciency with 100% accuracy.
Leaf reflectance is related to the amount of certain compounds in the leaf.The lower the reflectance of the sample at certain wavelengths,the greater the amount of the compound correlated to that range.Thus,the mean reflectance curves for the N def iciency treatments (0 and 2.75 mM of N) were below the curves for the N treatments (5.5 and 11 mM of N).Thus,several compounds probably accumulated in these leaves as a physiological response due to the different concentrations of N supplied,and their reflectance is related to the spectral range used (900 to 1700 nm).
We can assume starch,lignin,cellulose,and total sugars accumulated because the wavelengths in the range of 990 nm,1120 nm,1200 nm,1420 nm,1450 nm,1490 nm,1530 nm,1540 nm,1580 nm,and 1690 nm are correlated with the concentration of at least one of these compounds (Curran 1989).These compounds may have accumulated as a result of the reduced supply of N,which probably led to greater use of carbon skeletons in carbon metabolism.This phenomenon was observed by Campos et al.(2019),who cultivatedAnnona emarginatawith different levels of N and showed that low concentrations of N contributed to thane increase in volatile substances and leaf carbohydrates,especially starch.
Gas exchange and chlorophyllafluorescence analyses are commonly used to assess changes in photosynthetic metabolism and can be used as indicators of damage due to the lack of a mineral nutrient (Baron et al.2013;Kalaji et al 2018).
In this work,the variations in the concentrations of N did not affect gas exchange (see Table S1).Because plants have a reserve of N in amino acids such as arginine (Esteban et al.2016),for N def iciency treatments,N is probably recycled via deamination (Nunes-Nesi et al.2010) and redirected to regenerating and synthesizing RuBisCO.Thus,the assimilation rate (A) and RuBisCO efficiency (A/Ci) were maintained,delaying any biochemical changes that would alter the C metabolism,which coincides again with the possible accumulation of carbohydrates mentioned above.
ForA.emarginataseedlings grown in N-free solution for 45 days,the efficiency of the photosystems began to be affected,according to the chlorophyllafluorescence analysis.More energy was dissipated in the form of heat by the antennas (D),and less potential quantum energy (Fv'/Fm') and photochemical energy was dissipated and not used in the photochemical phase (Ex).
Leaf pigments did not differ significantly among the concentrations of N,indicating that 45 days of exposure to the concentrations did not cause sufficient metabolic changes to cause chlorosis and/or necrosis in the leaves.Thus,for these seedlings,the leaf pigments are not good early indicators of N status when metabolic changes have already started.
Because N was directed to RuBisCO,the photosystem possibly ended up having a reduced amount of N,resulting in lower potential quantum energy and Ex,but higherD,indicating a photoprotective mechanism (Mantoan et al.2015).However,the effective quantum efficiency (ΦPSII) was not altered,which allowed the production of reducing agents used in the metabolism of C to be maintained.
The degradation of N reserves in the form of amino acids in plants is triggered under N def iciency,which can cause an increase in the concentration of ammonium (NH4+).As amino acids break down,H+is pumped from the cell,causing intracellular alkalization and extracellular acidification,hindering the absorption of cations such as Ca2+and altering the plant’s ionic relations (Esteban et al 2016).In the present experiment,the complete leaf analysis showed that the plants in the N def iciency treatments had lower calcium concentrations than those in the other treatments,probably due to an alteration in the ionic balance generated by the accumulation of NH4+.
The complete leaf analysis was not effective for detecting different concentrations of N;it was only able to separate the treatment without N from the other treatments.Identifying only the total absence of a mineral is obviously not suitable for field conditions,since the seedling is rarely completely without N but might have a concentration lower than recommended.This technique only assesses the concentration of the mineral in the leaf;hence,it probably is less effective due to the degradation of reserve amino acids,which maintains the concentration of leaf N.In this study,modeling using spectral data from NIRS obtained better results because it not only measures the concentration of N itself but the effects of metabolic changes that occur in the leaf as a result of the different concentrations of N provided.
Vegetation spectral indices
The spectral indices of vegetation (VSI) can be considered as a consequence of studies with spectral data,such as those of the NIRS.Xue and Su (2017) predicted that,with the advancement of hyperspectral and multispectral remote sensing,new VSI will be developed,expanding the research areas.
Currently,most VSI are based on wavelengths in the range of 400 to 900 nm,that is,the visible range of the light spectrum (Xue and Su 2018).Thus,the most-used VSI to measure N are also based on the visible range.These VSI are correlated with visual signals caused by long exposure to lack or excess of N,such as chlorophyll degradation and alteration in biomass,respectively.For example,to quantify N in rice,Zhou et al.(2010) used the modif ied simple ratio,which is an indicator of biomass (Sims and Gamon 2002),and Yang et al.(2018) used the normalized difference vegetation index,which is an indicator of biomass and leaf area (Rouse et al.1974).
In this work,we developed the VSI based on near-infrared (NIR) wavelengths that were selected most frequently by models of attribute selection.These wavelengths can also be associated with metabolic changes caused by different concentrations of N supplied to plants,which are not yet visible.
The wavelengths used in proposing the indices were 1685 nm,1679 nm,1673 nm,and 1638.673 nm.According to Curran (1989) and Jensen (2002),the area close to 1690 nm is associated with N,nitrate,proteins,and starch.Thus,we can say that the selected wavelengths 1685 nm and 1679 nm probably have a strong connection with the compounds that can change due to the N concentration.
The leaf is the main site of reduction of nitrate to ammonium (Bloom et al.2010).This conversion can act as a drain of electrons and of the energy that is not dissipated and not used in the photochemical phase of photosynthesis,thus preventing the creation of reactive oxygen species that can cause membrane damage (Bloom et al.2010).Therefore,the concentration of nitrate in the leaves is important information related to N,which justif eis the selection of wavelengths in this related range.Miphokasap et al.(2 012) tested different VSIs formed by wavelengths located from the visible to the end of the NIR spectrum (2500 nm) to measure N in sugarcane.The best results were obtained with indices based on wavelengths of 700 nm,724 nm,and 750 nm,which are in the visible range.Sugarcane is a fast-growing C4plant,which has a higher efficiency for N use.A.emarginatais a C3plant with a slower metabolism,and,despite having a lower efficiency for N use,it takes longer to grow.Consequently,visible signs of N def iciency take longer to appear.
In this study,there is no change in leaf pigments,which are the leaf compounds with the greatest influence on the leaf reflection in the visible spectrum according to Carter and Knapp (2011),only indices formed by wavelengths located in the NIR range will most likely be accurate in cases where only pigments suffer alterations.
Four of the six indices selected by the proc step disc stepwise technique were also selected by logistic regression.However,the two surplus indices contributed little to the correctness percentage of the technique.Thus,the recommended combination of indices would be that of the four indices selected by logistic regression.
In the indices selected by logistic regression,the wavelengths that appear the most are 1685 nm and 1679 nm.These are the last two of the measured spectrum,being in the area of the four mean leaf reflectance curves.They are also the closest to one of the regions of the spectrum that is related to the N and starch concentrations and are thus influential in the classification.This work serves as a reference for other researchers to use NIRS and statistical modeling for monitoring the health of tree seedlings during production and developing an autonomous monitoring system for macro-and micronutrients,water content,and diseases of plants in greenhouses.
Final considerations
Metabolic responses of plants to changes in the environment can be very fast.N def iciency or excess can change the pattern of leaf reflectance in different ways,not only because of the amount of N (N is a highly mobile element),but because of the different metabolic reactions of the plant to these amounts of available N.The NIRS technique is an indirect method that makes it possible to detect changes in the reflectance pattern.With the early detection of these changes,prophylactic measures can be implemented to avoid production losses and guarantee seedling quality.
Conclusions
Near-infrared spectroscopy (NIRS) combined with statistical modeling of multidimensional data is effective for assessing N levels in young plant leaves of theAnnona emarginatavar.Terra-fria.We also conclude that a set of indices based on a combination of wavelengths in the range of 1630 to 1690 nm that probably can be used to estimate N variations inAnnona emarginata.The measured physiological variables supported the results of the statistical modeling,even presenting a different level of scale than the modeling done using leaf reflectance.The chlorophyllafluorescence and the leaf N analysis were effective for identifying changes in metabolism due to N def iciency.
AcknowledgementsWe thank Miss Carolina Vaz Passos for her grammar review and corrections.
 Journal of Forestry Research2023年1期
- Journal of Forestry Research的其它文章
- Journal of Forestry Research
- Tree ecophysiology in the context of climate change
- Leaf thermal tolerance and sensitivity of temperate tree species are correlated with leaf physiological and functional drought resistance traits
- Modelling the impacts of cover crop management strategies on the water use,carbon exchange and yield of olive orchards
- Light intensity and hydrogel soil amendment differentially affect growth and photosynthesis of successional tree species
- A soil quality index for subtropical sandy soils under different Eucalyptus harvest residue managements
