Observation of nonlinearity and heating-induced frequency shifts in cavity magnonics
Wei-Jiang Wu(吴维江), Da Xu(徐达), Jie Qian(钱洁), Jie Li(李杰), Yi-Pu Wang(王逸璞), and Jian-Qiang You(游建强)
Interdisciplinary Center of Quantum Information and Zhejiang Province Key Laboratory of Quantum Technology and Device,Department of Physics and State Key Laboratory of Modern Optical Instrumentation,Zhejiang University,Hangzhou 310027,China
Keywords: magnon,magnetostatic mode,temperature,yttrium–iron–garnet(YIG)
1. Introduction
Nonlinear effects are a large class of physical phenomena that have been continuously and actively explored in optics,[1–3]plasmonics,[4–6]and acoustics,[7–9]as well as in other oscillations and wave systems.[10–12]Nonlinearity and nonlinear interactions are weak and difficult to be detected in some systems, but they can also become sufficiently strong to be the dominant factor in some other systems. A nonlinear system serves as the basis for further development of applications, such as information processing,[13,14]information conversion,[15]switching devices,[16]and so on.
Cavity magnonics, on the other hand, has gradually demonstrated its unique advantages in fundamental and applied research over the last few years.[17–42]It is expected to be a critical component of hybrid quantum systems[43]and quantum network nodes.[44]A commonly used cavity magnonic system consists of a microwave cavity and ferrimagnets,such as the yttrium–iron–garnet (YIG). The spin collective excitation modes are spin waves in the ferrimagnetic spin ensemble. The most widely studied spin wave mode is the uniform precession mode of spins (i.e., the Kittel mode), which has the largest magnetic dipole moment and can strongly interact with the microwave in both the quantum limit[17,18]and roomtemperature classical regime.[19]Under the bias of an external magnetic field with certain inhomogeneity, besides the Kittel mode,there are also higher-order magnetostatic(HMS)modes in the spin ensemble.[45–47]Previous studies often ignored the influence of these magnetostatic modes on the observation and application of Kittel mode in experiments. However,the HMS modes actually have nontrivial spin textures. Their non-zero orbital angular momentum feature can be used to demonstrate nonreciprocal Brillouin light scattering in optomagnonics and other chiral optics.[33,48–50]
In this work,we focus on the heating-induced cross effect on frequency shifts of the Kittel and HMS modes in a nonlinear cavity magnonic system,where the non-linearity is embodied in the self-Kerr effect of magnon mode under strong drive.The heating effect is investigated experimentally in a coupled three-dimensional(3D)cavity and YIG sphere system,where the YIG sphere supports both the Kittel and HMS modes. A large frequency difference between these two modes is found.When the Kittel mode or HMS mode is pumped to generate a certain number of magnon excitations,the pumped mode gains a frequency shift due to the self-Kerr effect.[31,51–56]Meanwhile, the frequency of the undriven mode also shifts due to the driving induced raise of the temperature in the sample.This offers additional controllable degrees of freedom in cavity magnonics without increasing system’s complexity. Our study will also bring new ideas to the magnetostatics studies and hybrid magnonic operations.[57–59]
2. System and theoretical model
The experimental setup of the cavity magnonic system is illustrated in Fig.1(a). It consists of the microwave field in a 3D copper cavity(internal dimension is 44.0 mm×20.0 mm×6.0 mm), the magnon modes in a single crystal YIG sphere(1 mm in diameter), and the drive field provided by a microwave(MW)source.The YIG sphere is glued on the top of a beryllium ceramic rod and mounted at the antinode of the magnetic field of the cavity mode TE102(ωc/2π=10.07 GHz).The whole sample is placed in a bias magnetic fieldB0applied along the[110]crystal axis of YIG sphere,which results in a negative self-Kerr coefficient (when the magnon mode is driven, the self-Kerr effect with negative coefficient corresponds to a redshift of the magnon mode frequency).[31,56]The cavity has three ports. The port 1 and port 2 are connected with the vector network analyzer (VNA) for measuring the microwave transmission spectrum|S21|2. The drive field is loaded to port 3, which is terminated with a magnetic coil. The bias magnetic field, the rf magnetic field from the magnetic coil,and the rf magnetic field from the cavity mode TE102are perpendicular to each other at the position of the YIG sphere. This configuration maximizes the cavity–YIG coupling strength and drive efficiency. It should be noted that the rf magnetic field from the cavity is employed as the probing field, which has a far lower intensity than the drive field(rf magnetic field from the magnetic coil). The magnetic coil plays multiple roles: (i)it radiates the drive field;(ii)it works as a dissipative channel for the magnon modes.
More spin moments contribute to the Kittel mode in the crystal, resulting in a larger magnetic dipole and a stronger coupling with the cavity mode.[43,60]Both the Kittel mode and HMS mode become nonlinear modes on account of the magnetocrystalline anisotropy. The magnetocrystalline anisotropy energy measures the energy cost when tuning the magnetization orientation from the easy axis to the hard axis. These energy terms[see Eq.(A4)in Appendix A]give rise to the self-Kerr effect and excitation number bistability.[52]The magnon mode is pumped to generate a certain number of excitations, which increases macrospin precession angle and YIG sphere’s temperature due to spin-lattice relaxation, as shown in Fig. 1(b). The temperature alters the magnetocrystalline anisotropy energy and saturation magnetization,which makes all the magnon modes shift in frequency. In previous studies, the cross effect between the Kittel mode and HMS mode has rarely been investigated. Here,we model the two magnon modes with two sub-magnetizationsMKandMH, where subscripts K and H represent the Kittel mode and HMS mode,respectively. The effective Hamiltonian of the coupled system can be written as(see Appendix B)


Fig.1. (a)Schematic diagram of the experimental setup. The YIG sphere is coupled to the cavity mode TE102. The cavity is placed in the bias magnetic field B0 (blue arrow). The microwave source connected to the loop coil provides a drive field. The vector network analyzer(VNA)measures the cavity transmission spectrum|S21|2. Inset: in the YIG sphere,the Kittel mode and HMS mode are denoted by two sub-magnetizations. (b)Schematic diagram of the self-Kerr and heating effects.In the upper panel,the drive field applied on the Kittel mode excites a certain number of magnons, resulting in an increase of the precession angle θ. The magnon mode dissipates energy into the crystal lattice via spin-lattice relaxation. Then, as the sample is heated and the temperature rises,the self-Kerr effect will shift the frequency of the Kittel mode. The heating effect will shift the frequency of the HMS mode without changing the precession angle of the HMS-mode magnetization MH.A similar effect occurs by exchanging the roles of the two modes,as shown in the lower panel. The dotted arrows represent the states after driving.

3. Experimental results
The transmission spectra of the coupled system are measuredversusthe magnet coil current as shown in Fig.2(a).The anti-crossing indicates the strong coherent coupling between the Kittel mode and cavity mode, and they will periodically exchange energy with each other.[19]At the left part of the transmission mapping, when the magnet coil current is about 4.75 A, we find a small coupling feature, which is attributed to the HMS mode. The coupling strength is 2 MHz. Here,the frequency difference between the Kittel mode and HMS mode is 301 MHz,which is much lager than the linewidths of the modes. When the magnon mode is pumped by the drive field,the temperature of the sample rises,and be measured by attaching a thermocouple to the surface of the sample.

Fig.2. Drive on the Kittel mode. (a)The transmission spectra are measured versus magnet coil current. The Kittel mode(red dashed line)and HMS mode(green dashed line)are coupled with the cavity mode. (b)The transmission spectra are measured versus magnet coil current,while a drive field of 9.8 GHz and 25 dBm is applied on the Kittel mode. The Kittel mode has a frequency shift ∆k,s due to the self-Kerr effect, and the HMS mode has a even larger frequency shift ∆h,c caused by the heating effect. (c)The frequency shifts of the Kittel mode and HMS mode are extracted from panel(b),and plotted versus δ′k=ωk −ωd1 −2π·5.94 MHz. The experimental results are fitted with Eq.(2)and ∆h,c=2.5∆k,s.
3.1. Drive the Kittel mode
In Fig.2(b),we apply the drive field with an input power of 25 dBm at the fixed frequencyωd1/2π=9.8 GHz on the Kittel mode and measure the transmission spectraversusthe magnetic coil current.Typical bistable frequency jumps can be observed in both the Kittel mode and HMS mode. This measurement is equivalent to sweeping the frequency of the drive field while fixing the frequencies of the magnon modes. We define the drive-field detuning asδk=ωk−ωd1. It should be noted that our system works in the double-dispersive regime,
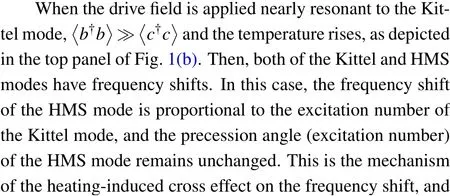
whereΛc,k=ωc−ωk≫gkandΛh,k=ωh−ωk≫gh. The coherent couplings induced-frequency shifts are approximately equal tog2k/Λc,kandg2h/Λh,k, respectively.[51,52]In the dispersive regime, they are all small terms. Also, the coupling strength between the HMS mode and cavity mode is relatively small. In this case, we can intently pay attention to the effects induced by Kerr nonlinearity. Then we extract and plot the frequency shifts of the two magnon modesversus δ′k/2π=δk/2π −5.94 MHz in Fig.2(c). The driven Kittel mode has a maximum frequency shift of about−60 MHz,and the undriven HMS mode has a synchronous frequency shift of about−150 MHz. In this case, the temperature of the YIG sphere rises from approximately 300 K to 360 K.The temperature increasement of the YIG sphere results from the spin-lattice relaxation process. The magnons pumped by the drive field dissipate their energy to the lattice vibration phonon mode.
The frequency shift∆k,sof the driven Kittel mode can be fitted by the following equation[51,52][see Eq.(B7)]:

3.2. Drive the HMS mode
The cross effect on the frequency shift implies that the HMS mode excitation will also induce a frequency shift of the Kittel mode. Next,we apply the drive field(25 dBm)at a fixed frequencyωd2/2π=10.1 GHz on the HMS mode and sweep the magnetic field. The measured transmission mapping is shown in Fig.3(a). As expected,the HMS mode has a
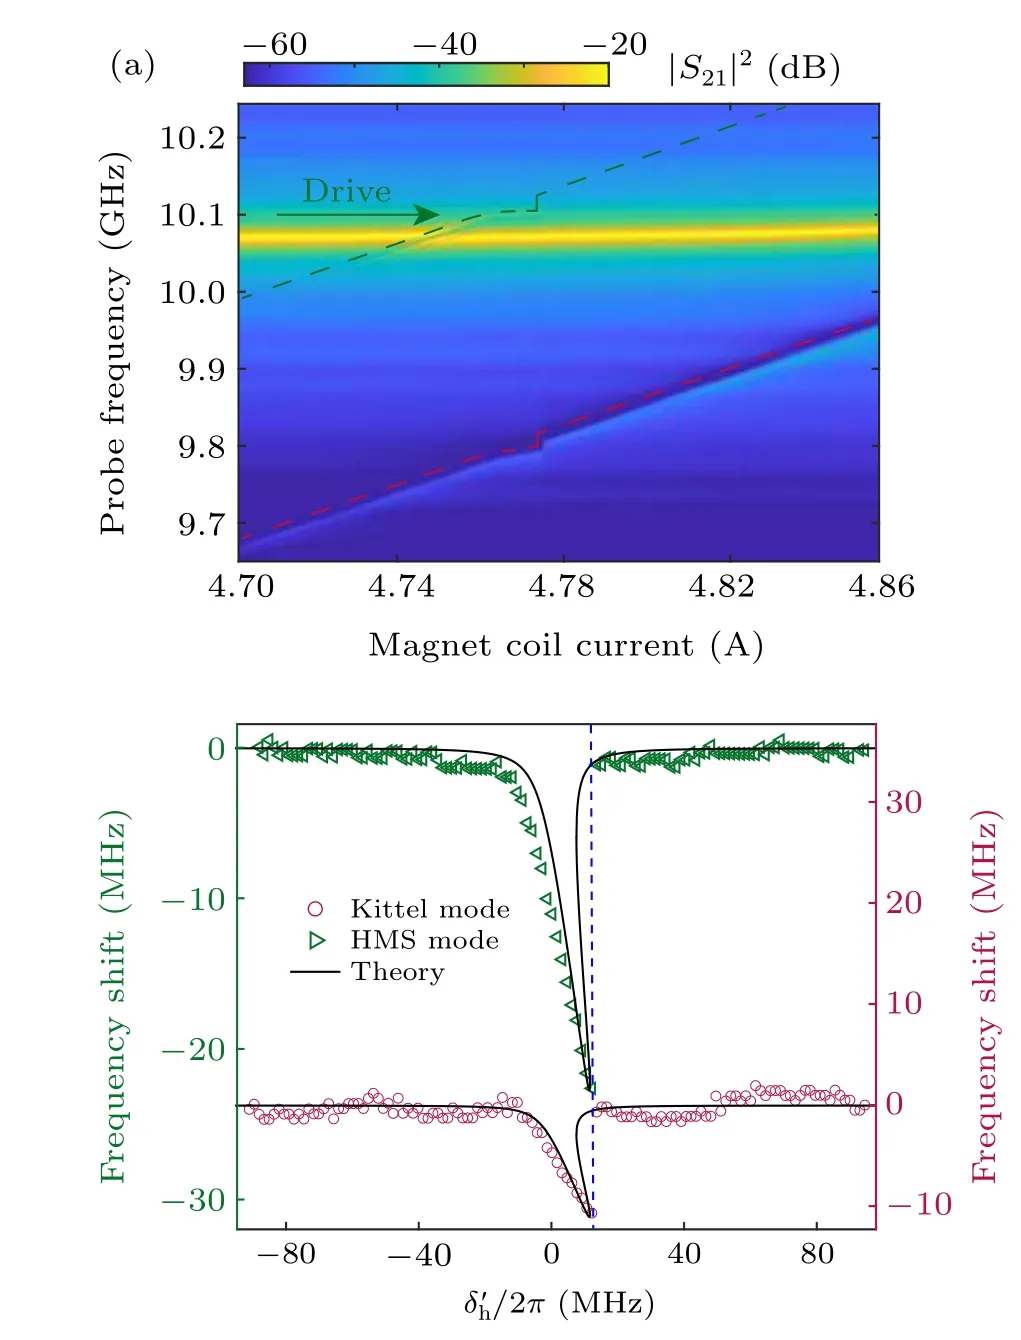
Fig.3. Drive on the HMS mode. (a)The transmission spectra are measured versus magnet coil current,while a drive field of 10.1 GHz and 25 dBm is applied on the HMS mode.The HMS mode has a frequency shift ∆h,s due to the self-Kerr effect,and the Kittel mode has a smaller frequency shift ∆k,c caused by the heating effect. (b)The frequency shifts of the Kittel mode and HMS mode are extracted from panel(a),and plotted versus δ′h. The experimental results are fitted using Eq.(3)and ∆k,c=2.1∆h,s.
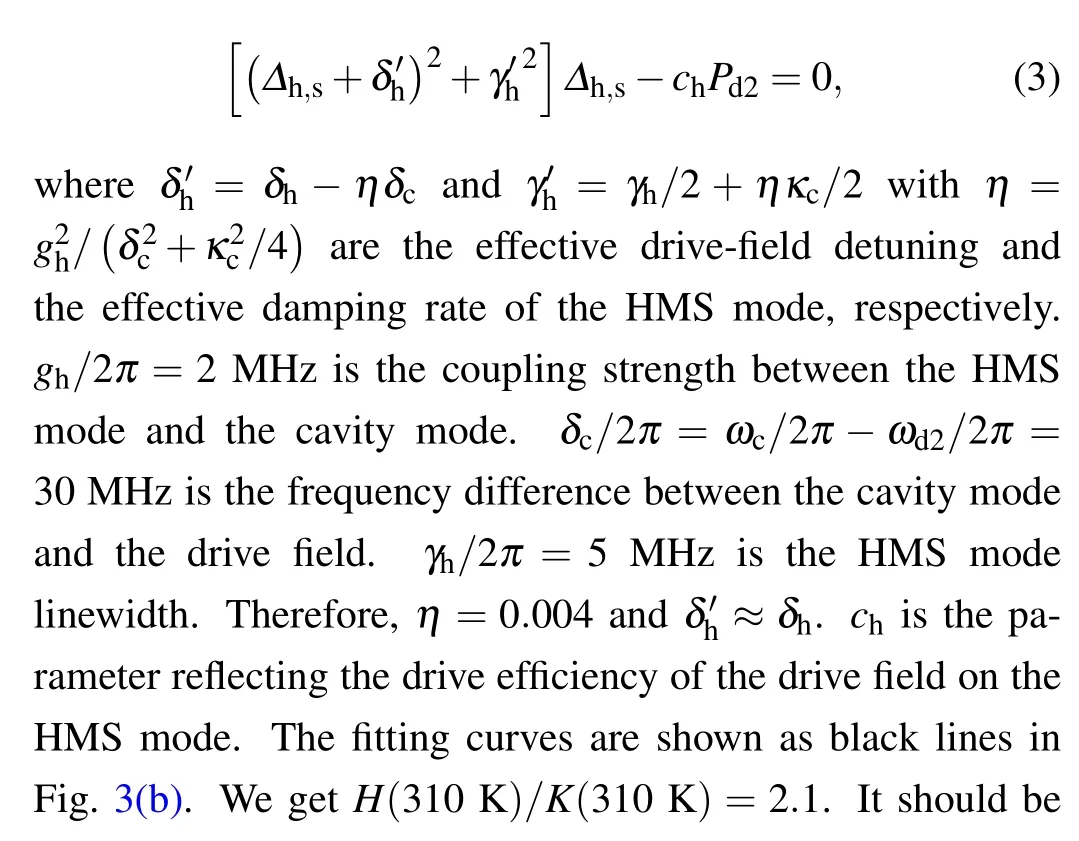
frequency shift due to the self-Kerr effect,and simultaneously the heating-induced cross effect shifts the frequency of the Kittel mode. We extract the frequency shifts of these two modesversusthe effective drive-field detuningδ′has shown in Fig.3(b). In this case,the temperature of the YIG sphere is increased from 300 K to about 310 K.Similarly,the self-Kerr effect induced frequency shift∆h,sof the HMS mode obeys the following equation:

4. Conclusion
In this work, we investigated the heating-induced crossfrequency shifts when the magnon mode is pumped in a ferrimagnetic spin ensemble, in which one Kittel mode and one higher-order magnetostatic mode co-exist. The heatingincuced cross effect between them plus their individual self-Kerr effects gives rise to fascinating phenomena. In the experiment, we drive the Kittel mode and the higher-order magnetostatic mode, respectively. Our experiment opens up a new path to study nonlinear effects in magnetic materials and spin ensembles. The mutual interaction between different magnetostatic modes in a single YIG sample can also provide new degrees of freedom for cavity spintronics and cavity magnonics.[61]We anticipate that this finding may stimulate more designs and applications of cavity magnonics.
Acknowledgments
Project supported by the National Natural Science Foundation of China (Grants Nos. 11934010, U1801661,and 12174329), the Zhejiang Province Program for Science and Technology (Grant No. 2020C01019), the Fundamental Research Funds for the Central Universities (Grant No. 2021FZZX001-02), and the China Postdoctoral Science Foundation(Grant No.2019M660137).
Appendix A:Hamiltonian of the kittel mode
First, we derive the Hamiltonian of the magnon modes without including the heating effect. Under the bias magnetic fieldB0, the Hamiltonian of the Kittel mode is written as(HMS mode has a similar form)[51]

where the first term represents the Zeeman energy and the second term is the magnetocrystalline anisotropy energy,MK=(MK,x,MK,y,MK,z) is the sub-magnetization corresponding to the Kittel mode,Vis the volume of the YIG sphere,µ0is the vacuum permeability, andHanis the anisotropic field due to the magnetocrystalline anisotropy in the YIG crystal.
We adopt the direction of the bias magneticB0as thezdirection(B0=B0ez).When the[110]crystal axis of the YIG sphere is aligned along the bias magnetic field,the anisotropic field is given by[62]
Appendix B:Heating-induced cross effect on the frequency shifts
The first-order magnetocrystalline anisotropy constantKan,saturation magnetizationMK,andSKare all temperaturedependent. Consequently, temperature change can alter the Kerr coefficient and the magnon mode frequency. To quantify the impact of temperature on the frequency shift,we measured the temperature dependence of magnon mode frequency from approximately 300 K to 350 K, as shown in Fig. B1. It can be seen that the ferromagnetic resonance(FMR)frequency of the sample varies with temperature,but there is no bistability during the external heating and cooling.

Fig.B1.Magnon mode frequency–temperature dependence.The YIG sphere is placed on a heating plate,and a digital controller regulates the temperature of the entire plate accurately with auto tuning function. The resonant frequency of the magnon mode in the fixed bias magnetic field is measured by a loop antenna, as shown in the inset figure. In this temperature range, an approximately linear relationship is obtained.
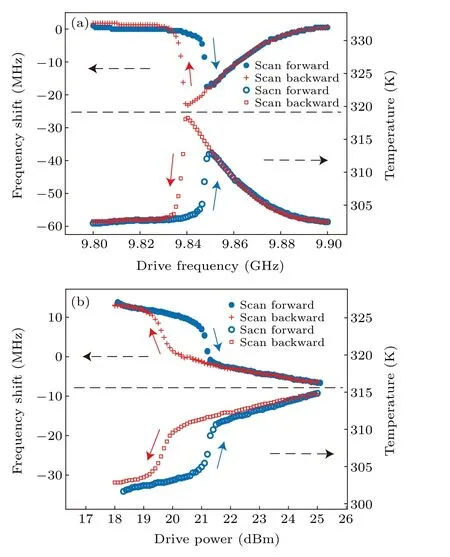
Fig.B2. (a)The temperature(bottom panel)of the sample and the magnon mode frequency shift (top panel) versus drive frequency. The drive power is fixed at 25 dBm. (b) The temperature (bottom panel) of the sample and the magnon mode frequency shift(top panel)versus drive power. The drive frequency is ωd/2π =9.86 GHz.
While sweeping the drive frequency or drive power, we simultaneously monitor the frequency shift of the magnon mode and the sample’s temperature. The experimental results are displayed in Fig. B2. We can find that both the magnon mode frequency shift and temperature exhibit bistable behaviors. In our setup, the drive power required for obtaining magnon mode frequency shift is relatively large,but it can be reduced by utilizing a planar waveguide structure.[69]In fact,it is the bistability of the magnon excitation number that causes the simultaneous temperature bistability. Then, the temperature shifts the magnon frequency. The same holds for the refractive index of the YIG sample, where the thermal bistability is observed by measuring the optical resonance signal.[68]When one of the magnon modes in the sphere is excited, the temperature of the entire sample rises,which changes the saturation magnetization and magnetocrystalline anisotropy field of the sphere. The temperature change further affects the frequencies of other magnon modes in the sphere. Subsequently,the total Hamiltonian can be written as
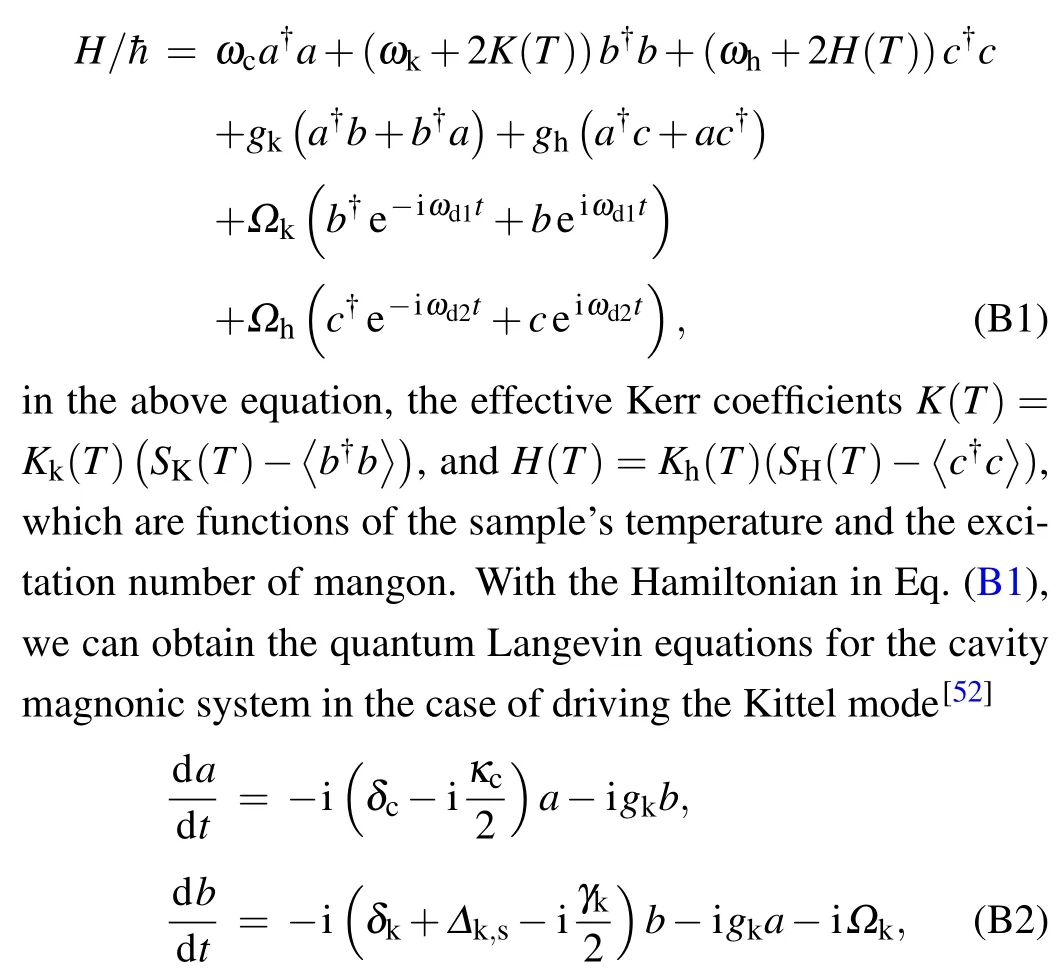
whereδc(k)=ωc(k)−ωd1,κcis the total damping rate of the cavity mode,γkis the damping rate of the Kittel mode, and∆k,s=2K(T)is the frequency shift of the Kittel mode. Then we rewrite the operator as a sum of the steady-state value and the fluctuation,i.e.,a=A+δaandb=B+δb. It follows from Eq.(B2)thatAandBsatisfy

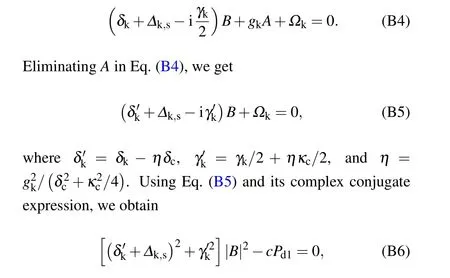
wherePd1is the drive power andcis a constant coefficient reflecting the drive efficiency of the drive field. It should be noted that the frequency shift of the magnon mode is proportional to|B|2. Then, we replace|B|2in Eq. (B6) with∆k,s.Meanwhile,an additional factor could be incorporated intock,i.e.,ck=c(∆k,s/|B|2). Finally,we obtain

Similarly,we can obtain the equation of the frequency shift of the HMS mode when the drive field is applied on the HMS mode. It reads

Appendix C:Data processing method
The transmission spectrum mapping consists of transmission spectra measured at different bias magnetic fields, as shown in Fig. C1(a). The individual transmission spectrum is depicted in Fig. C1(b). The anti-resonances correspond to various modes; for example,the green triangle dot represents the HMS mode,and the circle red dot denotes the Kittel mode.We extract the data points from the transmission spectra and plot them in the left panel of Fig. C1(c). We convert coordinates to frequency shiftversusdriving detuning due to its convenience for us to fit. First, we subtract the linear component that increases with the external bias field from all data points. The remaining component is the contribution of frequency shift caused by the driving field. Second, converting bias current to linear frequency. Third, we replace the horizontal axis with drive detuningδ′k=ωk−ωd1−2π·5.94 MHz and fit it using Eq.(2).

Fig.C1. (a)Original transmission spectrum mapping. (b)The transmission spectrum|S21|2 corresponds to the black dashed line labelled in(a)at a certain bias magnetic field. (c)The Kerr effect induced frequency shifts are extracted. We subtract the linear frequency shift caused by the external bias field from all data points. The horizontal axis is changed to δ′k=ωk −ωd1 −2π·5.94 MHz when fitting with Eq.(2).
- Chinese Physics B的其它文章
- Fault-tolerant finite-time dynamical consensus of double-integrator multi-agent systems with partial agents subject to synchronous self-sensing function failure
- Nano Ag-enhanced photoelectric conversion efficiency in all-inorganic,hole-transporting-layer-free CsPbIBr2 perovskite solar cells
- Low-voltage soft robots based on carbon nanotube/polymer electrothermal composites
- Parkinsonian oscillations and their suppression by closed-loop deep brain stimulation based on fuzzy concept
- Temperature dependence of spin pumping in YIG/NiO(x)/W multilayer
- Interface effect on superlattice quality and optical properties of InAs/GaSb type-II superlattices grown by molecular beam epitaxy

