
Dose-dependent effects of apple pectin on alleviating high fat-induced obesity modulated by gut microbiota and SCFAs
2022-11-26 03:16:38YunyunZhoJinfengBiJinyongYiJinPengQincheng
食品科学与人类健康(英文) 2022年1期
Yunyun Zho, Jinfeng Bi,*, Jinyong Yi,*, Jin Peng,b, Qincheng M,c
a Institute of Food Science and Technology, Chinese Academy of Agricultural Sciences (CAAS)/Key Laboratory of Agro-Products Processing,Ministry of Agriculture and Rural Affairs, Beijing 100193, China
b Sericultural and Agri-Food Research Institute, Guangdong Academy of Agricultural Sciences/Guangdong Key Laboratory of Agricultural Products Processing,Guangzhou 510610, China
c School of Food Science and Technology, Dalian Polytechnic University, Dalian 116034, China
Keywords:
Pectin
Dosage
Obesity
Gut microbiota
Short-chain fatty acid
A B S T R A C T
Recently, pectin has been used as an alternative for commercial prebiotic products to modulate gut microbiota.In this study, the standard diet (Chow group) and high fat diet containing 0% (HF group), 1%, 3%, 5%, 8% or 12% (m/m)apple pectin (HF-P group) were offered ad libitum for 8 weeks to 4-week C57BL/6J mice (n = 10/group).Results showed that body weight gain (R2 = –0.990), subcutaneous adipose accumulation (R2 = –0.930), serum triglyceride elevation (R2 = –0.879), acetate (R2 = 0.955) and propionate concentration reduction (R2 = 0.985)were suppressed by pectin from 1% to 12%, indicating dose response to pectin consumption.Moreover,abundance of obesity-related bacteria Coriobacteriaceae, and pectin-degradating bacteria, Faecalibaculum,Ruminococcus were significantly increased with pectin dosage increased, and the R2 were 0.936, 0.963 and 0.937, respectively.Besides, attenuations for colonic injury and liver steatosis were observed after adding 5% and 8% pectin, respectively.This study confirmed the dose-sensitive manner of pectin to alleviate HF-induced obesity by modulating gut microbiota and enhancing short-chain fatty acids production.
1.Introduction
Nowadays, obesity has become a growing public health issue all over the world, and many people at the risk of metabolic disorders, such as type II diabetes, hyperlipidaemia, hypertension and hepatosteatosis [1].Many studies had confirmed that obesity was associated with the change in composition and function of gut microbiota [2,3].Thus, the regulation of gut microbes was considered as a potential novel method to ameliorate obesity symptoms [4].
Diet is regarded as an essential determinant to alter microbial community structure [5].As a kind of typical soluble dietary fibres,pectin can be commercially extracted from by-products such as apple pomace, citrus peel and beet pulp.Pectin is quite stable in the gastrointestinal tract and could reach to the large intestine, where it is degraded by distinct pectinolytic enzymes produced by various intestinal microbiota [6,7].Some studies reported that 90% pectin could be fermented and produce short-chain fatty acid (SCFA),including acetic acid, propionic acid, and butyric acid, which offered a natural dietary strategy for body weight regulation [8,9].
In recent years, prebiotic effects of pectin were extensively investigated in context of obesity and related metabolic diseases.Some researchers have focused on the effect of pectin on some obesity-related physiological changes [10-13].Adam et al.[12]reported that pectin consumptions of 3.3%, 6.7% and 10.0% were negatively related to food intake and body weight gain of rats fed with high fat (HF) diet.Zacharias et al.[9]tested that the addition of 5% pectin increased SCFA contents, but acetate concentration increased when pectin dosage surpassed 10%.Li et al.[14]revealed that the relative abundance ofBacteroides,Parabacteroides,OlsenellaandBifidobacteriumincreased when pectin dosage was added from 4% to 8%.Moreover, many studies found that apple pectin helped to suppress weight gain, modify gut microbiota, protect gut barrier,attenuate metabolic endotoxemia, enhance hepatic metabolic disorders and reduce oxidative stress, thus in alleviating obesity[3,15,16].However, dose-dependent regulations of pectin on other obesity-related physiological indices, such as lipids profile level, fat accumulation, histology and morphology of liver and colonic mucosa were still not fully investigated.In addition, few reference explored whether the regulations were lasting after breaking pectin supplement or not.Furthermore, the effective threshold for anti-obesity effects needs to be determined as subthreshold levels may be insufficient to improve obesity-related physiological symptoms.
In this study, graded dosage of apple pectin, including 1%, 3%,5%, 8%, and 12% (m/m) were added in a HF diet, attempting to explore the dose-dependent effects of pectin on HF-induced obesity.Meanwhile, we aimed for the first time to examine the lasting effects of pectin on alleviating obesity when mice were resumed the standard diet.The finding of this study may promote theoretical basis for developing pectin-containing functional foods and obesity medications.
2.Materials and methods
2.1 Pectin properties
Apple pectin was purchased from DGF (Spanish, French), and the structural characteristics were measured as follows.Measurements of the galacturonic acid content, methoxylation degree and acetylation degree were based on the reports of Blumenkrantz & Asboe-Hansen[17], Klavons & Bennett [18]and Njoroge et al.[19], respectively.The determination of molar mass distribution was performed using high performance size exclusion chromatography (HPSEC) coupled to multiangle laser light scattering (Dawn Heleos II, Wyatt, USA),reflective index detector (Optilab rEX, WyAtt, USA) and ultraviolet detector (L-2400, Hitachi, Japan).The contents of neutral sugar were measured as described by Liu et al.[20], and high-performance anionexchange chromatography (HPAEC) was achieved using a Dionex system (ICS-3000, Dinox, USA) equipped with a CarboPac™ PA20 column and a pulsed amperometric detector.
2.2 Animal diet
The standard diet was M10110C2 contained 10% kcal fat purchased from Moldiets (Chengdu Biopike Technology Co., Ltd.,China), and other diets were based on a high-fat diet (Moldiets,M10160, 60% kcal% fat), which contained 0%, 1%, 3%, 5%,8% or 12% (m/m) apple pectin (M18071801-05, Moldiets).The cellulose was added to balance total fibre in the experimental diets as appropriate.The compositions of the diets are described in Table S1.
2.3 Animals and experimental design
Healthy male C57BL/6J mice (weight 12–15 g, 4-week old) were purchased from Vital River Laboratory Animal Technology Co., Ltd.(Beijing, China) and housed with free access to water and food in a temperature- and humidity-controlled animal facility.Mice were randomized into 7 groups of 10 mice after 1-week acclimatization,which received standard chow diet (Chow group,n= 10) as a control,high-fat diet (HF group,n= 10) or high-fat diet contained 1%, 3%,5%, 8% or 12% (m/m) pectin (HF-P), including 1P, 3P, 5P, 8P and 12P groups.At the end of the initially 8-week feeding period, 5 mice of each group were sacrificed after an overnight fast, and the others were fed with standard chow diet for 2 weeks and then sacrificed.The experimental design is depicted in Fig.S1.
2.4 Sample collection
Body weight and voluntary food intake were measured twice a week.At the end of 8th week and 10th week, mice were sacrificed by decapitation.The blood from the carotid artery (about 1 mL) was immediately collected in a sterile centrifugal tube and then centrifuged at 3 000 ×gat 4 °C for 15 min.The whole part of epididymal, perirenal,subcutaneous fat pads, liver and intestine were collected and weighed.A part of the liver, subcutaneous fat tissue and colonic wall were fixed in 10% PBS-buffered formalin for histological analysis.Distal colon feces and rectum feces were immediately put into dry ice and stored at –80 °C for analysis of the gut microbiota and SCFA concentration, respectively.
2.5 Blood glucose, plasma lipid and insulin concentration assessment
Blood glucose (BG), total triglyceride (TG), total cholesterol(TC), high-density lipoprotein cholesterol (HDL-C) and lowdensity lipoprotein cholesterol (LDL-C) were assessed using an automatic blood cell analyzer (MEK-7222K, Nihon kohden,Tokyo, Japan).Insulin was measured by a radioimmunoassay kit(Beijing North Institute of Biotechnology Co., Ltd., China) using aγ-radioimmunoassay counter (XH-6080, Xi’an nuclear instrument factory, Xi’an, China).
2.6 Histological analysis
The adipose tissue and colonic wall from 10% PBS-buffered formalin were embedded in paraffin and cut into about 5 μm-thick slices, then stained with hematoxylin and eosin (H&E, Solarbio,China).The liver sample was subjected to oil red O staining (Solarbio,China).A light microscope was used for observation and photograph(BX 40, Olympus Optical Co., Ltd., Tokyo, Japan).Image-Pro Plus 6.0(Media Cybemetics, Inc., USA) was used for measured adipose cell area and colonic gland depth.
2.7 Analysis of SCFA profile
SCFA were analysed as described by Mao et al.[21]with some modifications.Saturated NaCl solution was added to 50 mg samples of mice feces with the proportion of 1:10.The samples were acidified with 100 μL 25% HPO3and treated by ultrasound process for 20 min,followed by being vortexed 1 min and centrifuged at 10 000 ×gfor 15 min.Then, the supernatant was collected and 0.25 g of Na2SO4was added.Finally, the supernatant was injected into a 7980A gas chromatograph (Agilent Technologies, Wilmington, DE, USA)equipped with a capillary column (DB-FFAP, 15 m × 0.32 mm ×0.25 μm, Agilent Technologies, CA, USA) and a flame ionization detector (FID).The temperature of injection and detector were set at 250 and 300 °C, respectively, and the GC temperature programs were as follows: began at 70 °C, increased to 125 °C at the rate of 3 °C/min, followed by the rate of 80 °C/min to 180 °C, and hold for 3 min.The split ratio was 10:1 and the constant voltage was 27.5 kPa.The concentrations of SCFA were measured using the external standard method and expressed as μmol/g feces.
2.8 16S rRNA gene amplification and miseq sequencing analysis
Total microbial DNA was extracted from 68 rectal feces using a OMEGA-soil DNA Kit (Omega Bio-Tek, USA), and the DNA concentration and purification were determined by NanoDrop 2000 UV-vis spectrophotometer (Thermo Scientific, Wilmington,USA), then the DNA quality was checked by 1% agarose gel electrophoresis.The V3-V4 hypervariable regions were amplified with primers 338F (5’-ACTCCTACGGGAGGCAGCAG-3’) and 806R (5’-GGACTACHVGGGTWTCTAAT-3’) by PCR system(GeneAmp 9700, ABI, USA).The PCR reactions, PCR products extraction, purification and quantification were conducted, and sequencing libraries were generated and sequenced on an Illumina MiSeq platform (San Diego, USA) according to the standard protocols by Majorbio Bio-Pharm Technology Co., Ltd.(Shanghai,China).The raw reads were deposited into the NCBI Sequence Read Archive (SRA) database (BioProject Number: PRJNA663088).In the Quantitative Insights into Microbial Ecology (QIIME) version 1.8.0,α-diversity was defined by richness indices (Sobs, Chao1, ACE) and diversity indices (Shannon, Simpson) were calculated.Bray curtis distance was calculated and principal coordinate analysis (PCoA) was used to determine microbialβ-diversity.The differences among the mean abundances of top 15 bacteria were analyzed by Kruskal-Wallis H test in QIIME.The correlation among obesity-related physiological indices, microbial composition and SCFA concentrations were established by redundancy analysis (RDA).
2.9 Statistical analysis
Statistical data analysis was performed using SPSS software(version 23.0 for MacBook Air, SPSS Inc.Chicago, U.S.A).The oneway ANOVA and Duncan’s multiple range test were used to apply significant test for analyzing body fat weight, liver weight, intestinal wall and digest mass, blood biochemical parameters and individual SCFA concentration of seven groups.Statistical significance was taken whenP-values were below 0.05 (P< 0.05,P< 0.01,P< 0.001).#indicated significant difference between treatment groups and HF group, while*represents difference between treatment groups and Chow group.Data were presented as mean ± standard deviation for 10 mice in each group in the 8-week cohort and 5 mice in the 10-week cohort.R2means liner correlation coefficient between pectin content and investigated parameter (e.g.body weight gain, subcutaneous adipose mass, serum triglyceride concentration, acetic and propionate contents), which was generated by linear fitting of scatter plot using Origin 8.0 (Origin Lab, MA, USA).WhenR2is negative, the parameter was negatively correlated with pectin dosage, vice versa.
3.Results
3.1 Pectin structure
Detection results of pectic structure were shown in Table 1.The molecular weight was 1.5 × 10⁶Da, galacturonic acid content was(754.12 ± 0.51) mg GalA/g, methoxylation degree was (64.56 ±2.32)%, and acetylation degree was (0.41 ± 0.01)%.The neutral sugar including rhamnose, arabinose, galactose, glucose and xylose were (4.43 ± 1.87), (2.69 ± 0.41), (34.00 ± 5.66), (207.89 ± 17.04),(25.54 ± 7.07) mg/g, respectively.
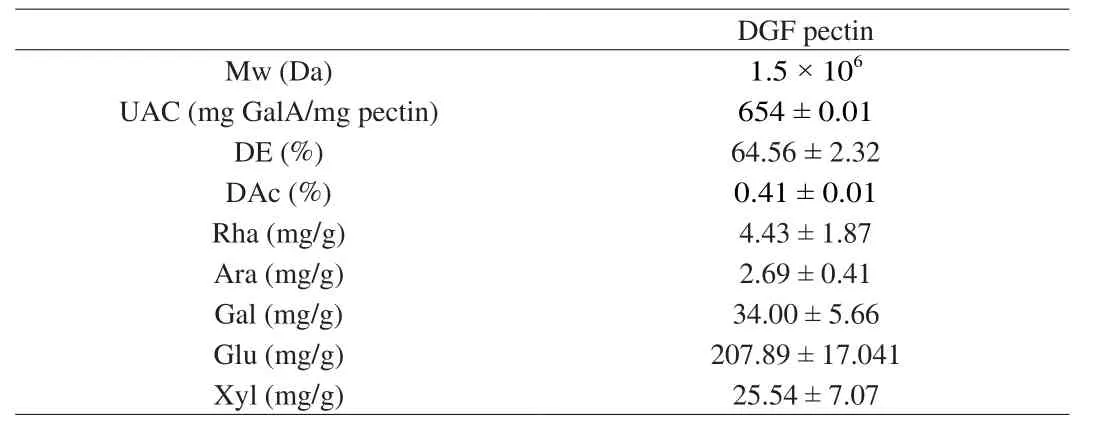
Table 1The information of the pectin structure.
3.2 Food intake, body weight and feed conversion
The changes of body weight, food intake and feed conversion affected by individual diets are shown in Figs.1 and S2.Growths of the mice continued throughout the 8-week feed period at a steady rate, and their food intakes were stable after the initial 1-week acclimatization.As seen in Fig.1A, the highest weight gain was showed by the HF mice during 10 weeks’ feeding period, and the mice weight of 3P (23.58 g), 5P (21.38 g), 8P (19.80 g) and 12P mice(16.63 g) were significantly lower than that of the HF mice (P< 0.01),andR2was –0.990, indicating a dose-sensitive manner between pectin dosage and body weight.The weight of 12P mice was lower than the Chow mice before 4 weeks (Fig.S2A), and no significant difference was found among the 8P, 12P and Chow groups in the 8th week(Fig.1A1).The food intakes of all the mice were increased in the first 2 weeks, then reduced to a stable level, and that of the HF mice were higher than the Chow mice from 4th week to 8th week(Fig.S2B).Consequently, weight gain (25.01 g) and feed conversion(20.34 g/g, Fig.S2C2) of the HF mice were significantly higher than those of the Chow mice (13.60 g, 10.16 g/g) in the 8-week cohort(P< 0.01).After being fed with chow diet for continuous 2 weeks,the levels of food intake and weight gain of mice in the HF and HF-P groups were all decreased, and the highest weight gain was still found in the HF group, and no significant difference was observed among other groups (Fig.1A2).
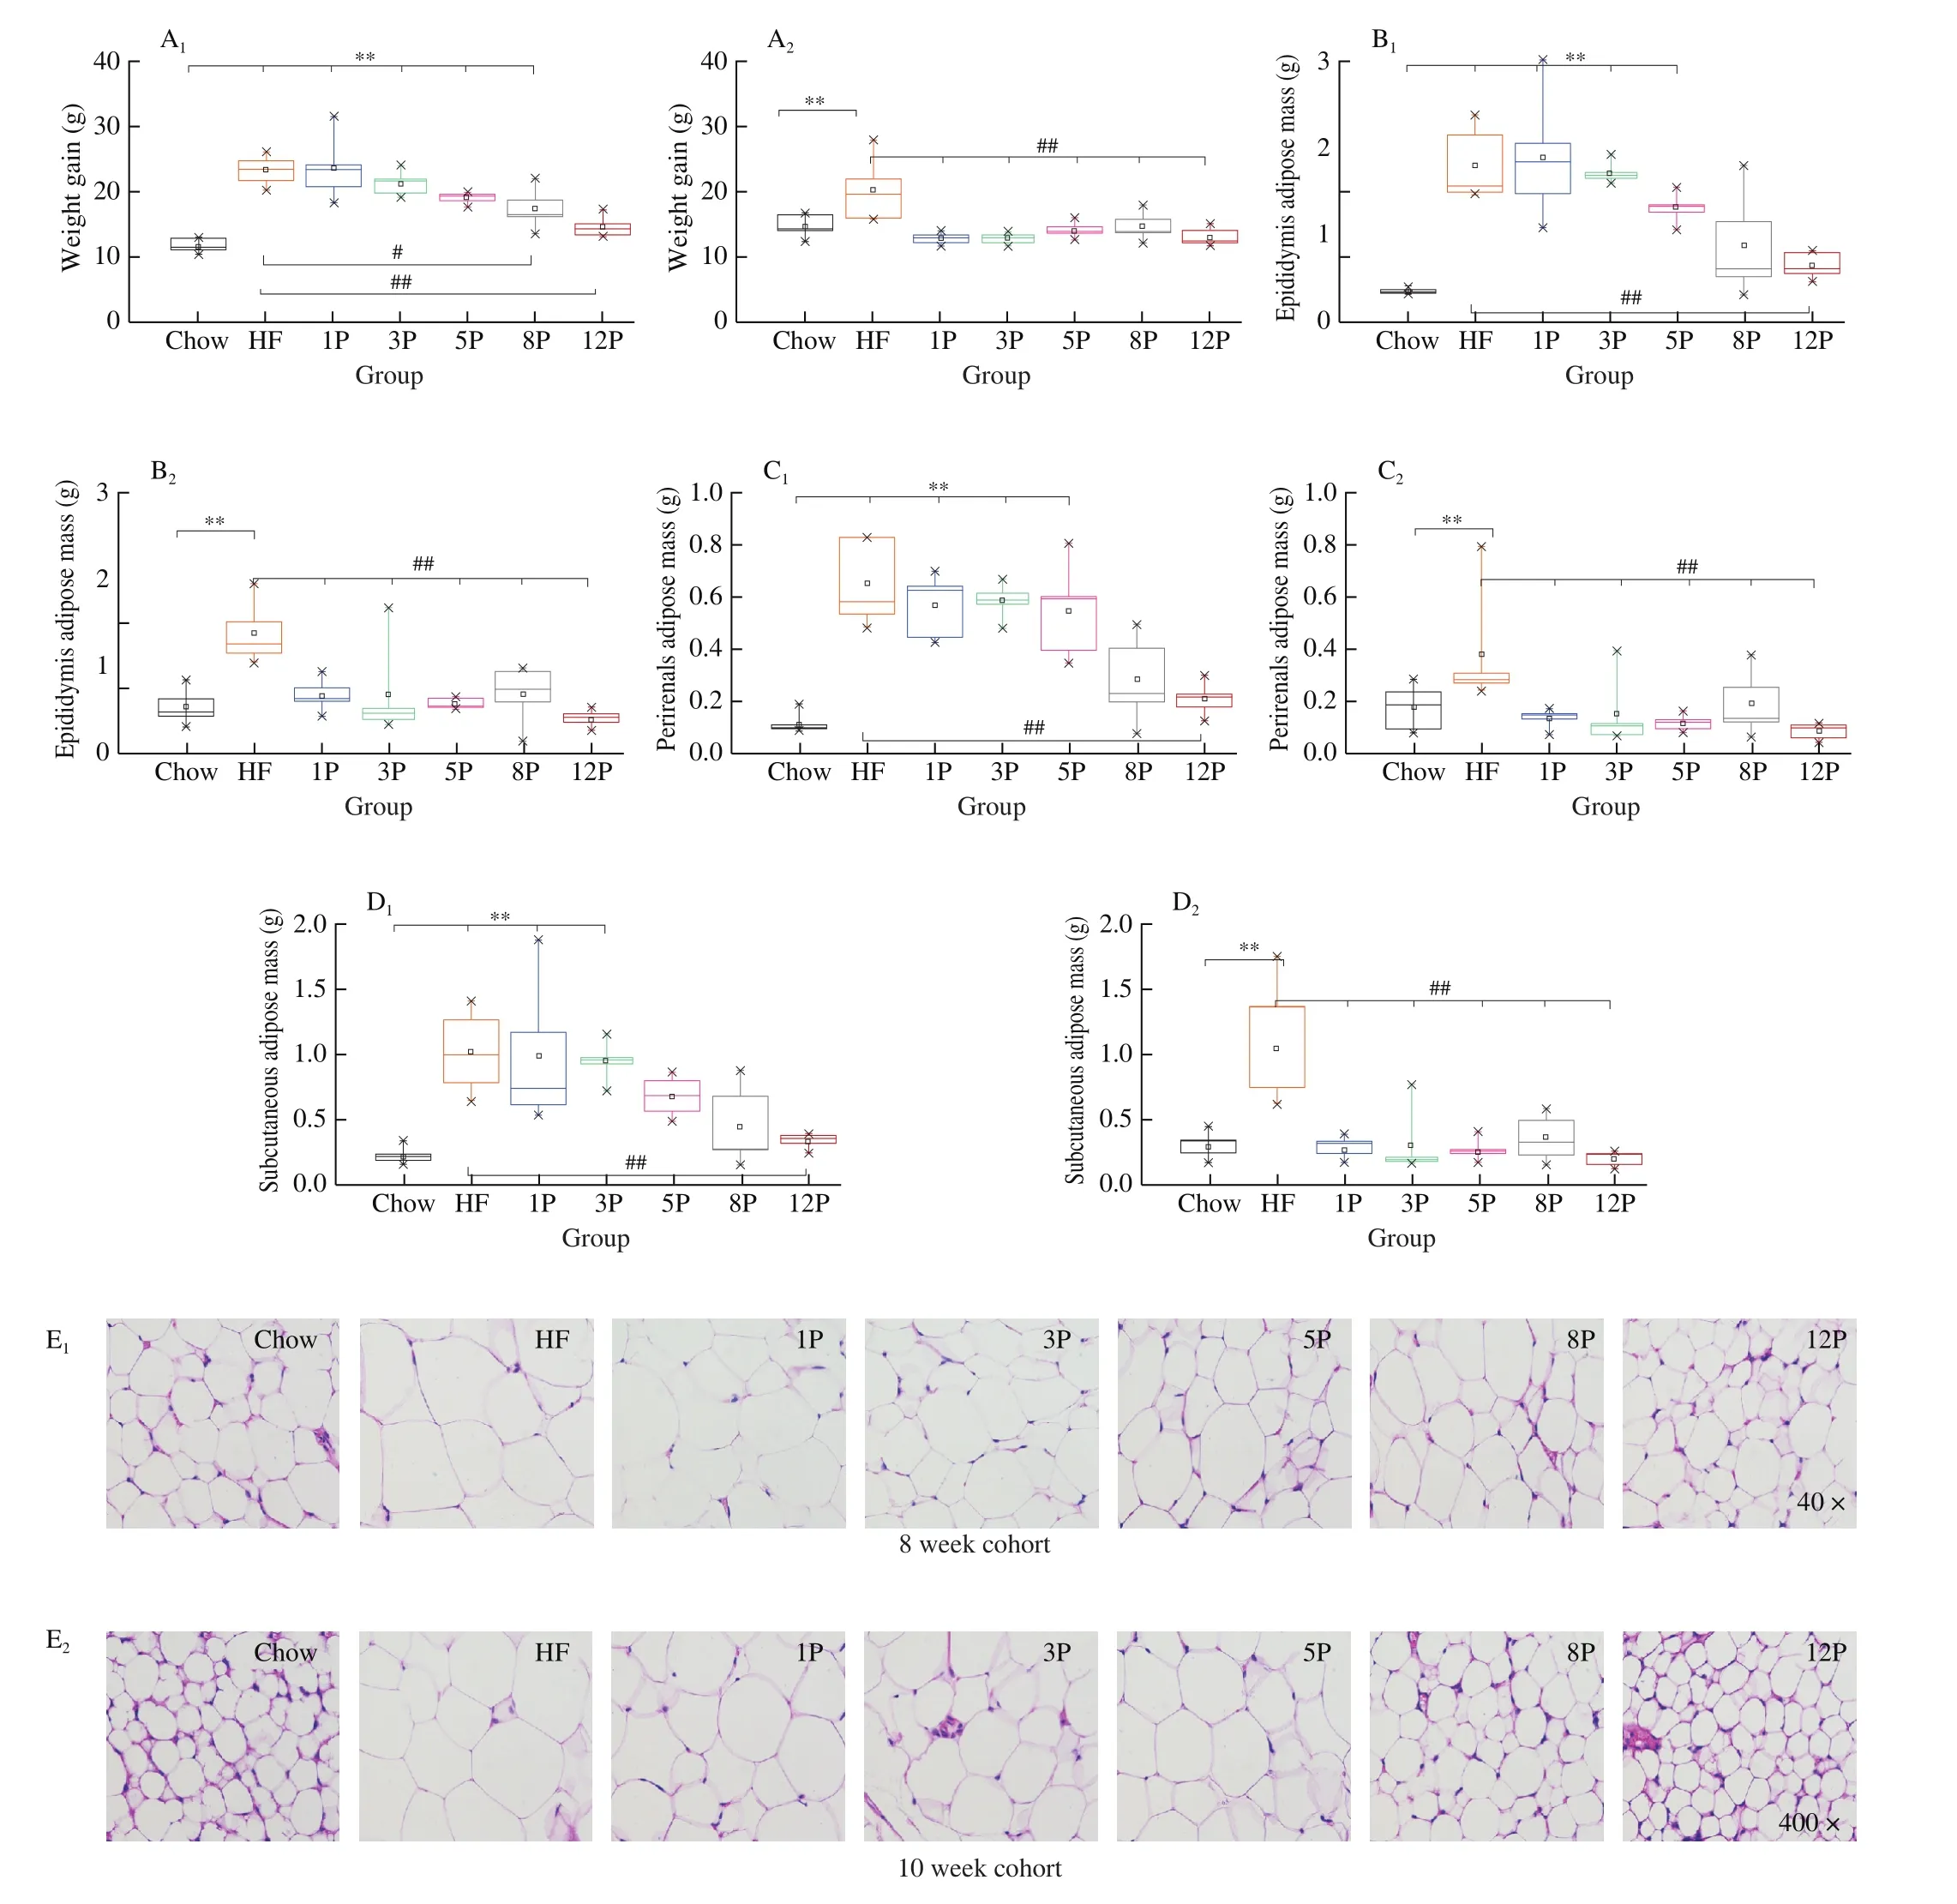
Fig.1 Body weight gain and adipose tissue development of mice in the Chow, HF and HF-P groups in the 8-week (1) and 10-week (2) cohort.(A) final weight gain; (B) epididymis adipose mass; (C) perirenal adipose mass; (D) subcutaneous adipose mass; (E) representative histological images of subcutaneous adipose cell by H & E staining (40 × and 400 ×).*0.01 < P ≤ 0.05, **0.001 < P ≤ 0.01, vs.Chow group; #0.01 < P ≤ 0.05, ##0.001 < P ≤ 0.01, vs.HF group.
3.3 Adipose mass and histological analysis
The typical adipose mass and subcutaneous fat histology are presented in Fig.1.Compared with the Chow mice in the 8-week cohort,the epididymis adipose mass (Fig.1B1), perirenal fat mass (Fig.1C1)and subcutaneous fat mass (Fig.1D1) of the HF mice significantly increased by 80.11%, 82.16% and 78.18%, respectively (P< 0.01).However, these adipose masses of HF-P mice were less than that of the HF mice as the increasing pectin amount from 1% to 12%,which demonstratedR2of –0.955, –0.873 and –0.930, respectively.Moreover, the epididymis adipose mass and perirenal fat mass of the 8P (0.191 g, 0.356 g, respectively) and 12P (0.086 g, 0.196 g,respectively), and subcutaneous fat mass in the 12P (0.33 g) were significantly lower than masses of the three adipose tissue of the HF mice (0.38 g, 1.06 g, 0.33 g, respectively,P< 0.01).After breaking HF and pectin addition in the 8th week, the investigated adipose mass of HF and HF-P mice were all decreased.Additionally, the epididymal (Fig.1B2), perirenal (Fig.1C2) and subcutaneous adipose mass (Fig.1D2) of the HF mice were still higher than that of the Chow mice (P< 0.01) with 58.87%, 53.52% and 72.40%, respectively,while no difference in these adipose masses was found among the HF-P and Chow groups.
Furthermore, Fig.1E presented a distinct increase in subcutaneous adipocyte size from the Chow mice to HF mice.However, compared with the HF mice, the average areas of adipose cells were reduced,and the cellular boundaries were clarified by the HF-P mice fed with the increasing percentage of pectin, both in the 8-week and 10-week cohorts.In contrast, the average area of mice adipose cell in the 10-week cohort was much smaller than that of the 8-week cohort,especially the 12P mice (474.19 μm2) that resembled the Chow mice(497.87 μm2), as seen in Table S2, Supplementary Material.
3.4 BG, lipid profile and insulin
The level of BG, TG, LDL-C, HDL-C, TC and insulin concentration are exhibited in Fig.2.The lowest concentration of HDL-C and insulin, as well as the highest levels of BG, TG,LDL-C and TC were observed in the HF mice among all the groups.Compared with the HF mice, BG (Fig.2A) and TG (Fig.2B) levels of the HF-P mice were reduced as pectin consumption increased from 1% to 12%, withR2of –0.763 and –0.879, respectively.In addition,the level of LDL-C (Fig.2C) of mice in the 5P (0.53 mmol/L), 8P(0.50 mmol/L) and 12P (0.51 mmol/L) were lower than those of the HF mice (0.72 mmol/L,P< 0.01).Moreover, the increase in TC levels over Chow mice was aroused by HF diet.In comparison with the HF mice, pectin reduced this by 49.24% and 55.65% in the 8P and 12P mice, respectively (Fig.2E), while the insulin level was elevated by 44.01% and 47.74% in the 8P and 12P mice, respectively (Fig.2F).After being substituted HF and HF-P diets for chow diet, all levels of BG, lipid profile and insulin concentrations of the HF and HF-P mice were deceased in the 10-week cohort.
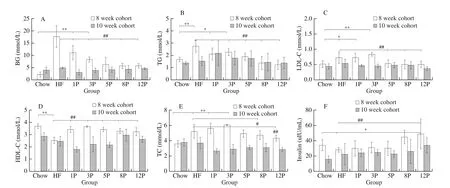
Fig.2 Blood chemistry measurement of mice in the Chow, HF and HF-P groups in the 8-week and 10-week cohort.(A) BG; (B) TG; (C) LDL-C; (D) HDL-C; (E)TC; (F) insulin.*0.01 < P ≤ 0.05, **0.001 < P ≤ 0.01, vs.Chow group; #0.01 < P ≤ 0.05, ##0.001 < P ≤ 0.01, vs.HF group.
3.5 Hepatic fat accumulation and liver histological analysis
Liver weight and the histology of different groups are displayed in Fig.3.The liver weight of HF mice was higher than that of the Chow mice (1.047 g vs.0.791 g,P< 0.01), while significant reductions were found in the mice of HF-P groups (Fig.3A).The liver weight of the 12P mice was 0.985 g, which was also bigger than that of the Chow mice (P< 0.05).Moreover, the highest level of liver steatosis was found in the HF mice, which was featured by obvious fat accumulation and infiltration, as well as blurred cell boundaries in the 8-week cohort (Fig.3C).However, these phenomena were alleviated with the increasing amount of pectin consumption, and healthy liver photograph with relatively complete cell boundaries, well-preserved cytoplasm and visible nucleus were exhibited in the 8P and 12P mice.When mice fed with chow diet for 2 weeks, the liver weights of HF and HF-P mice were reduced (Fig.3B), and only the 12P mice weight was lower than that of the Chow group (0.785 g vs.0.955 g,P< 0.05).It worthy to note that, the degree of liver fat accumulation and infiltration of mice in the HF-P groups were significantly lower than the HF mice, when the diets were added with over 5% pectin intervention (Fig.3D).
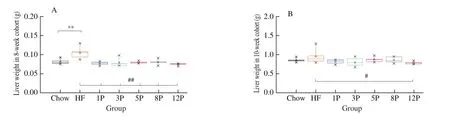
Fig.3 Lipid fat accumulation in the Chow, HF and HF-P groups in the 8-week and 10-week cohort.(A, B) liver weight; (C, D) representative histological images of liver by Oil Red O staining (40 × and 400 ×).*0.01 < P ≤ 0.05, **0.001 < P ≤ 0.01, vs.Chow group; #0.01 < P ≤ 0.05, ##0.001 < P ≤ 0.01, vs.HF group.
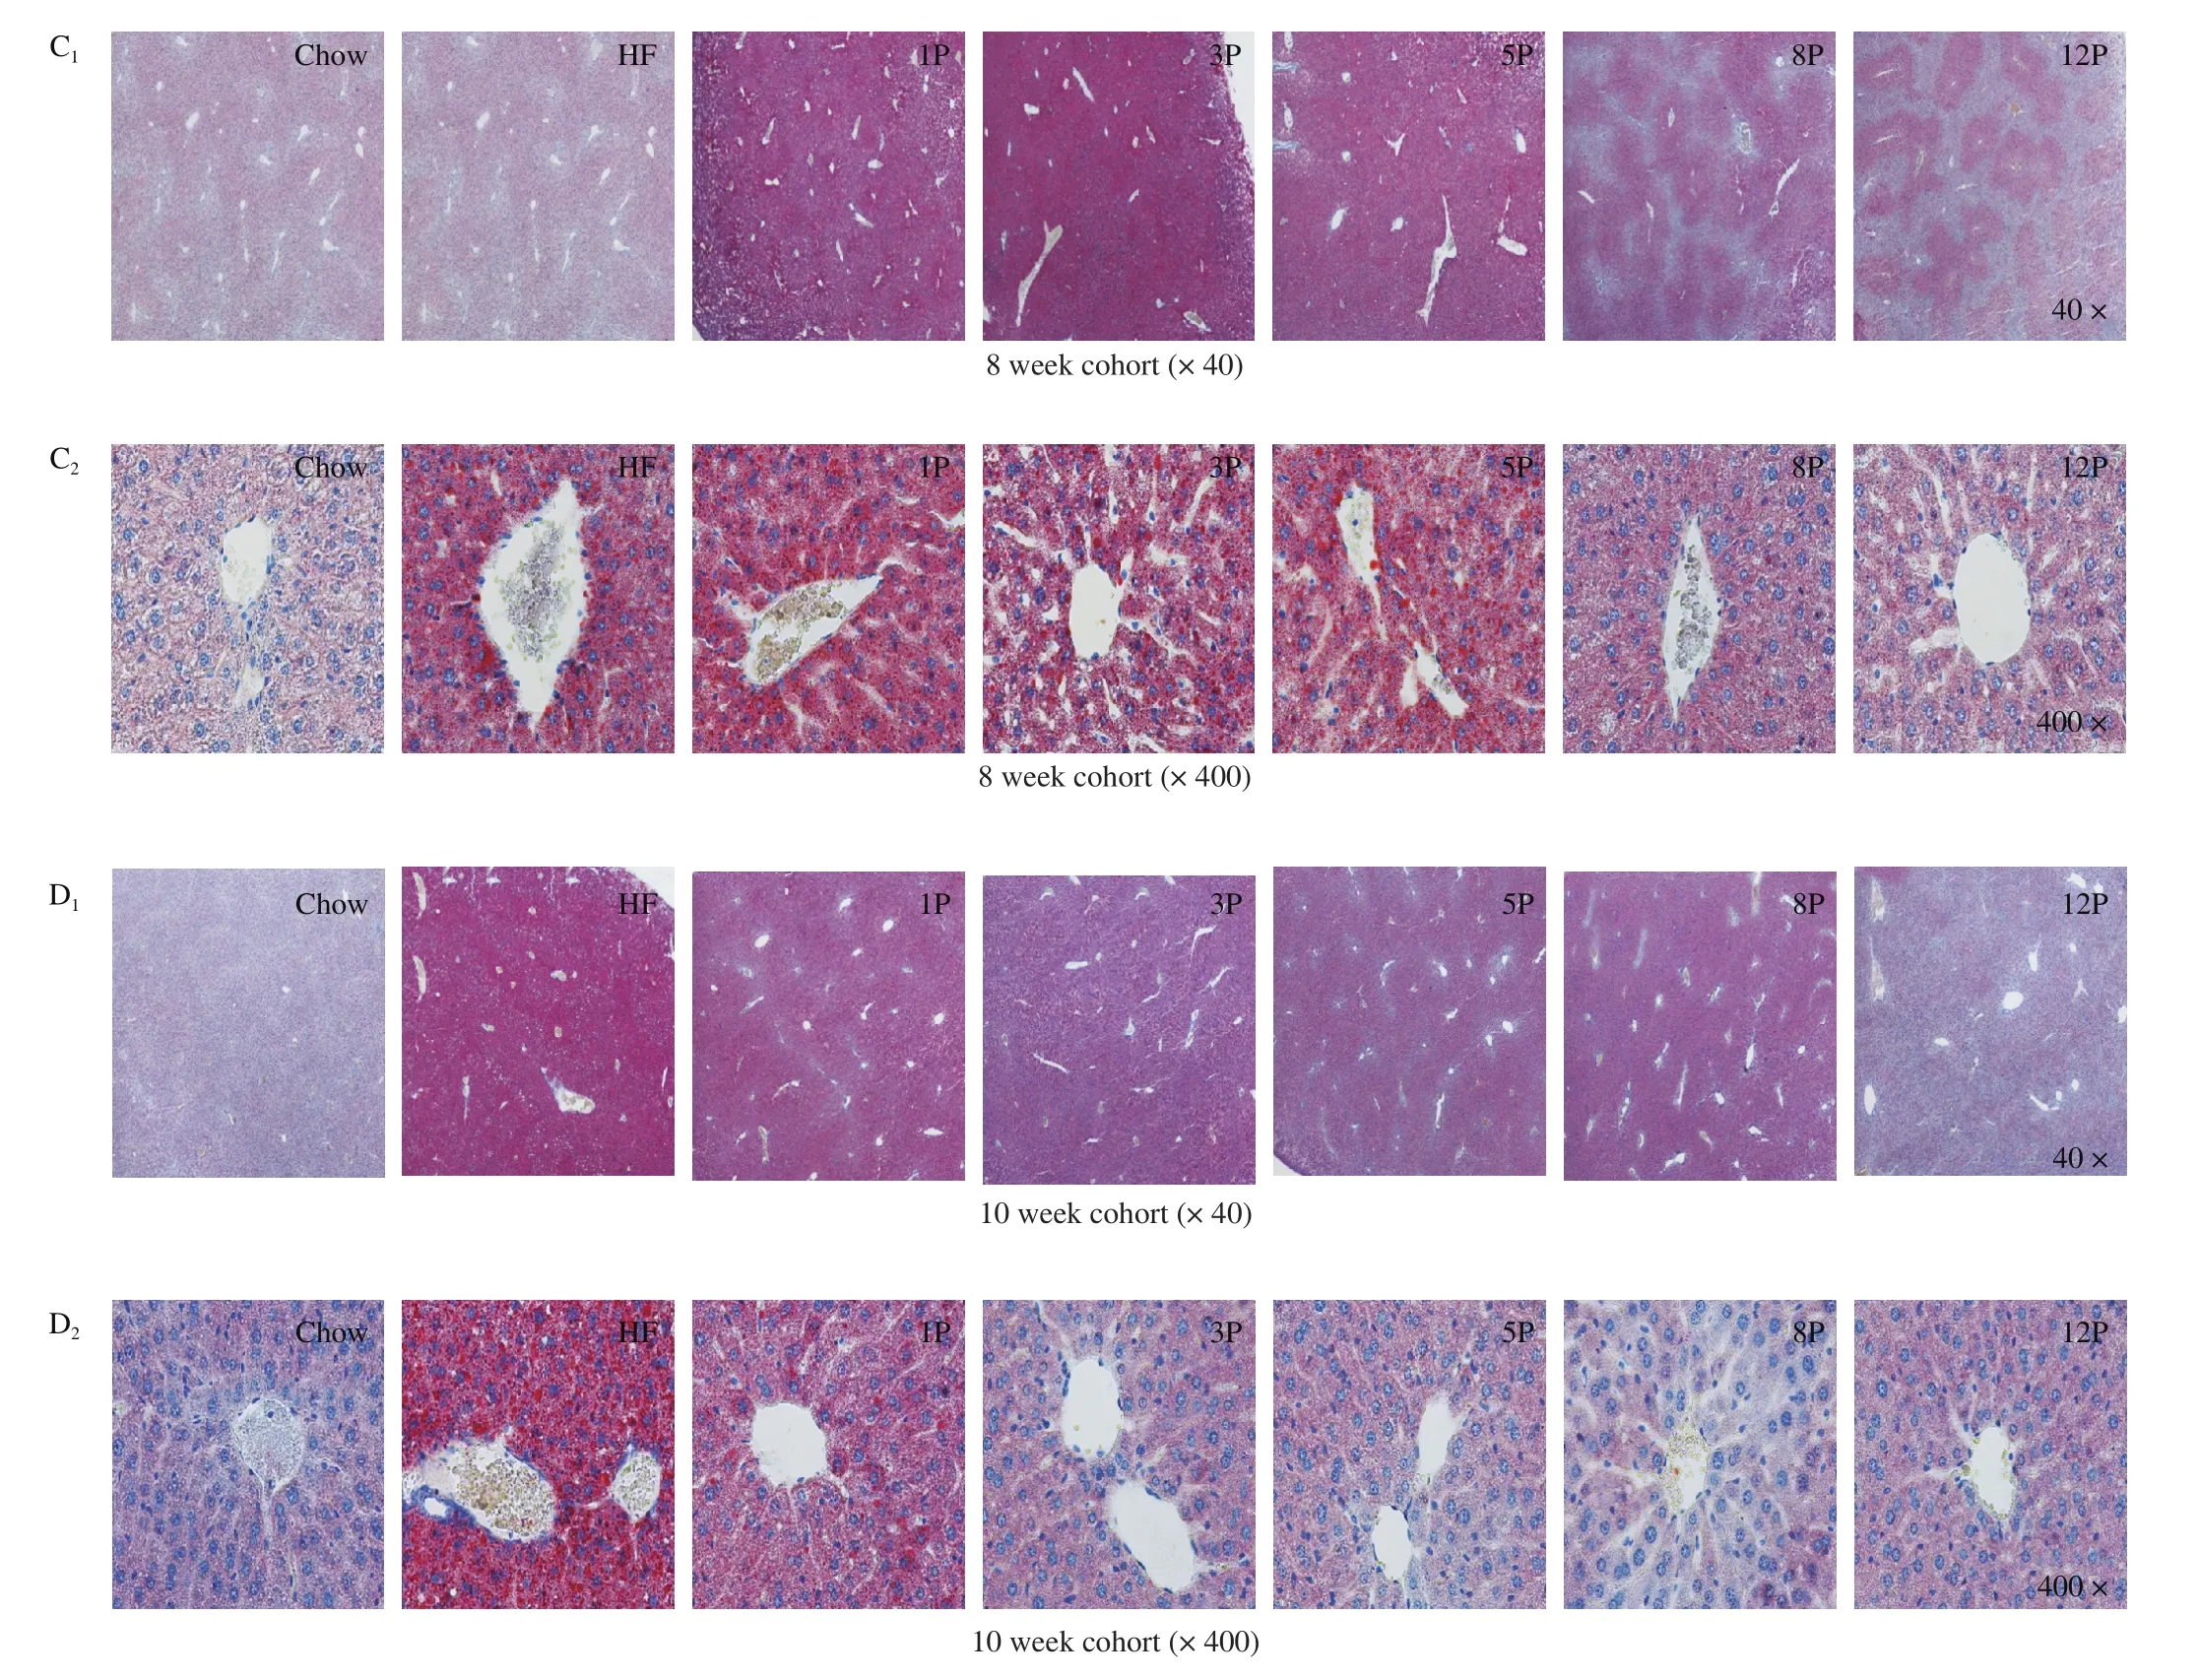
Fig.3(Continued)
3.6 Intestinal morphology and histological analysis
The tissue mass of cecum and colon, as well as the histological analysis of colonic mucous membrane are depicted in Fig.4.Compared with the Chow mice in the 8-week cohort, HF diet decreased the mass of cecal digesta (from 0.15 g to 0.09 g, Fig.4A1)and colonic digesta (from 0.08 g to 0.04 g, Fig.4B1), and increased the mass of cecal wall (from 0.06 g to 0.09 g, Fig.4C1).However,pectin supplement increased the cecal digesta mass, and further decreased colonic digesta mass when compared to the HF mice.Besides, the cecal digesta mass indicated an elevated tendency towards pectin content of 1% to 12%, presentingR2of 0.822.The intestinal images in Fig.4E1revealed that mesentery fat of the HF mice was greatly accumulated than others, but the fat development was suppressed by pectin administration.Meanwhile, mesentery fat sizes and fecal sediment amount in rectum of the HF-P mice were also negatively correlated with increasing dosage of the pectin.Especially,no conspicuous mesentery fat and fecal accumulation was found in the 8P and 12P mice.Furthermore, infiltrative lamina propria, damaged mucosa and slender mucosa cell were observed in the histological image of the HF mice (Fig.4F1).Conversely, pectin with 5%, 8% and 12% relieved these symptoms, showing enhanced crypt depth (121.63,129.08, and 136.40 μm, respectively) in comparison with that of the HF mice (86.09 μm), as indicated in Table S2.
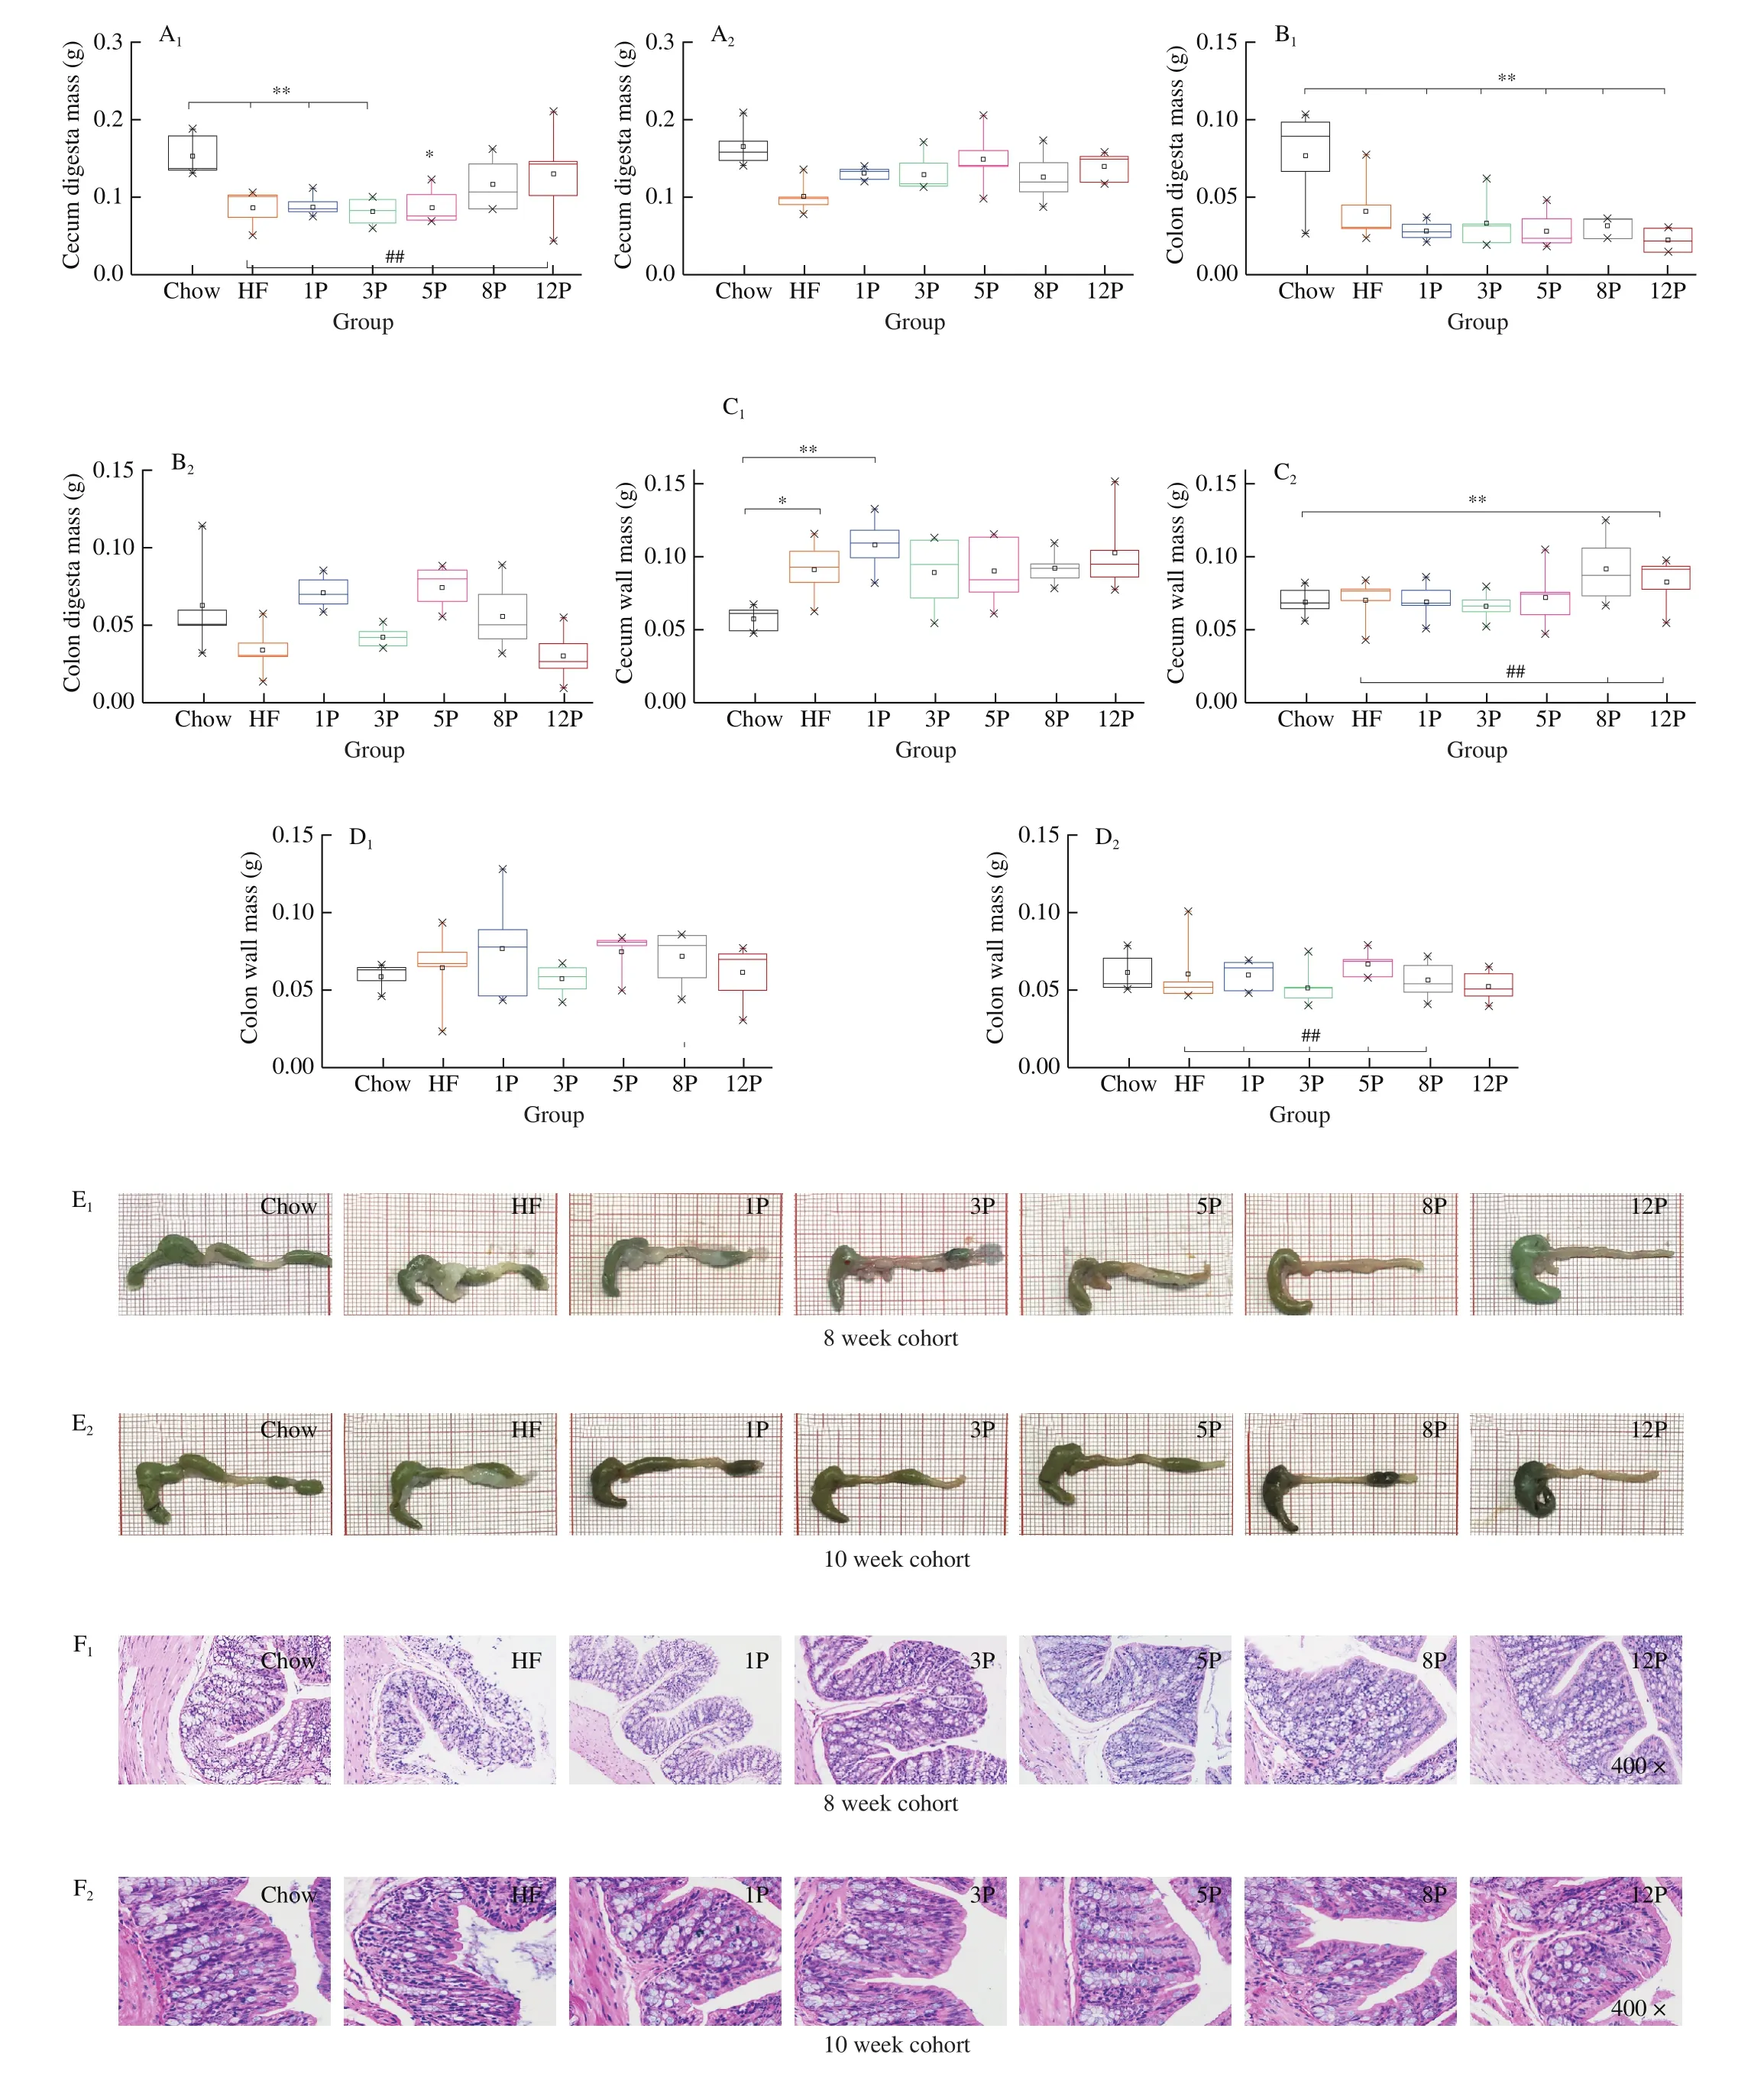
Fig.4 Intestinal environment of mice in the Chow, HF and HF-P groups in the 8-week (1) and 10-week cohort (2).(A) cecal digesta mass; (B) colonic digesta mass; (C) cecal wall mass; (D) colonic wall mass; (E) intestinal photograph; (F) representative histological images of colon by H&E staining (400 ×).*0.01 < P ≤ 0.05, **0.001 < P ≤ 0.01, vs.Chow group; #0.01 < P ≤ 0.05, ##0.001 < P ≤ 0.01, vs.HF group.
As for the mice in the 10-week cohort, the intestinal digesta were increased and the wall mass of the HF and HF-P mice were decreased than those of the mice in the 8-week cohort.Moreover, all the groups had no difference in terms of cecal and colonic digesta mass, but the cecal wall mass (Fig.4C2) was higher in the mice of 8P (0.13 g)and 12P (0.14 g) than the HF (0.10 g,P< 0.01).Besides, the colonic wall mass (Fig.4D2) of the 1P (0.07 g), 5P (0.07 g), 8P (0.08 g) were higher than the HF (0.03 g,P< 0.05).Correspondingly, the mesentery fat was disappeared (Fig.4E2), and healthy mucosa cells were found in all the HF-P mice (Fig.4F2).
3.7 SCFA
The effects of different diets on the concentrations of individual SCFA in rectal feces are displayed in Table 2.In the 8-week cohort, significant lower amounts of acetic acid, propionic acid and butyric acid were observed in the HF mice (5.97, 0.34, 0.14 μmol/g,respectively) than those of the Chow mice (7.52, 0.51, 0.25 μmol/g,respectively).As compared with those of the HF mice, mice from the 3P to 12P generated significant increases in the concentrations of acetic acid (from 7.39 μmol/g to 14.67 μmol/g,R2= 0.955), propionic acid (from 0.42 μmol/g to 1.49 μmol/g,R2= 0.985) and butyric acid(from 0.18 μmol/g to 0.37 μmol/g,R2= 0.858).In addition, levels of the individual SCFA of the mice in 5P, 8P and 12P groups were all higher than those of the Chow mice.After being replaced by a chow diet for 2 weeks, the contents of SCFA in the 1P, 3P and Chow mice significantly increased (P< 0.05), while decreased in the 5P, 8P and 12P mice.
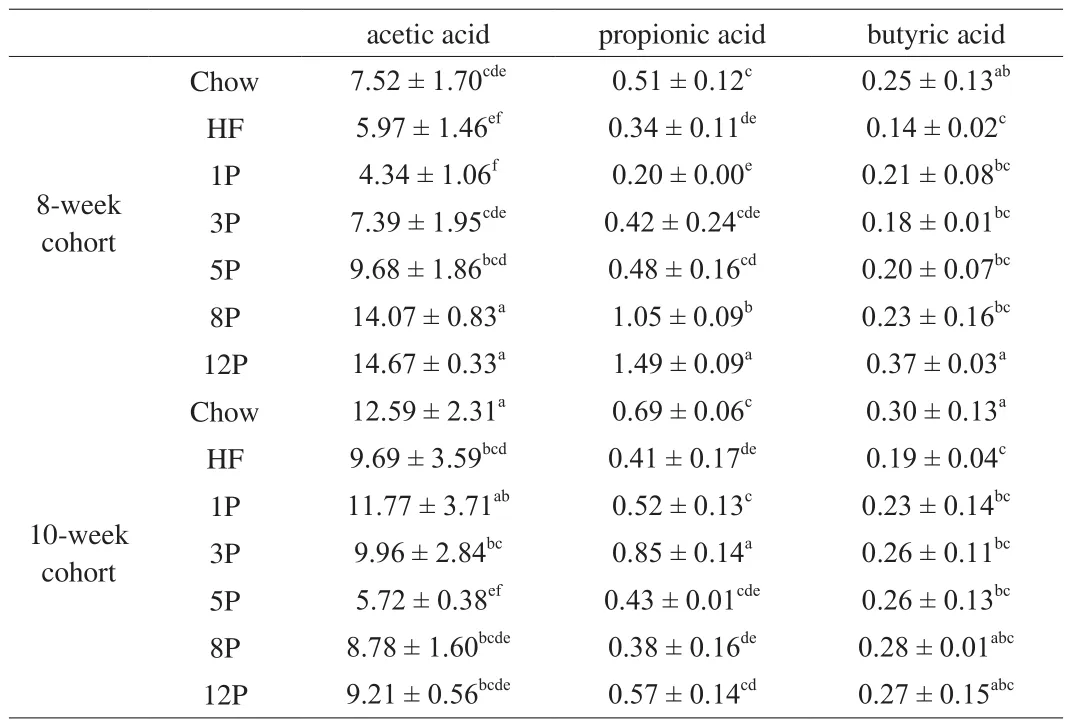
Table 2SCFA contents of mice fed with Chow diet, HF diet and HF with different dose of pectin diet in the 8-week and 10-week cohort.
3.8 Gut microbiome composition
3.8.1 Bacterial diversity
One Domain, 1 Kingdom, 10 Phylum, 16 Class, 22 Order, 44 Family, 111 Genus, 191 Species and 474 OTU were identified according to the 16S rRNA gene sequence.As seen in Fig.5A,species number in genus level was highest in the Chow group (93),followed by the 3P (84), 5P (81), 1P (80), 8P (72), HF (64) and 12P(61) in the 8-week cohort, while the species numbers in the HF, 3P and 12P increased to 81, 93 and 74, respectively in the 10-week cohort.Additionally, no difference was observed for specie number in the HF-P groups except the 3P mice.
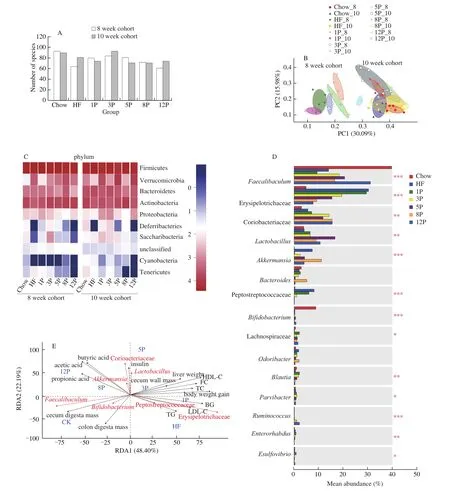
Fig.5 Microbiota analysis of mice in the Chow, HF and HF-P groups in the 8-week and 10-week cohort.(A) number of species; (B) PCoA plots of in different groups based on the unweighted unifrac metrics; (C) heatmap of classifiable bacteria at phylum level; (D) mean abundance of bacteria at genus level;(E) correlation analysis by RDA.The differences among the mean abundance of top 15 bacteria were investigated by Kruskal-Wallis H test.*0.01 < P ≤ 0.05,**0.001 < P ≤ 0.01,***P ≤ 0.001.
Richness indices (Sobs, Chao1, ACE) and diversity indices(Shannon, Simpson) are indicated in Table 3.The highest richness indices were found in the Chow mice at 8th week, whereas the lowest was the HF mice.However, the richness indices were significantly improved in the HF-P groups as compared with those of the HF mice.There were descending trends of Sobs, Chao1 and ACE index from 1% to 12% dosage, representingR2of 0.986, 0.967 and 0.992,respectively.Moreover, when compared with the Chow mice and HF mice, Shannon index was higher in the HF-P groups, and the Simpson index was lower, indicating better bacterial diversity regulated by pectin supplement.In the 10-week cohort, all the richness and diversity indices were increased than those of the 8-week cohort, and the highest of these index were in the 3P mice.
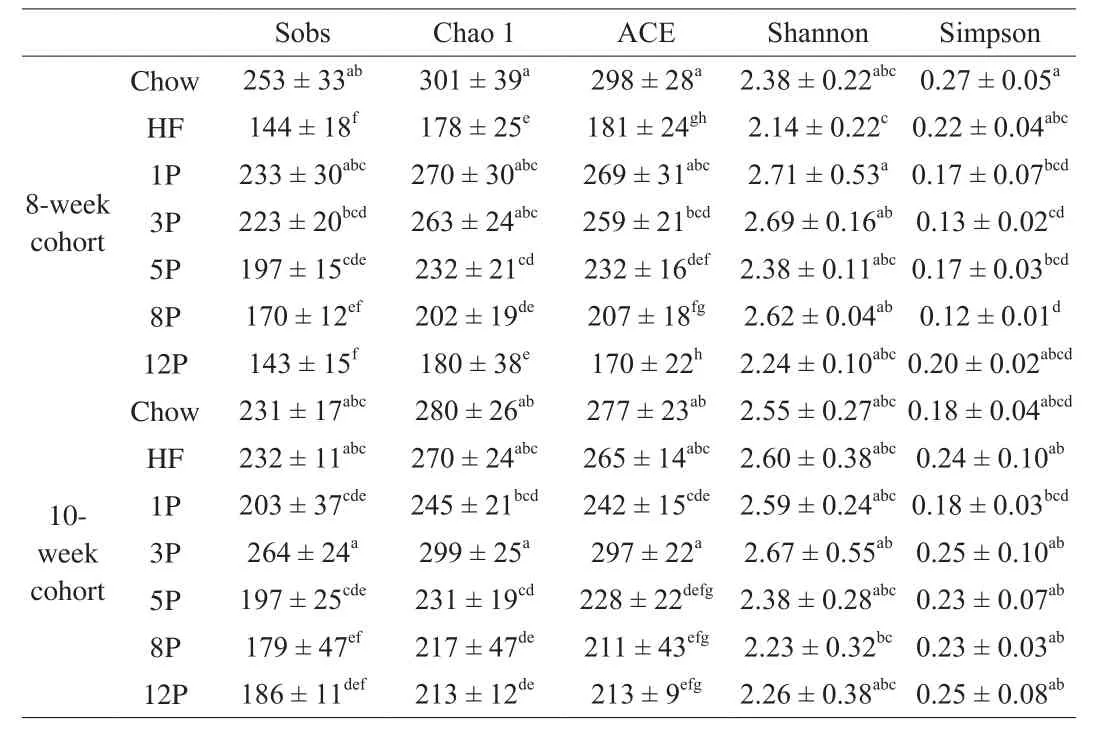
Table 3Number of OTUs (≥ 97% sequence similarity threshold) per diet, as well as the mean species richness indices (Sobs, Chao 1 and ACE) and diversity indices (Shannon and Simpson).
3.8.2 Species differences between diet groups
Fig.5 B showed an overall bacterial community structure derived from PCoA analysis, and pectin dosage markedly affected theβ-diversity of the bacterial community.The bacterial composition of 12P groups in the 8-week cohort were similar to that of the 10-week cohort.The heat map of microbial profiles at the phylum level was generated and shown in Fig.5C.In the 8-week cohort, lower relative abundances of Actinobacteria, Deferribacteries, Saccharibacteria and Cyanobacteria, while greater abundances of Verrucomicrobia and Tenericutes were observed in the HF mice in comparison to those of the Chow mice, while pectin supplement counteracted these effects induced by HF diet.The abundances of Verrucomicrobia declined from 1P to 12P, which showed dose-sensitive manners with the graded pectin consumption.The abundances ofDeferribacteries and Saccharibacteria of mice increased in the 1P and 3P but reduced in the 5P, 8P and 12P.After simultaneously breaking HF and pectin diets, the abundance of Bacteroidetes, Saccharibacteria and Cyanobacteriaof the HF and HF-P groups increased in the 10-week cohort.The mean abundance of major bacterial genera (top 15) in the 8-week cohort were quantified and significance test of difference between groups were carried out using Kruskal-Wallis H test in Fig.5D.The results demonstrated that the abundance ofFaecalibacteriumdecreased in mice fed with HF diet, but increased by pectin supplement from 1% to 12% withR2of 0.963 (data of 8P was excluded).Conversely, the abundance of Erysipelotrichaceae showed an opposite trend and presentedR2of –0.924.Moreover, the abundances of CoriobacteriaceaeandRuminococcuswere upgraded in the HF and HF-P groups, in which dose-dependent correlations were observed for the HF-P groups withR2of 0.936 (data of 3P was excluded) and 0.974, respectively.In addition, the abundances ofBlautia,ParvibacterandEnterorhabdusof 1P mice were higher than those of the HF mice, and reduced from 3P to 12P.Significant correlations were found between the pectin dosage (3% to 12%) and the abundances ofBlautia,EnterorhabduswithR2of –0.948 and–0.961, respectively.In comparison with HF mice, the abundance ofAkkermansiasubstantially reduced in the HF-P groups, while that of theLactobacillus, Lachnospiraceae andBifidobacteriumincreased,and no dose-sensitive manner was apparent.
3.8.3 Redundancy analysis
Fig.5 Erevealed that liver weight, cecal wall mass, blood glucose and serum profiles had highly relevance with weight gain.Moreover,Peptostreptococcaceae, Erysipelotrichaceae andLactobacillushad positive correlations with serum profiles.Coriobacteriaceae,Lactobacillus,Akkermansia,FaecalibaculumandBifidobacteriumhad positive correlations with SCFA contents and negative correlations with body-weight gain.Furthermore, the predominant bacteria of the Chow mice wereFaecalibaculumandBifidobacterium, for the 5P, 8P and 12P mice wereFaecalibaculumand Coriobacteriaceae, and for the HF mice were Peptostreptococcacea and Erysipelotrichaceae.
4.Discussion
The apple pectin used in this study was classified as a kind of food additive, which was a highly-branched polygalacturonic polymer linked with various neutral sugar, e.g.rhamnose, arabinose, galactose,glucose and xylose by glycosidic bonds (Table 1).Nevertheless,pectin could be completely deconstructed by a pectinolytic enzyme system produced by intestinal bacteria [22].The lyase and hydrolase were considered as the main pectate degradation enzymes, and the pectate lyase was reported to be secreted byBacteroidesandClostridium butyricum[7,23].Previous study demonstrated that HF diet played an important role in pathological development of obesity, which was associated with alternative proportions of bacterial species [24].
Pectin consumption suppressed HF-induced weight gain and adipose development (Fig.1), reduced BG and TG elevations (Fig.2),which showed dose-sensitive manners with the increasing pectin supplement.These phenomena were in agreement with previous studies focusing on the relationships between pectin dosage with weight gain induced by HF diet [3,12], SCFA production [14], TC and LDL-C levels [25].Notably, pectin with 8% and 12% dosage were found to counteract harmful effects of HF diet in terms of weight gain, typical adipose mass and serum lipids level.It was indicated by the significant differences (P< 0.01) of these physiological indices observed among the HF, 8P and 12P mice.Moreover, a high correlation coefficient between pectin dosage and weight gain was determined (Fig.1A1), verifying other reports about dose-sensitive response of pectin on weight regulation [9,26].Meanwhile, food intake of the HF-P mice was also lower than that of the Chow mice,demonstrating appetite suppression effect of pectin administration.According to Covasa et al.[8], pectin prolonged gastric emptying owing to its high water-binding capacity, and gave a feeling of satiety since it raised circulating concentrations of gut satiety hormones that released by GPR41 and GPR43, e.g.GLP-1 and PYY.These hormones were promoted by acetate or propionate during bacterial fermentation, thus preventing the interaction of food with intestinal enzymes and further intestinal transit [27].As a result, significant higher contents of SCFA (P< 0.01, Table 2) found in HF-P mice than Chow mice might be associated with lower food intake (Fig.S2B).When HF and HF-P diets were replaced by chow diet, the weight gain and adipose mass decreased and restored to normal levels.Additionally, there was no difference in these physiological indices among all the HF-P groups and Chow group.
Adipocytes are the functional units of adipose tissue, and their size depends on the volume of lipids stored [28].In this study, stained sections of subcutaneous fat (Fig.1), liver (Fig.3) and mesentery fat(Fig.4E) showed that pectin ameliorated adipose tissue hypertrophy in a dose-dependent manner.This study revealed that pectin significantly decreased liver weight (Fig.3A) and reduced excessive fatty infiltration (Fig.3C) with 5% and 8% dosage, respectively.The lowered fat-pad weight and reduced cell size (Fig.1)viapectin treatment could be a consequence of reduced energy intake due to the significant difference of feed conversion among Chow, 8P and 12P mice (Fig.S1C1).Besides, Kasubuchi et al.[24]explained that SCFA were demonstrated to ameliorate adipose-specific insulin signaling,thus resulted in less accumulation of white adipose tissues.Tian et al.[29]further claimed that fat weight was inversely correlated with butyrate concentration of caecal digesta.On the other hand, the lowest liver weight, as well as a histological image without hepatocyte lipid deposition and steatosis were obtained by the 12P mice both in the 8-week and 10-week cohorts.This phenomenon implied a long-term effect of pectin on liver steatosis alleviation, which was based on a high-dose supplement (about 12%).Shtriker et al.[30]found that Proteobacteria in mice developed fatty liver induced by HF diet.Jiang et al.[3]described that pectin decreased the content of hepatic TNF-α and IL-6, and further attenuated hepatic inflammation.Accordingly,the improvement of liver steatosis of 8P and 12P mice might be coincident with the declined percentage of Proteobacteria(Fig.5C)and higher butyrate concentration(Table 2).
In addition, this study showed that pectin consumption achieved hypolipidemic and hypoglycemic functions (Fig.2).Meanwhile,the results further illustrated the dose-sensitive changes of BG and TG withR2of –0.763 and –0.879, respectively.Besides, positive correlations among BG, lipid profiles with weight gain (Fig.5E) were presented, which confirmed the earlier studies that better glucose tolerance, lower BG and TC concentration could be ascribed to reduction of the fat mass [30].Moreover, the dose-sensitive changes of BG and TG with higherR2could contribute to the increasing abundance ofLactobacillusandRuminococcus(Fig.5D).This study also approved the statement thatBifidobacteriumwas inversely correlated with adiposity and glucose intolerance [31].Hu et al.[25]added thatBifidobacteriumplayed a role in reducing the level of serum TC and LDL-C.In this study, Fig 5E showed that Peptostreptococcaceae and Erysipelotrichaceae had positive correlations with serum profiles.After simultaneously breaking HF and HF-P diet, the levels of serum profiles declined, and the reductions in the 5P, 8P and 12P mice were smaller, indicating that pectin with a high dosage could decrease serum lipid levels to relatively lower levels.
Pectin alleviated defecation and colonic injury induce by HF diet.Pectin increased the mass of cecal digesta as an elevated amount of pectin withR2of 0.82 (Fig.4A1).Meanwhile, the increased cecal wall mass (Fig.4C1) and cecal size (Fig.4E1) in the HF-P mice denoted to the bigger absorptive surface area as compared with the HF mice.It was probably attributed to biomass increasement because of greater fermentation in the cecum [32].Also, the dosage of pectin consumption was negatively related to fecal sediment in the rectum,and the feces were absent in the 8P and 12P mice (Fig.4E1), showing the effect of pectin on inhibiting fat development and promoting defecation.It may due to the polymeric and hydrophilic nature of pectin, and supported scientific evidence for constipation treatment through dietary fibre administration [30].Additionally, pectin recovered the colonic damage and increased the numbers of crypts per unit area from 5% to 12% dosage (Fig.4F1).It could be attributed to alterations in cell proliferation of colonic mucous membrane [33].Fukunaga et al.[10]claimed that bacterial fermentation of dietary fibre in the caecum and colon produced SCFA (e.g.acetic, propionic and n-butyric acids), which in turn induced cell proliferation in the lower intestinal tract.After breaking HF and pectin consumption, the mass of the cecum and colon wall of the HF-P mice were quite stable,indicating the lasting effect of pectin on the intestinal environment.It could be explained by the higher content of butyrate in the HF-P mice than the HF mice (Table 1), since butyrate was recognized as a main energy source for colonocytes, promoting the integrity of intestinal mucosa [24].
Based on the above-mentioned analysis, the dose-sensitive changes of the obesity-related physiological indices were partially regulated by gut microbiota community and SCFA production.Firstly, the number of microbial species (Fig.5A) andβ-diversity (Fig.5B) were improved in the HF-P mice compared to the HF mice.Lobo et al.[32]reported that obese mice have less microbial diversity than normal individuals,while another study claimed that pectin did not increase microbial diversity of patients from fecal microbiota transplantation [34].We considered that the pectin supplement helped to inhibit changes of microbial communities induced by HF diet, but failed to restore them to normal levels.Moreover, the changes in bacterial communities were modulated by graded pectin intervention in this study.At the genus level (Fig 5D), the abundance ofFaecalibacterium, Coriobacteriaceae andRuminococcuswere increased, while the population of Erysipelotrichaceae and Pepstreptococcaceaewere reduced, which showed dose-sensitive manners.Importantly,Faecalibaculum,Lachnospiraceae,Ruminococcus,BacteroidesandBifidobacteriumhave been illuminated to serve as carbohydrate-degrading bacteria that can degrade pectin complex [7,22,23].As a result, the abundances of carbohydrate-degrading bacteria increased as the pectin dosage up-graded.The abundance ofAkkermansiawas sharply increased by HF diet, and quickly decreased by pectin at the low dosage (1%).It was in agreement with the finding of Jakobsdottir et al.[35]who confirmed that the growth ofAkkermansiamodulated by pectin was related to HF-induced obesity control.
Furthermore, pectin also dose-dependently generated an increase in SCFA, which was in response to the increased abundance of SCFA-generating bacteria.The RDA analysis revealed thatFaecalibaculum,CoriobacteriaceaeandLactobacillushad positive correlations with acetate, propionate, and butyrate, and negative correlation with body weight gain (Fig.5E).Onumpai et al.[36]also reported thatBifidobacteriaused neutral constituents of oligomers to produce SCFA.As a consequence, the growth ofBifidobacteriawas ascribed to the utilization of arabinose, glucose and galactose in the apple pectin (Table 1).According to the study of Gao et al.[37]acetate was typically producedviapectin fermentation byBifidobacteriumandLactobacillus, leading to low level of weight gain and insulin resistance.Propionate was partially generated byBacteroides, which played a role in reducing inflammation, lipogenesis and glucose uptake [22].Faecalibaculumused pectin to boost butyrate formation,contributing to obesity control and insulin resistance regulation [36].Additionally,Akkermansiawas another propionate-producer that improved metabolism in obese and diabetic mice [38].Therefore,the dose-sensitive increases in the acetic, propionic and butyric acids were possibly due to the growth ofBifidobacterium,BacteroidesandFaecalibaculumin presence of pectin.In this case, we confirmed the fact that the modulation of gut bacteria and their beneficial metabolites deriving from microbial fermentation of pectin helped to suppress HF-induced adipose development as well as serum glucose and triglyceride elevation, therefore alleviating obesity in a dosesensitive manner.
5.Conclusion
This study indicated the obesity-related body weight gain,subcutaneous adipose accumulation and serum triglyceride elevation were highly related to the dose-sensitive responses of special microbial population and SCFA productions.Moreover, pectin with 8% and 12% dosage counteracted the harmful effects induced by HF diet, which were restored to normal levels when withdrew pectin supplement.Besides, significant attenuation for colonic injury and liver steatosis in obese mice were observed with 5% and 8% pectin supplement, respectively.Furthermore,pectin suppressed adipose accumulation, increased intestinal wall mass, alleviated colonic injury and liver steatosis after breaking pectin consumption.Therefore,dose-dependent effects of pectin on alleviating HF-induced obesity and long-term influences were illustrated.
Conflict of Interest
The authors declare that there is no conflict of interests regarding the publication of this article.
Acknowledgments
This work was supported by Agricultural Science and Technology Innovation Project (CAAS-ASTIP-2021-IFST-04) and Central-level Public Research Institutes Basic Research Business Expenses Special Fund (S2021JBKY-17).
Compliance with ethics requirements
All experimental procedures conformed to the Guidelines of Experimental Animal Administration published by the State Committee of Science and Technology of China, and which also be carried out in accordance with U.K.Animals (Scientific Procedures)Act, 1986 and associated guidelines, EU Directive 2010/63/EU for animal experiments and the National Institutes of Health guide for the care and use of Laboratory animals (NIH Publications No.8023,revised 1978).The number of approval given by the ethical committee was 20190012YFA-3R.
Appendix A.Supplementary data
Supplementary data associated with this article can be found, in the online version, at http://doi.org/10.1016/j.fshw.2021.07.015.

- 食品科学与人类健康(英文)的其它文章
- Docosahexaenoic acid-rich fish oil prevented insulin resistance by modulating gut microbiome and promoting colonic peptide YY expression in diet-induced obesity mice
- Verification of Lactobacillus brevis tolerance to simulated gastric juice and the potential effects of postbiotic gamma-aminobutyric acid in streptozotocin-induced diabetic mice
- Safety assessment of monosodium glutamate based on intestinal function and flora in mice
- Sulforaphane attenuates dextran sodium sulphate induced intestinal inflammation via IL-10/STAT3 signaling mediated macrophage phenotype switching
- Foxtail millet supplementation improves glucose metabolism and gut microbiota in rats with high-fat diet/streptozotocin-induced diabetes
- Structural characterization of oligosaccharide from Spirulina platensis and its effect on the faecal microbiota in vitro