Proteomics of serum exosomes identified fibulin-1 as a novel biomarker for mild cognitive impairment
Bo Chen , Li Song , Juan Yang, Wei-Ying Zhou Yuan-Yuan Cheng, Yu-Jie Lai,
Abstract Mild cognitive impairment (MCI) is a prodrome of Alzheimer’s disease pathology. Cognitive impairment patients often have a delayed diagnosis because there are no early symptoms or conventional diagnostic methods. Exosomes play a vital role in cell-to-cell communications and can act as promising biomarkers in diagnosing diseases. This study was designed to identify serum exosomal candidate proteins that may play roles in diagnosing MCI. Mass spectrometry coupled with tandem mass tag approach-based non-targeted proteomics was used to show the differentially expressed proteins in exosomes between MCI patients and healthy controls, and these differential proteins were validated using immunoblot and enzyme-linked immunosorbent assays. Correlation of cognitive performance with the serum exosomal protein level was determined. Nanoparticle tracking analysis suggested that there was a higher serum exosome concentration and smaller exosome diameter in individuals with MCI compared with healthy controls. We identified 69 exosomal proteins that were differentially expressed between MCI patients and healthy controls using mass spectrometry analysis. Thirty-nine exosomal proteins were upregulated in MCI patients compared with those in control patients. Exosomal fibulin-1, with an area under the curve value of 0.81, may be a biomarker for an MCI diagnosis. The exosomal protein signature from MCI patients reflected the cell adhesion molecule category. In particular, higher exosomal fibulin-1 levels correlated with lower cognitive performance. Thus, this study revealed that exosomal fibulin-1 is a promising biomarker for diagnosing MCI.
Key Words: Alzheimer’s disease; biomarker; diagnosis; exosomes; fibulin; mass spectrometry; mild cognitive impairment; tandem mass tag; cell adhesion molecule; nanoparticle tracking analysis 1College of Pharmacy, Chongqing Medical University, Chongqing, China; 2Department of Neurology, the First Affiliated Hospital of Chongqing Medical University, Chongqing Key Laboratory of Major Neurological and Mental Disorders, Chongqing Key Laboratory of Neurology, Chongqing, China; 3Department of Neurology, The Third Affiliated Hospital of Chongqing Medical University, Chongqing, China
Introduction 587 Methods 588 Results 589 Discussion 591
Introduction
Alzheimer’s disease (AD) is an age-related neurodegenerative disorder clinically characterized by loss of memory, cognition, and behavior functions (Cheng et al., 2018; Yepes, 2021). AD patient care and support have wideranging effects on families, the healthcare system, and society (GBD 2016 Dementia Collaborators, 2019; Manna et al., 2021). Previous research has caused a conceptual change in the AD field, and the disease course is now considered to be a continuum that includes a cognitively normal stage, a mild cognitive impairment (MCI) stage, and a dementia stage (Dubois et al., 2016). The disease process may start 15‒20 years before symptoms appear, which may be an appropriate point for initiating effective interventions (Dubois et al., 2016; Jia et al., 2021). These preclinical AD stages are now called subjective cognitive decline (SCD) and MCI (Rabin et al., 2017), which has become a major research focus.
MCI is associated with an increased risk of progression to dementia, particularly AS-related dementia (Bachurin et al., 2018), and it occurs along a continuum from normal cognition to dementia. During this period, cognitively impaired individuals demonstrate minimal impairment of instrumental activities of daily living (Sanford, 2017). Because MCI is a critical period in this disease, efforts should be made to decrease the MCI-to-dementia conversion rate (Qarni and Salardini, 2019). However, the relevant clinical tests are unconventional and insensitive, and early patient symptoms are not obvious. Cognitive impairment is often diagnosed during the dementia stage, which is considered to be too late for intervention. There are few methods that are optimal and reliable to screen patients at a preclinical AD stage (Mapstone et al., 2014; O’Bryant et al., 2015; Dubois et al., 2016). Thus, identifying appropriate markers for MCI is valuable.
Exosomes are a subtype of extracellular vesicle (EV). EVs are lipid bilayer vesicular bodies of cellular origin, and their diameter ranges from 50 to 2000 nm (Thompson et al., 2016; O’Brien et al., 2020). EVs can be classified into the following three subtypes on the basis of their biogenesis: exosomes; micro-vesicles; and apoptotic bodies (You and Ikezu, 2019). EVs are thought to be involved in the pathogenesis of neurogenerative diseases because of their protein disposal function (Ilieva et al., 2009; Vanden Broeck et al., 2014). This may accelerate or suppress protein aggregate formation, and unfolded or misfolded protein aggregate toxicity may contribute to neurodegenerative diseases. Exosomes were recently shown to play a key role in intercellular communication because they can be secreted by whole cells in the brain (Kalluri and LeBleu, 2020). Exosomes in the nervous system can carry the amyloid precursor protein (APP) and its catabolites from cell to cell and participate in the pathological process of AD (Zhang et al., 2021). This, it is feasible to use exosomal proteins as biomarkers to diagnose AD on the basis of the exosome characteristics.The aim of this study was to identify diagnostic biomarkers for MCI. We characterized serum exosomal proteins in MCI patients and healthy controls and identified and validated fibulin-1 as a potential biomarker that might be involved in MCI diagnosis and progression.
Methods
Patients recruitment
From June 2020 to April 2021, 40 participants were recruited from The Third Affiliated Hospital of Chongqing Medical University (n
= 40; 20 MCI patients and 20 healthy controls). Among these participants, healthy controls were enrolled from the medical examination center at the hospital. MCI patients in our study were diagnosed using the National Institute on Aging and the Alzheimer’s Association (NIA-AA) core criteria (Albert et al., 2011) at The Third Affiliated Hospital of Chongqing Medical University, which included the following: 1) cognitive concern; 2) impairment in one or more cognitive domain; 3) preserved function; and 4) no dementia. Our study only focused on MCI patients in AD, who memory was impaired and not affected by vascular, traumatic, or other medical causes. Patients with other suspected etiologies that could lead to memory decline were excluded in accordance with published reports and criteria (Mendonc¸a et al., 2004; Donaghy et al., 2015; Day et al., 2017) or other non-standard diagnostic procedures. Agematched individuals with normal cognition were recruited as healthy controls.The study was approved by the Ethics Committee for Human Research at Chongqing Medical University on May 20, 2020, and the study was conducted in accordance with the 1964Declaration of Helsinki
, as revised in 2013. All patients provided written informed consent for biomedical research before participation in the study.Isolation of exosomes from serum
Blood samples from a vein in the patient’s forearm were collected and placed into blood collection tubes, which were centrifuged at 2400 ×g
for 10 minutes to isolate the serum. Serum was aliquoted and stored at ‒80°C. Serum exosomes were isolated by sequential ultracentrifugation in accordance with a published procedure (Momen-Heravi et al., 2013; Momen-Heravi, 2017). Briefly, cell contamination was removed from blood by centrifugation at 300 ×g
for 10 minutes, and the remaining sample was centrifuged at 2000 ×g
for 10 minutes to eliminate apoptotic bodies and large cellular debris. The remaining sample was then centrifuged at 10,000 ×g
for 30 minutes to remove large micro-vesicles. After centrifugation, the supernatant was filtered using a 0.22-µm microporous filter head (Millipore, Bedford, MA, USA) in 10-mL ultracentrifugation tubes (Thermo Fisher Scientific, Waltham, MA, USA). Exosomes were then collected by ultracentrifugation at 100,000 ×g
for 70 minutes and were subsequently washed in phosphate-buffered saline (PBS) and pelleted again by ultracentrifugation at 100,000 ×g
in a T-890 rotor (Sorvall WXultracentrifuge, Thermo Fisher Scientific). All centrifugation steps were performed at 4°C. The exosome pellet was resuspended in 30 µL of PBS for immediate use or stored at ‒80°C until further experimentation was performed.Transmission electron microscopy
For all participants, the size and concentration of exosomes were analyzed using transmission electron microscopy. Five microliters of each exosome sample were diluted to 10 µL with PBS, and was adsorbed using a copper grid for 1 minute. Excess liquid was removed with filter paper, and the grid was then floated briefly on a drop of water, blotted on filter paper, and then stained with phosphotungstic acid hydrate. After removing the excess phosphotungstic acid hydrate with filter paper and checking the grids, we examined the isolated exosome morphology in random fields using a Tecnai G2 Spirit Bio-twin transmission electron microscope (FEI, Hillsboro, OR, USA). The mean size of the isolated vesicles was 100 nm.
Nanoparticle tracking analysis
The exosome size and concentration were detected using nanoparticle tracking analysis (NTA), which was conducted using a nanoparticle characterization system (NanoSight NS300; Malvern Analytical, Malvern, UK) with fast video-capture and the corresponding software. Each sample was analyzed at least three times and post-acquisition settings were identical for all samples.
Western blot analysis
The protein levels in exosomes were detected using a Micro BCATM Protein Assay Kit (Thermo Fisher Scientific, 80815-500). Proteins were denatured in boiling water for 5 minutes. Equal amounts of proteins were separated by SDS-PAGE and then transferred to a polyvinylidene fluoride membrane (Millipore). The membrane was subsequently blocked with Tris-buffered saline containing 0.05% Tween-20 and 5% nonfat milk for 1 hour at room temperature. The membrane was then incubated with antibodies against CD9 (Abcam, Cambridge, MA, USA, ab236630, 1:1000; rabbit monoclonal antibody); CD63 (1:1000; rabbit monoclonal antibody; Abcam, ab134045, RRID: AB_2800495); TSG101 (1:1000; rabbit monoclonal antibody; Abcam, ab125011, RRID: AB_10974262); calnexin (1:1000; rabbit monoclonal antibody; Cell Signaling, Danvers, MA, USA, mAB#2679, RRID: AB_2228381); FBLN1 (1:1000; rabbit monoclonal antibody; Abcam, ab175204) that was used to detect fibulin-1; APP (1:1000; rabbit polyclonal antibody; MilliporeSigma, Burlington, MA, USA, A8717, RRID: AB_258409); and β-actin (1:1000; mouse monoclonal antibody, Abcam, ab8226, RRID: AB_306371) at 4°C overnight. The membrane was then washed and incubated with the corresponding secondary antibody for mice (1:5000; goat anti-mouse IgG(H+L); Proteintech, Wuhan, China, SA00002-1, RRID: AB_2890887) and rabbit (1:5000; goat anti-rabbit IgG(H+L); Proteintech, SA00002-2, RRID: AB_2752246) at room temperature for 1 hour. The protein bands were visualized using an enhanced chemiluminescence solution (Advansta Inc., San Jose, CA, USA, K-12045-D50) and an image analysis system (Tanon5200, Tanon Science & Technology, Shanghai, China). Relative protein expression was normalized to β-actin.
Sample preparation for data-dependent acquisition library generation
To construct a spectral library, protein from each sample was extracted in an appropriate amount and mixed into a pooled sample (approximately 600 µg). The consistency of the original samples was evaluated using SDS-PAGE. Sample digestion and fractionation were performed as previously described (Wisniewski et al., 2009). Briefly, all samples, including mixed pool samples, were enzymolyzed in a solution with trypsin, and dithiothreitol, which was added to a final concentration of 20 mM. The samples were incubated for 2 hours at 30°C and then cooled to room temperature. Next, we added an appropriate amount of indole-3-acetic acid to a final concentration of 25 mM, agitated the samples at 600 rpm for 1 minute. Samples were then incubated at room temperature and protected from excessive light for 30 minutes, after which an appropriate amount of NHHCObuffer (50 mM) was added to dilute the urea concentration to less than 1.5 M. Then, 40 µL of NHHCObuffer (2 µg Lys-C) was incubated with sample, which was subsequently agitated at 600 r/min at 37°C for 4 hours. Then, 2 µg of trypsin was incubated with the sample for 16 hours at room temperature. After desalting, the samples were lyophilized and redissolved in 0.1 % formic acid. The optical density at 280 nm was determined using a Nanodrop2000 (Thermo Fisher Scientific) to obtain the peptide concentration.
One-hundred micrograms of low-abundance peptides were separated from high-abundance peptides, and all components were collected using the highpH reversed phase (HPRP) method. Then, 2 µg of peptides were removed and mixed with an appropriate amount of indexed retention time standard peptides for data-dependent acquisition (DDA) mass spectrometry (MS) detection. MS analysis of each component was performed for 90 minutes.
Data-dependent acquisition mass spectrometry assay and data analysis
DDA MS includes characteristics of real-time MS/MS acquisition, and it was designed to produce a spectral library for a query database. DDA analysis was performed in accordance with previous research methods (Zhang et al., 2020a). Briefly, peptides were dissolved in buffer A (0.1 % formic acid), and the peptide mixture was then subjected to an analytical column in Easy nLC-1200 (Thermo Fisher Scientific). Peptides were eluted from the column using gradient buffer B (0.1% formic acid in acetonitrile) at a flow rate of 250 nL/min. The analytical column specifications were as follows: dimension, 75 µm × 250 mm; particle size, 1.9-µm; and packed column, C18. The parameter settings were used as previously described (Zhang et al., 2019, 2020a). A Q-Exactive HF mass spectrometer (Thermo Fisher Scientific) interfaced with an Easy nLC-1200 system in a data-dependent mode was used for the DDA runs. The MaxQuant software (Max Planck Institute of Biochemistry, Munich, Germany) was used to obtain the FSATA sequence for the DDA library data, and DDA raw files for the spectral library building were converted to MS2 files. The detailed parameters used were in accordance with parameters that were previously described (Vanden Broeck et al., 2014).Mass spectrometry assay for data-independent acquisition and data analysis
After generating the spectral library for the database query, peptides were separated and eluted as in the DDA analysis. Methods and parameter settings were operated in accordance with those in a previous study (Fernandez-Costa et al., 2020; Zhang et al., 2020a). A Q-Exactive HF mass spectrometer (Thermo Fisher Scientific) interfaced with an Easy nLC-1200 system in a dataindependent mode was used to conduct data-independent acquisition (DIA) runs. DIA scans were used in the range of 350‒1650 m/z. The parameter settings were as follows: resolution of (selected ion monitoring) full-scan: 120,000 at 200 m/z, AGC 3e6, injection time: 50 ms (maximum) on the basis of previous research (Fernandez-Costa et al., 2020; Zhang et al., 2020a). Bioinformatics analyses were performed on the results of the database search. The Q value was set as 0.01 for the cutoff point in the filtered results.
Bioinformatics analysis
The R package (https://www.r-project.org/) (R Version 4.0.4) (Zhang et al., 2019) was used to perform the analysis. Proteins were defined as differentially expressed with a |fold-change| > 1.5 and aP
value < 0.05. A hierarchical clustering heatmap was generated using ComplexHeatMap R package (R Version 3.4.4) (https://bioconductor.org/packages/release/bioc/html/ComplexHeatmap.html) (Gu and Hubschmann, 2021). The GO Plot package with R software was used to perform Gene Ontology (GO) enrichment analysis. TheP
value for GO terms < 0.5 were considered to be enriched. The sequence of differentially expressed protein were obtained from the Kyoto Encyclopedia of Genes and Genomes (KEGG) database (https://www.kegg.jp/) (Kanehisa et al., 2017). AP
value for KEGG terms < 0.5 was considered to be enriched.Weighted gene co-expression network analysis was performed using the R package to screen target proteins for disease diagnosis. Information about the protein interaction was obtained using the STRING database (http://stringdb.org/) (Szklarczyk et al., 2021), which was used to find target proteins that interact directly and indirectly. The protein-protein interaction (PPI) network was depicted using Cytoscape software (https://cytoscape.org/) (Shannon et al., 2003).
Enzyme-linked immunosorbent assay validation
Forty individual serum exosomal samples were used in the enzymelinked immunosorbent assay (ELISA) validation (Konstantinou, 2017). Fibulin-1 was analyzed using commercially available kits (Wuhan EIAab Biological Technology, Wuhan, China, Cat# E0136h), in accordance with the manufacturer’s instructions.Statistical analysis
SPSS statistical software (version 23.0; IBM Corp., Armonk, NY, USA) or GraphPad Prism (version 9.0; GraphPad Software, Inc., San Diego, CA, USA) were used to analyze the results. Data were presented as the mean ± standard deviation. A parametric or non-parametric test was used to analyze the results on the basis of the sample distribution. Categorical variable differences within groups, such as sex and risk factors, were applied using a chi-square test. Continuous variable differences between two groups were examined using a Welch’st
-test or the Wilcoxon rank-sum test. Correlation analysis was performed using Pearson’s correlation coefficient. Serum concentrations of the tested biomarkers with the best predictive value to distinguish between MCI patients and healthy controls were determined using an area under the receiver operating characteristic (ROC) curve analysis. Differences were considered to be significant whenP
< 0.05.Results
Participant characteristics
Table 1
summarizes the patients’ characteristics. There were an equal number of participants in both groups. Information about the participants in both groups included age, gender, apolipoprotein ε4 status, risk factors, and education level. As expected, Mini-Mental State Examination (MMSE) scores (Li et al., 2016) and Montreal Cognitive Assessment (MoCA) scores (Ziad S. Nasreddine et al., 2005) were lower in MCI patients compared with those in healthy controls (P
< 0.01).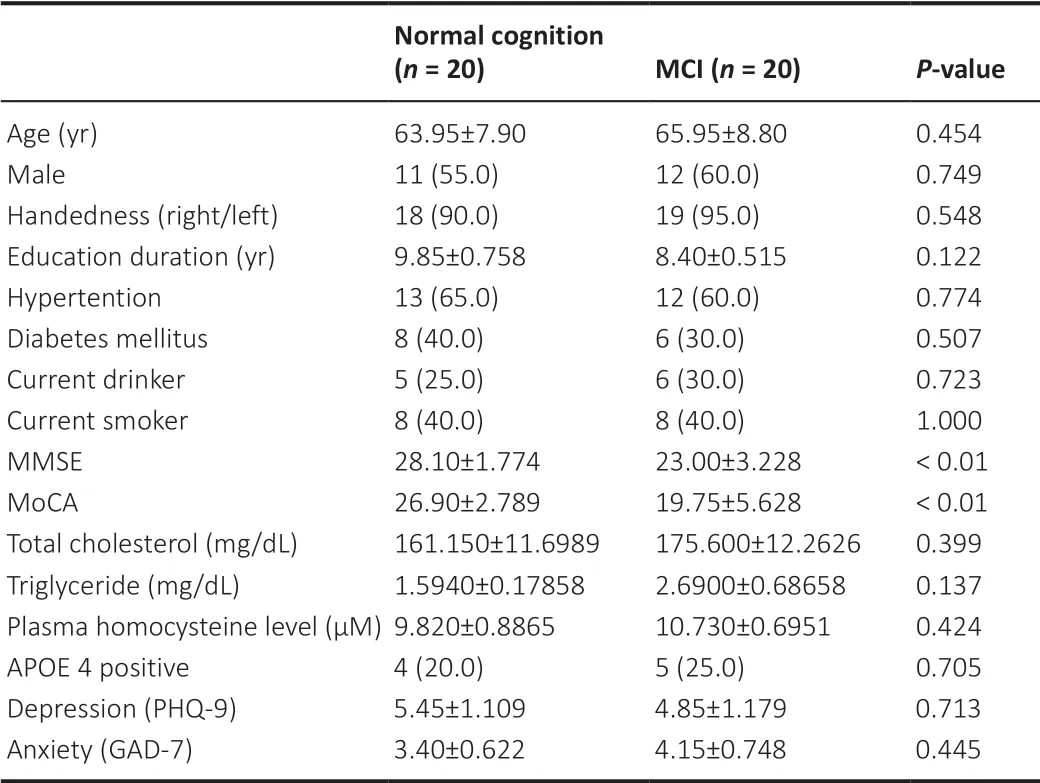
Table 1 |Demographic characteristics and risk factors of healthy controls (HC) and mild cognitive impairment (MCI) patients
Characterization of serum exosomes from MCI patients and healthy controls
Sample diagram shows the data-independent acquisition (DIA) experimental and analytical process (Figure 1
). Serum exosomes were detected using transmission electron microscopy and NTA and validated by western blot assays to confirm the exosomes were successfully isolated by ultracentrifugation. The nanovesicles showed a uniform size distribution and morphology (Figure 2A
) in the transmission electron microscopy images. To further identify exosomes, we detected TSG101, CD9, and CD63, which were exosomal markers, and there was no difference between the markers in healthy controls (Con11) and those in MCI patients (MCI11) (Figure 2B
). The specific endoplasmic reticulum protein calnexin, 90 kDa, which was used as a negative control, showed no expression in the serum exosomes isolated from U87 cells. This indicates that the exosomes were successfully extracted using ultracentrifugation methods.Exosome size analysis revealed that MCI patients had a smaller exosome mode size compared with that in healthy controls (P
< 0.05;Figure 2C
). For the serum exosome concentration, MCI patients showed a statistically significant increase in the serum exosome concentration compared with that in healthy controls (P
< 0.01;Figure 2D
).Proteomic analysis showed the difference in serum exosomal proteins between patients with MCI and healthy controls
MS was used to detect the exosome component extracted from serum of MCI patients and healthy controls. There were 2372 proteins that were identified in healthy controls and 2354 proteins that were identified in MCI patients (Figure 3A
). Sixty-nine differentially expressed proteins were identified between the two groups. Preliminary screening identified 39 up-regulated proteins and 30 down-regulated proteins in MCI patients compared with those in the controls (Figure 3B
). Among the 69 proteins, immunoglobulins were the most common protein family in MCI patients and healthy controls. Hierarchical cluster analysis of differentially expressed proteins in samples from the two groups was performed by cluster algorithm. The heatmaps suggested an obvious difference in protein abundance between the two groups (Figure 3C
). Subsequently, 69 proteins with significantly different concentrations were further analyzed using PPI, among which 11 core proteins were identified and are shown inFigure 3D
.GO annotation showed that the following three GO categories were involved: biological process (BP), molecular function (MF), and cellular components (CCs). GO enrichment analysis revealed that the proteins differentially expressed in MCI patients compared with those in control individuals were related mostly to the response to biological adhesion, cell adhesion, integrin binding, cell adhesion molecule binding, cell‒substrate junctions, cell‒substrate adherens junctions, focal adhesion, and adherens junctions, in which molecular functions were enriched in protein binding (Figure 4A
).The KEGG pathway analysis showed that differentially expressed proteins between the two groups were associated with cell adhesion molecules (CAMs), platelet activation, the Rap1 signaling pathway, hypertrophic cardiomyopathy, and other important pathways (Figure 4B
).Biomarker screening using weighted gene co-expression network analysis
Weighted gene co-expression network analysis was used to screen synergistically expressed proteins from proteins identified in DIA. Nine highly synergistic protein modules were identified (Figure 5A
). The MEpink module had the highest correlation coefficient and the lowestP
value (P
= 0.005), indicating that this is a key module among the differential proteins in both groups. We used a hierarchical cluster algorithm to analyze the differentially expressed proteins in two groups among the MEpink module (Figure 5B
). Subsequently, 13 proteins with different concentrations were further analyzed using protein-protein interaction, and some of these core proteins are shown inFigure 5C
. Proteins in the MEpink module were analyzed using GO/KEGG enrichment analysis to evaluate the enriched functional pathway of co-expressed proteins in the module. GO enrichment analysis was divided into BP, MF, and CC groups. GO enrichment analysis revealed that the differentially expressed MEpink proteins were mostly related to the response to coagulation, protein binding, and intracellular organelles (Figure 6A
). KEGG pathway enrichment analysis showed that focal adhesion, platelet activation, and other pathways important for differentially expressed MEpink proteins were markedly different between patients and healthy controls (Figure 6B
).Diagnostic value of each biomarker in serum exosomes
To further assess the diagnostic value of these biomarkers, ROC curve analysis was performed. R software was used to analyze the ROC curves and obtain the area under the curve (AUC) values of 20 proteins in MCI patients and healthy controls (Table 2
), and the top 10 AUC values of which are shown inFigure 7
. When selecting candidate biomarkers, the precursor fragment (AA -19 to 108), which is called A2NV54 in the UniProt database, fibulin-1, and the protein tweety homolog3 (TTYH3) showed a promising ability to diagnose MCI. The AUC values were 0.834, 0.810, and 0.794, respectively (Table 2
).
Figure 1 |Sample diagram of the data-independent acquisition (DIA) experimental and analytical processes.DDA: Data-dependent acquisition; DIA: data-independent acquisition; EV: extracellular vesicle; GO: Gene Ontology; KEGG: Kyoto Encyclopedia of Genes and Genomes; LC-MS/MS: xxx; MCI: mild cognitive impairment.
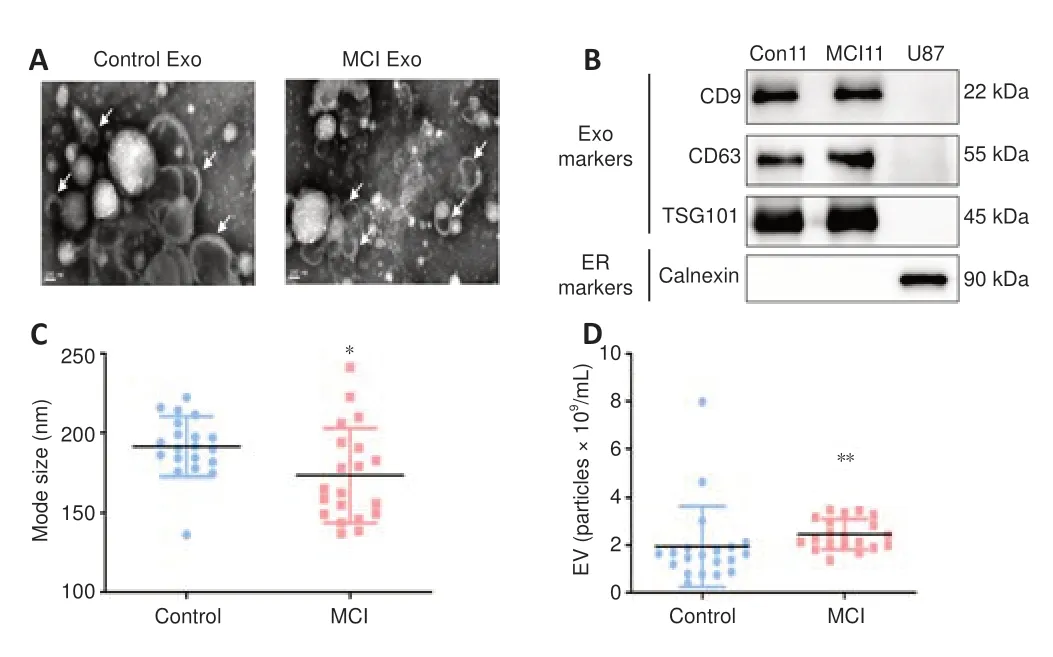
Figure 2 |Investigation of serum exosome characteristics between MCI patients and healthy controls.(A) Serum exosome extracted from healthy controls (left) and MCI patients (right), which was detected using transmission electron microscopy. The arrows indicate isolated vesicles. Bar = 100 nm. (B) Western blot shows proteins isolated from U87 cells or extracted from serum exosomes of a healthy control (Con11) and an MCI patient (MCI11), in which exosome (Exo) markers (CD9, CD63, and TSG101) and the endoplasmic reticulum (ER) marker (Calnexin) were detected. (C) Nanoparticle tracking analysis shows that the mode of serum exosomes from MCI patients was smaller than that of healthy controls (healthy control n = 20, MCI n =20). *P < 0.05, vs. Control (D) Nanoparticle tracking analysis shows that the serum exosome concentration from MCI patients was higher than that of healthy controls (healthy control, n = 20; MCI, n = 20 ) (**P < 0.01, Welch’s t-test). Data were presented as the mean ± SD. MCI: Mild cognitive impairment.
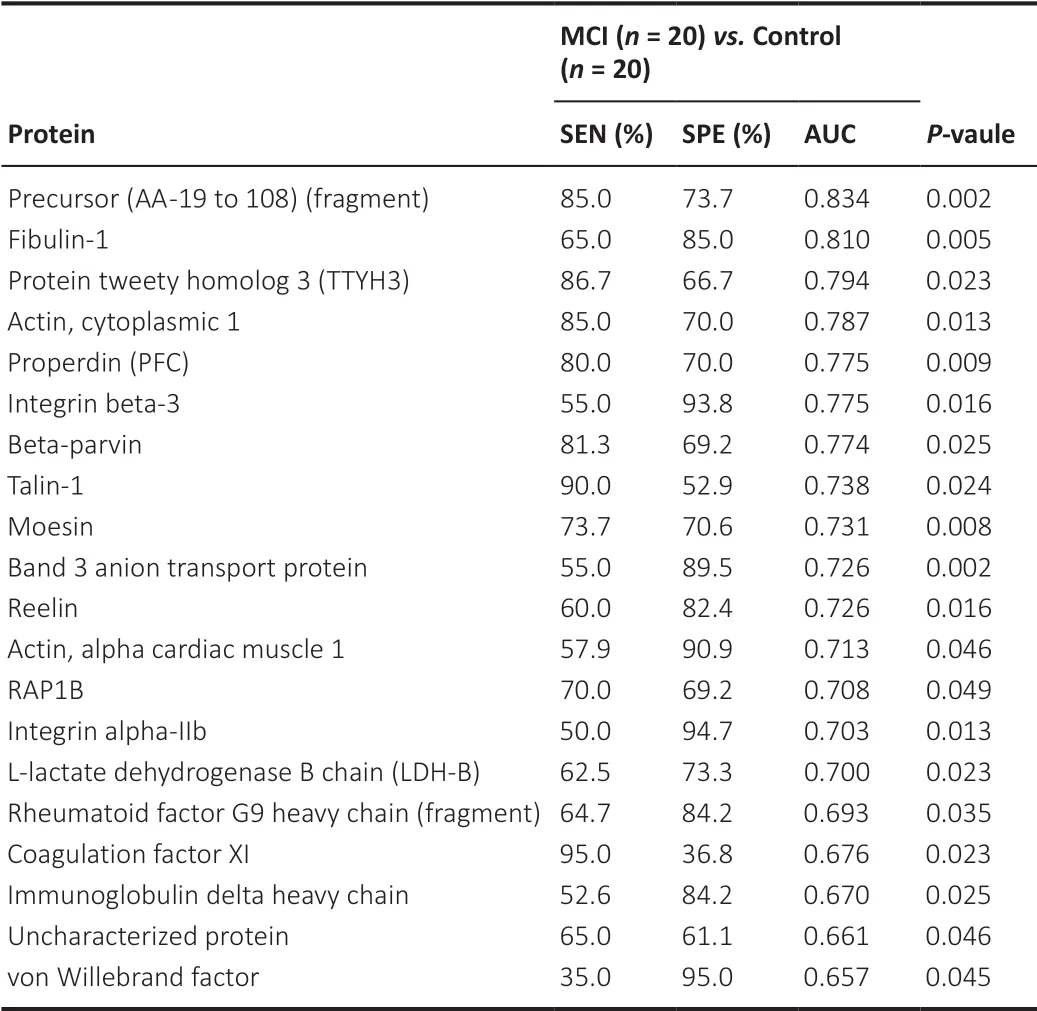
Table 2 | The diagnostic capacity of the top-20 candidate serum biomarkers for distinguishing between health controls (HC) and mild cognitive impairment (MCI) patients
Validating a potential biomarker using immunoblot measurements and ELISA
During the verification stage, we conducted quantitative immunoblot measurements and ELISA to investigate the expression of selected biomarkers. Exosomal fibulin-1 expression in MCI patients and healthy controls was confirmed by immunoblotting (Figure 8A
andB
). Compared with that in the healthy group, expression of both exosomal APP and fibulin-1 was increased in the MCI group (P
< 0.05 andP
< 0.01).We used an ELISA to validate fibulin-1 expression the Western blot results, which showed higher fibulin-1 expression in MCI patients compared with that in the healthy controls. Exosomal fibulin-1 concentrations in the MCI group were significantly higher than those in the control group (P
< 0.001;Figure 8C
).Correlation between cognitive performance and fibulin-1 levels in exosomes
To investigate whether exosomal fibulin-1 expression can affect cognitive performance, and MMSE and MoCA were used to examine their correlation with exosomal fibulin-1 expression in MCI patients using a linear correlation analysis. We observed that MCI patients with higher MMSE (r
= −0.482,P
< 0.01) and MoCA (r
= −0.632,P
< 0.001) scores had lower exosomal fibulin-1 expression (Figure 8D
andE
).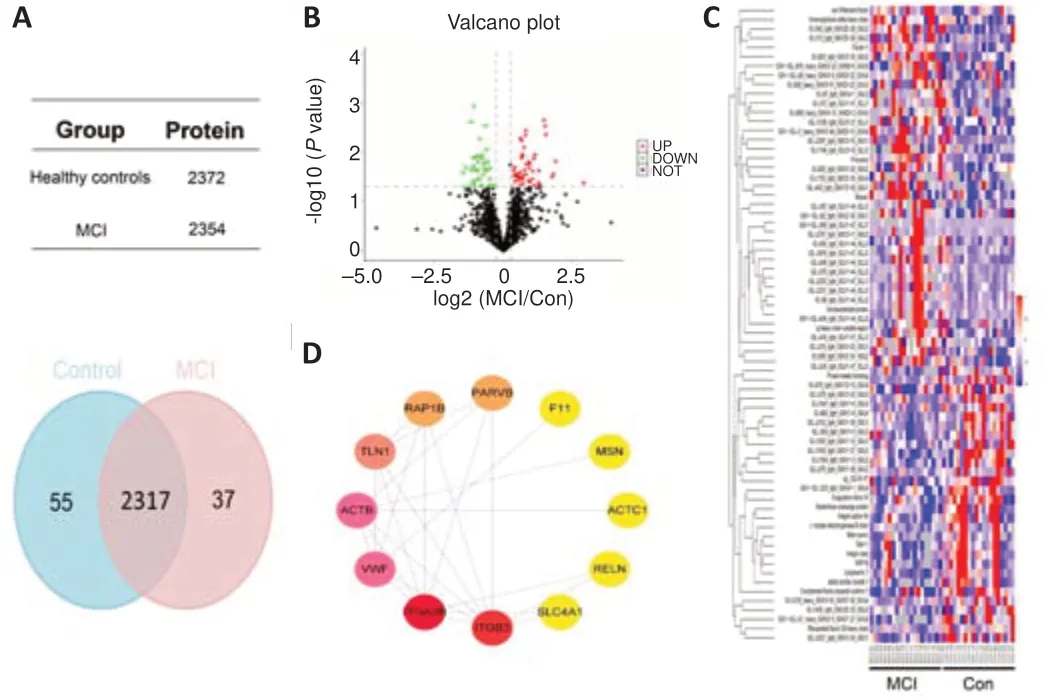
Figure 3 |Identification of differentially expressed proteins from mild cognitively impaired patients and healthy controls.(A) Venn diagrams suggest the total number of proteins detected in each group. There are 2317 proteins that overlap between the two groups. (B) A volcano plot demonstrates the differentially expressed proteins in MCI patients and healthy controls (fold-change > 1.5 and P < 0.05). (C) Heatmap showing the differentially expressed exosomal proteins in MCI patients and healthy controls. Each row represents a protein and each column represents a single individual. The protein expression level on the heatmap was reflected by different colors, where red represents high-expression proteins and green represents low-expression proteins. (D) Protein-protein interaction network of differentially expressed proteins between MCI patients and healthy controls, in which nodes stand proteins and lines represent connection. The node color gradation reflects the quantity of interacting proteins. MCI: Mild cognitive impairment.

Figure 4 |GO and KEGG pathway enrichment analysis of differentially expressed proteins. (A) GO functional enrichment analysis of proteins differentially expressed in MCI patients and healthy controls. The following three categories comprise GO: biological process; molecular function; and cellular component. (B) KEGG pathway enrichment of proteins differentially expressed in MCI patients and healthy controls. GO: Gene Ontology; KEGG: Kyoto Encyclopedia of Genes and Genomes; MCI: mild cognitive impairment.

Figure 5 |Weighted gene co-expression network analysis.(A) Heat map of module-trait relationships. The abscissa is the character factor. The left ordinate color block represents different module types. The large color block in the middle represents each protein module, and the correlation coefficient value and P-value (the value in parentheses) are indicated on the color block. The color bar on the right represents the size of the correlation coefficient, which varies between −1 and +1. Red represents a positive correlation and blue represents a negative correlation. (B) Heatmap showing differentially expressed proteins in the pink module. The expression level of differentially expressed proteins between two groups are shown in the heatmap with diverse colors, in which red represents up-regulated proteins, blue represents down-regulated proteins, and gray represents the protein-free quantitative information. (C) A network graph suggests protein-protein interaction between the two groups for differentially expressed proteins from the pink module.
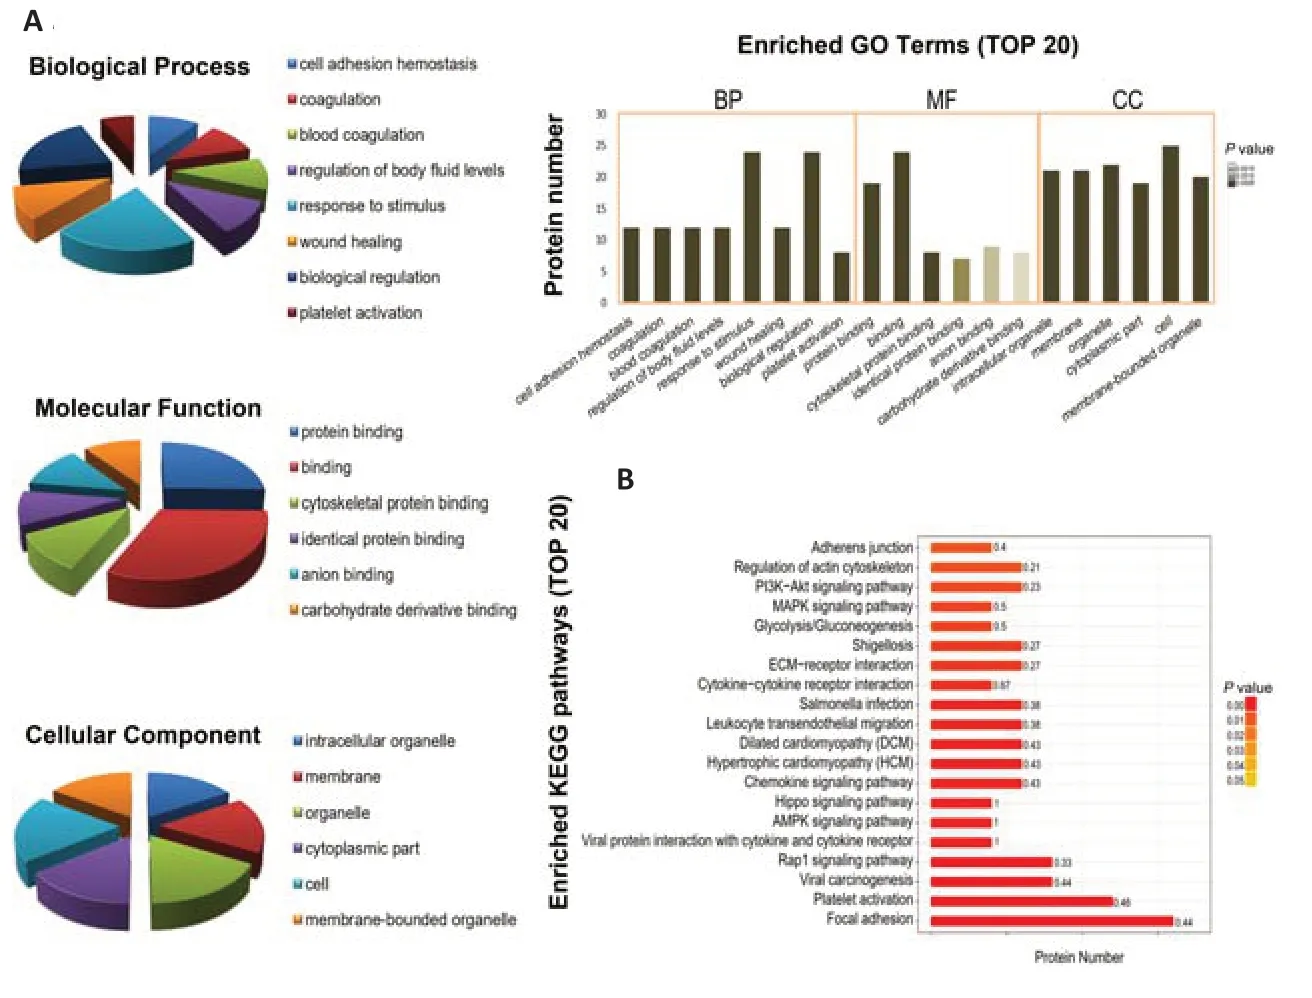
Figure 6 |GO and KEGG pathway enrichment analysis of proteins in the pink module.(A & B) Top terms in the biological process, molecular function, and cellular component enrichment of differentially expressed proteins, which were classified in accordance with the GO analysis. (C) Top terms in the KEGG pathway-enrichment analyzed from proteins differentially expressed between the two groups. GO: Gene Ontology; KEGG: Kyoto Encyclopedia of Genes and Genomes.
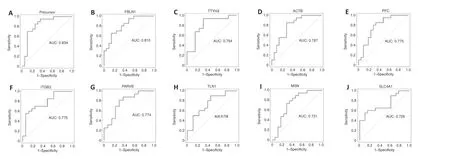
Figure 7 |ROC curves show the top ten AUC values for serum exosomal proteins listed in Table 2 for diagnosing MCI.(A‒J) ROC curves for exosomal proteins that were used to distinguish between MCI patients and healthy controls. The area under the ROC curve was used to evaluate the level of discrimination. AUC: Area under the curve; MCI: mild cognitive impairment; ROC: receiver operating characteristics.
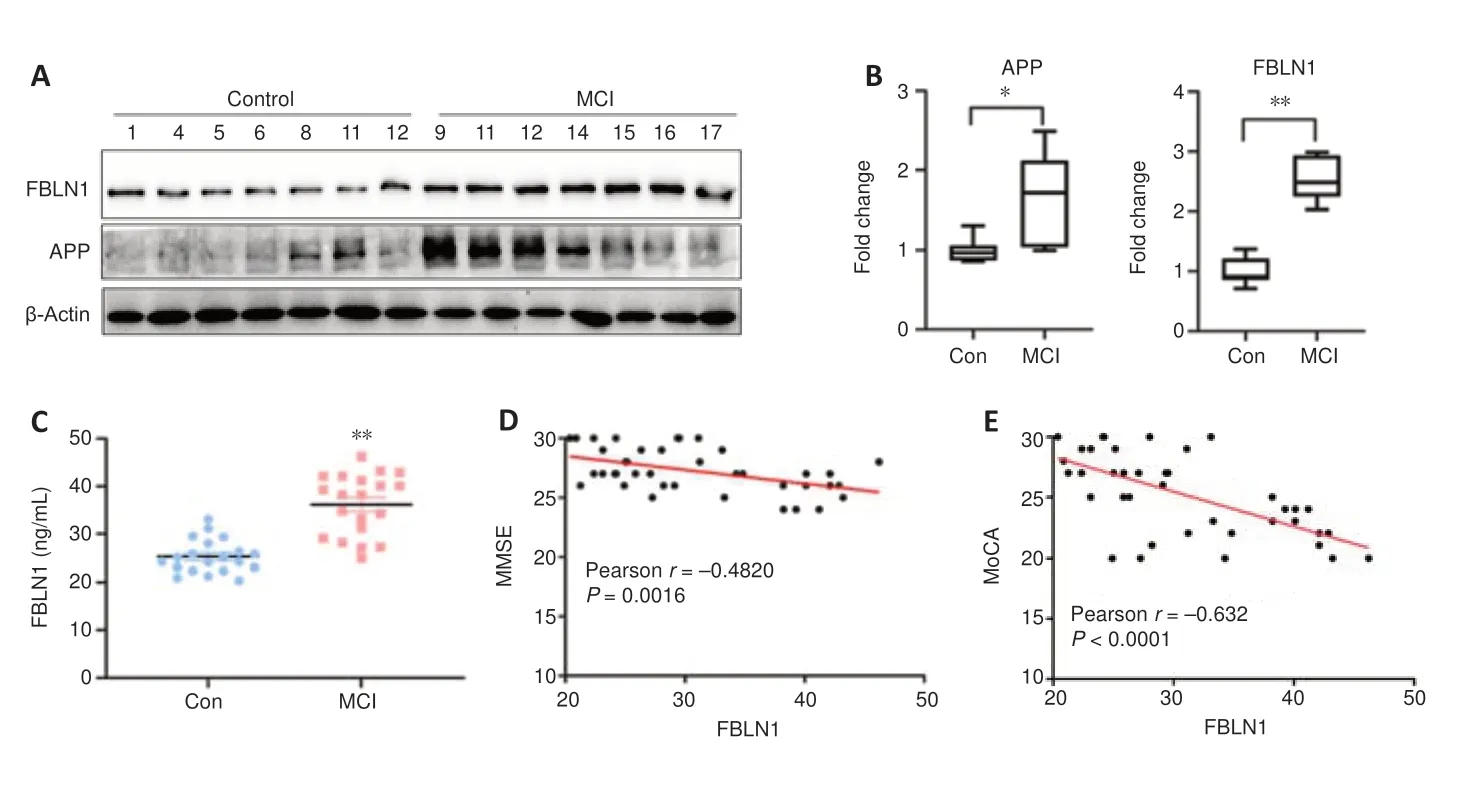
Figure 8 |Exosomal fibulin-1 levels involved in MCI pathogenesis and its correlation with cognitive performance. (A & B) Representative Western blots (left) and quantification (right) of exosomal fibulin-1 in MCI patients (n = 7) and healthy controls (n = 7). *P < 0.05, **P < 0.01 (Wilcoxon rank-sum test). Relative protein expression was normalized to β-actin. The lower and upper boundaries of the boxes indicate the 25th and 75th percentiles, a line within each box marks the median. (C) ELISA assay results of exosomal fibulin-1 in MCI patients and healthy controls. Higher fibulin-1 expression was observed in MCI patients compared with that in healthy controls. (D&E) Pearson correlation analysis shows a negative correlation of the cognitive performance compared with the fibulin-1 expression level in isolated exosomes. APP: Amyloid precursor protein; ELISA: enzyme-linked immunosorbent assay; FBLN1: fibulin-1; MCI: mild cognitive impairment.
Discussion
In this study, we evaluated whether serum exosomes may contain biomarkers that could help to distinguish MCI patients from healthy controls. We found that, in MCI patients, the serum exosome concentration was higher and the exosome diameter was smaller compared with those in healthy controls. Proteome profiles combined with bioinformatic analysis revealed the characteristics of differentially expressed proteins between the two groups. Higher exosomal fibulin-1 levels correlated with a lower cognitive performance in MCI patients compared with that in healthy controls, indicating that serum exosomal fibulin-1 may be a promising biomarker for diagnosing MCI.
Clinically diagnosing MCI is difficult because the diagnostic procedures are complex. Thus, peripheral fluid biomarkers that have diagnostic value are required to make the diagnostic procedure easier and more sensitive. Development of traditional biochemical biomarkers for central nervous system (CNS) diseases has been slow because it is difficult to identify, isolate, and quantify molecules that reflect the state of the brain without using invasive collection techniques (Keshavan et al., 2017). Previous studies have identified biomarkers in the cerebrospinal fluid (CSF), peripheral fluid, and blood cells of MCI patients using liquid chromatography with tandem MS analysis (Di Domenico et al., 2011; Huan et al., 2018; Whiley et al., 2021). However, the results of these studies varied markedly, and there was a lack of association with clinical features. Thus, further validation of their diagnostic reliability is required. Liu et al. (2020) conducted a large meta-analysis including 4661 individuals from 24 related articles to identify the CSF and blood neurogranin (Ng) levels as diagnosis biomarkers for AD and MCI patients. Their levels were increased in CSF but decreased in blood plasma in MCI patients compared with healthy controls (Liu et al., 2020). However, the inclusion criteria for that research included selecting AD/MCI patients whose CSF or blood biomarkers included Ng, and the results require further experimental validation. These reasons may explain the discrepancy in the results between their study and ours. Another study harvested exosomes that originated from neurons and exosomal p-Tau, Aβ, and other proteins and showed that they can accurately predict MCI that converts to AD. This research provided new insight into using neuron-derived exosomes to identify precise biomarkers (Winston et al., 2016). However, the research focused on AD pathogenic-related exosomal proteins rather than on differentially expressed exosomal proteins between MCI patients and healthy controls.
Exosome characteristics included stability and liquidity. Exosomes that carry proteins and nucleic acids can cross the blood-brain barrier from brain tissue to peripheral fluid (García-Romero et al., 2017), which is the mechanism of intercellular communication, and thus, they may be promising biomarkers for many neurodegenerative diseases (You and Ikezu, 2019). Methods for the isolation and purification of exosomes have improved over time (Zhang et al., 2020b). In our study, MCI patients had an increased serum exosome concentration and decreased exosome mode size compared with those of healthy controls. These results suggest that early pathological changes in MCI may promote exosome transport from the CNS to the periphery (Rajendran et al., 2006; Gibbons et al., 2019). On the basis of this pathophysiological process, exosomal proteins seem to be promising as biomarkers for MCI.
Our results from the proteome profile showed differential serum exosomes between two groups, which included a precursor (AA-19 to 108, fragment) and fibulin-1, and precursor (AA-19 to 108, fragment) is in the validation stage. Fibulin-1 levels were increased in MCI patient serum exosomes compared with those of healthy controls, highlighting that its serum exosomal level may have potential diagnostic value. The serum exosomal protein level is highly correlated with that in CSF (Jia et al., 2019). Thus, fibulin-1 levels measured in the periphery may reflect levels inside the brain tissue. We further explored the relationship between exosomal fibulin-1 expression and cognitive performance in MCI patients. Fibulin-1 was shown to bind directly to soluble APP (sAPP), and it was upregulated in the plasma of AD patients compared with that in healthy controls (Ohsawa et al., 2001; Muenchhoff et al., 2015). Fibulin-1 binding to sAPP may modulate sAPP binding to receptorlike molecules, neutralizing neurite outgrowth in hippocampal neurons (Small et al., 1994) and sAPP neuroprotective activity (Barger and Mattson, 1997). Fibulin-1, which is a glycoprotein and an intercellular component in a wide range of connective tissues, resides within these exosomes and may limit the accumulation of intraneuronally produced amyloid β (Aβ) (Pacheco-Quinto et al., 2019). Although multiple studies have shown that pathological biomarkers, such as Aβ, pTau, and APP, are changed in exosomes from patients with AD or MCI (Nisbet and Gotz, 2018; Jia et al., 2021), these pathological alterations often occur in late-stage AD (Henkins et al., 2012). Our results focused on other exosomal proteins, which may provide new ideas for diagnosing MCI at an early stage of AD.
The GO terms identified in the MCI group were enriched in the CAM category. The nervous system is affected by synaptic CAM function, which plays a role in regulating synaptic morphology, synaptic plasticity, and hippocampusdependent behavior (Klevanski et al., 2015; Leshchyns’ka and Sytnyk, 2016). Synaptic CAM also regulates the production and deposition of Aβ (Leshchyns’ka and Sytnyk, 2016). Soluble Aβ oligomers induce the expression of vascular adhesion molecules, which may promote leukocyte adhesion and transmigration during AD (Zenaro et al., 2017). Fibulin-1 requires matrisome deposition of other proteins, including collagens, fibrillins, fibulins, latent transforming growth factor-β-binding protein, tenascin-C, and proteoglycans (Ito et al., 2020). Thus, different CAMs are activated during inflammatory and neurodegenerative responses, which could be useful as putative surrogate biomarkers in AD (Hochstrasser et al., 2010).
There are some limitations in the present study. These findings warrant further investigation in multi-center studies. There was no cohort stratification by MCI subtypes. More accurate criteria to diagnose patients with MCI, which include imaging findings (brain atrophy and hypometabolism) and CSF biomarkers (concentration of amyloid β and Tau), should be investigated in future studies.
In conclusion, exosomal fibulin-1 may be an exosomal biomarker for MCI diagnosis.
Acknowledgments:
We sincerely thank Lu Liu from Daping Hospital of Third Military Medical University and Ying Tang from West China Hospital for providing instructions with the research.
Author contributions:
YJL designed the study. BC and LS performed the experiments and analyzed the data. JY, WYZ and YYC provided assistance with the research. YJL and LS wrote the manuscript. All authors approved the final version of the paper.
Conflicts of interest:
The authors declare that they have no conflicts of interest.
Open access statement:
This is an open access journal, and articles are distributed under the terms of the Creative Commons AttributionNonCommercial-ShareAlike 4.0 License, which allows others to remix, tweak, and build upon the work non-commercially, as long as appropriate credit is given and the new creations are licensed under the identical terms.
- 中国神经再生研究(英文版)的其它文章
- Notice of Retraction
- Neuroprotective role of Noggin in spinal cord injury
- Combined cell-based therapy strategies for the treatment of Parkinson’s disease: focus on mesenchymal stromal cells
- Lights at night: does photobiomodulation improve sleep?
- β2-Microglobulin exacerbates neuroinflammation, brain damage, and cognitive impairment after stroke in rats
- The lymphatic drainage systems in the brain: a novel target for ischemic stroke?

