Association between brain N-acetylaspartate levels and sensory and motor dysfunction in patients who have spinal cord injury with spasticity: an observational case-control study
Jia-Yi Liu , Ya-Jing Li, Xin-Ying Cong, Zuliyaer Talifu , Xin Zhang , Feng Gao , , Jian-Jun Li ,
Abstract Spinal cord injury is a severe and devastating disease, and spasticity is a common and severe complication that is notoriously refractory to treatment. However, the pathophysiological mechanisms underlying spasticity and its development remain largely unknown. The goal of the present study was to find differences, if any, in metabolites of the left precentral gyrus and basal ganglia of patients who have spinal cord injury with or without spasticity, and to explore the relationship between the brain metabolite concentrations and clinical status. Thirty-six participants were recruited for magnetic resonance spectroscopic examination: 23 with spinal cord injury (12 with spasticity and 11 without spasticity) and 13 healthy controls. We acquired localized proton spectra from the precentral gyrus and basal ganglia via 10 mm3 voxels. Notably, univariate linear regression analysis demonstrated that the lower that the N-acetylaspartate concentration (a marker for neuronal loss) was in the precentral gyrus of the patients, the lower their ASIA (American Spinal Injury Association) light-touch scores, pinprick scores, and motor scores. Additionally, longer durations of injury were associated with higher N-acetylaspartate levels in the precentral gyrus. Compared with the healthy participants and patients without spasticity, N-acetylaspartate levels in the patients with spasticity were significantly lower in both the precentral gyrus and basal ganglia. Lower N-acetylaspartate levels also correlated with greater sensory and motor dysfunction in the patients who had spinal cord injury with spasticity.
Key Words: ASIA motor score; ASIA sensory score; basal ganglia; central nervous system; duration of injury; magnetic resonance spectroscopy; N-acetylaspartate; precentral gyrus; spasticity; spinal cord injury 1School of Rehabilitation, Capital Medical University, Beijing, China; 2Department of Spinal and Neural Function Reconstruction, China Rehabilitation Research Center, Beijing, China; 3China Rehabilitation Science Institute, Beijing, China; 4Beijing Key Laboratory of Neural Injury and Rehabilitation, Beijing, China; 5Center of Neural Injury and Repair, Beijing Institute for Brain Disorders, Beijing, China; 6Rehabilitation Department, Shanghai Huashan Hospital, Shanghai, China; 7Department of Medical Imaging, China Rehabilitation Research Center, Beijing, China
Introduction 582 Methods 583 Results 583 Discussion 585 Conclusion 586
Introduction
Spinal cord injury (SCI) is a severe and devastating disease that not only results in impaired motor and sensory function, and damage to the physiological, mental, and social well-being of the injured individuals, but also exerts a tremendous financial toll on families and the national healthcare system (Lynch and Cahalan, 2017; Toda et al., 2018; Choi et al., 2021; Shen et al., 2021). Approximately 60‒80% of individuals with SCI suffer from secondary spasticity, and the prevalence of problematic spasticity has been reported to be around 35‒40% (Holtz et al., 2017; Skoog and Jakobsson, 2020). Long-lasting spasticity commonly impairs quality of life, causes involuntary movements, pain, and fatigue, disturbs sleep, contributes to the development of contracture, infection, and pressure ulcer, hampers social interactions and rehabilitation efforts, and severely interferes with activities of daily living (van Cooten et al., 2015; Holtz et al., 2017).Magnetic resonance spectroscopy (MRS) is an advanced imaging technology that can noninvasively assess and quantify the concentrations of various cellular metabolitesin vivo
, and reveal information concerning the biochemical composition of different brain regions. The tissue metabolites generally evaluated include N-acetylaspartate (NAA), choline (Cho), creatine (Cr), glutamine (Gln), myo-inositol (MI), and gamma-aminobutyric acid (GABA) (Chang et al., 2013).Past studies of patients with SCI and neuropathic pain have reported a reduction of NAA in either the anterior cingulate cortex (Widerstrom-Noga et al., 2013) or the thalamus (Pattany et al., 2002; Gustin et al., 2014), which was negatively correlated with pain intensity (Pattany et al., 2002). Another SCI study demonstrated a decrease in spinal cord NAA, which might have been associated with greater loss of spinal cord area in pain-free patients with SCI (Pfyffer et al., 2020). Most studies agree that after damage to the spinal cord, spasticity is associated with injury of the descending motor pathways, notably the corticospinal and reticulospinal pathways (Trompetto et al., 2014; Lee et al., 2016), but few studies have examined the contribution of subsequent neural and biochemical abnormalities in the central nervous system (CNS) to spasticity after SCI, which remains poorly understood. Therefore, the application of MRS might reveal a potential central mechanism of spasticity after SCI we hypothesize that changes in brain metabolites are involved in the generation and maintenance of spasticity after SCI, and that they correlate with clinical status, such as the duration of injury and sensory and motor deficits as assessed by American Spinal Injury Association (ASIA) scores.
Methods
This observational study was carried out in accordance with theDeclaration of Helsinki
and was approved by The Medical Ethics Committee of the China Rehabilitation Research Center on April 1, 2020 (approval No. 2020-019-1). Written informed consent was obtained from all participants. The writing and editing of the research article were performed in accordance with the Strengthening the Reporting of Observational Studies in Epidemiology (STROBE) Statement (von Elm et al., 2007). This study was registered with the Chinese Clinical Trial Registry (registration number: ChiCTR1900026922) on October 26, 2019 and with the National Health Security Information Platform, medical research registration, and filing information system (Registration No. MR-11-21-013247) on January 28, 2021.Participants
Patients with SCI (n
= 23) were recruited from the Department of Spinal and Neural Function Reconstruction at the China Rehabilitation Research Center in Beijing from March 1, 2021 to August 1, 2021, and healthy control participants (n
= 13) were recruited by advertisement on The Internet. Due to the low morbidity of SCI, we only recruited 23 patients with SCI who fit our inclusion and exclusion criteria during the study period. The clinical data were collected from March 1, 2021 to August 10, 2021. The spasticity of the patients was examined using MAS, and the participants with SCI were subsequently divided into a non-spastic group (MAS = 0;n
= 11) and spastic group (MAS = 1, 2, or 3;n
= 12) according to their MAS scores (Bohannon and Smith, 1987). All members of the spastic group were under the same antispastic medication (baclofen 75 mg per day, Novartis Farma S.p.A., Italy). The inclusion criteria for the patients with SCI were as follows: 1) SCI; 2) aged between 18 and 60 years; 3) right-hand dominant. The exclusion criteria were: 1) a history of CNS diseases such as intracranial tumor, traumatic brain injury, or epilepsy; 2) current or historical drug abuse or long-term heavy alcohol use; 3) current or past psychiatric problems such as schizophrenia, depression, or severe anxiety; 4) significant cognitive deficits measured by Raven Standard Intelligence Test; 5) contraindicated for magnetic resonance imaging (MRI) examination (i.e., an incompatible cardiac pacemaker, an aneurysm clip, a ferromagnetic implant, or claustrophobia), or inability to complete a 3T MRI scan. Because SCI is usually caused by vehicular accident, fall from a great height, or being crushed by a heavy weight, patients with SCI often suffer from concomitant brain trauma. Such brain damage was assessed based on a conventional MRI scan, a careful physical examination upon admission, and medical history, and patients were excluded under criterion 1 above. Attention was particularly paid to symptoms such as transient disturbance of consciousness, ecmnesia, headache, and vomiting. In addition to standard demographic information—e.g., age, gender, etiology of injury—the extent of motor and sensory impairment was assessed by a single qualified clinician using the ASIA classification scale (Asia and Committee, 2019). Healthy participants were also right-hand dominant and were excluded if they had a diagnosis of concomitant brain trauma based on a conventional MRI scan. There was no difference in age or gender among the three groups. The enrollment and allocation of participants are shown inFigure 1
.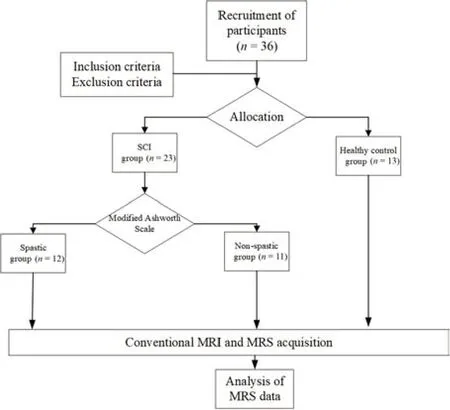
Figure 1 |Flow diagram of the trial design.MRI: Magnetic resonance imaging; MRS: magnetic resonance spectroscopy; SCI: spinal cord injury.
MRS data acquisition
The study was performed at the China Rehabilitation Research Center in Beijing using a 3.0 Tesla MRI scanner (Philips Ingenia, Best, Netherlands) with a standard head coil for both MRI and MRS measurements. The participants lay in the scanner in a head-first supine position. We acquired T2-weighted images from all participants before the MRS examination, and separately centered a voxel (10 mm) of interest in the left precentral gyrus (PG) (Figure
2A
,C
, andE
) and the basal ganglia (BG) (Figure 2B
,D
, andF
). The region of interest for the PG was anterior to the central sulcus, and that for the BG was adjacent to internal capsule, and the exact location was determined by a single experienced radiologist who was completely unaware of the experimental grouping. MR spectra of all participants were measured with a stimulated echo acquisition mode (STEAM) sequence with the following parameters: repetition time (TR) = 2000 ms, echo time (TE) = 144 ms, spectral width = 2 kHz, acquisition points = 1024, and total acquisition time = 836 seconds. We performed shimming using manufacturer-supplied shimming procedures. Water suppression was applied by placing frequency-selective excitation pulses at the beginning of the MRS sequence. The absolute concentrations of NAA, MI, Cho, as well as Cr inin vivo
spectral data were analyzed in the Department of Medical Imaging by fitting a linear combination of a basis set of metabolite model spectra to the data using software that came with the system (Philips Ingenia, Best, Netherlands) (Figure 3A–F
). The metabolite concentrations are expressed as mmol/kg.Statistical analysis
Statistical analysis was performed using SPSS software, version 26.0 (IBM Corp, Armonk, NY, USA). Comparisons in age and gender between spastic, non-spastic, and healthy control groups were conducted using ANOVA or the chi-square tests, as appropriate.
Differences in ASIA light-touch score were tested using an independentsamplest
-test. Differences in ASIA pinprick score, ASIA motor score, and the duration of injury did not conform to the normal distribution, and were thus tested using the Mann-WhitneyU
-test. Differences in the level of injury and ASIA scores between the spastic and non-spastic groups were examined via chi-square tests. A univariate linear regression analysis was performed between the concentration of NAA in the PG and BG and clinical data (ASIA light-touch score, ASIA pinprick score, ASIA motor score, and the duration of injury) to investigate the relationships between the variance in NAA concentration and clinical variables. Continuous variables are reported as the mean ± SD. Differences in NAA values between the spastic, non-spastic, and healthy control group were compared using the Kruskal-Wallis test, and differences in MRS metabolites between the SCI and healthy control groups were compared using independent-samplest
-tests.P
values of less than 0.05 were considered to be statistically significant.Results
MRS data were acquired from the left PG and left BG from all participants. Demographic and clinical characteristics of all participants are shown inTable 1
.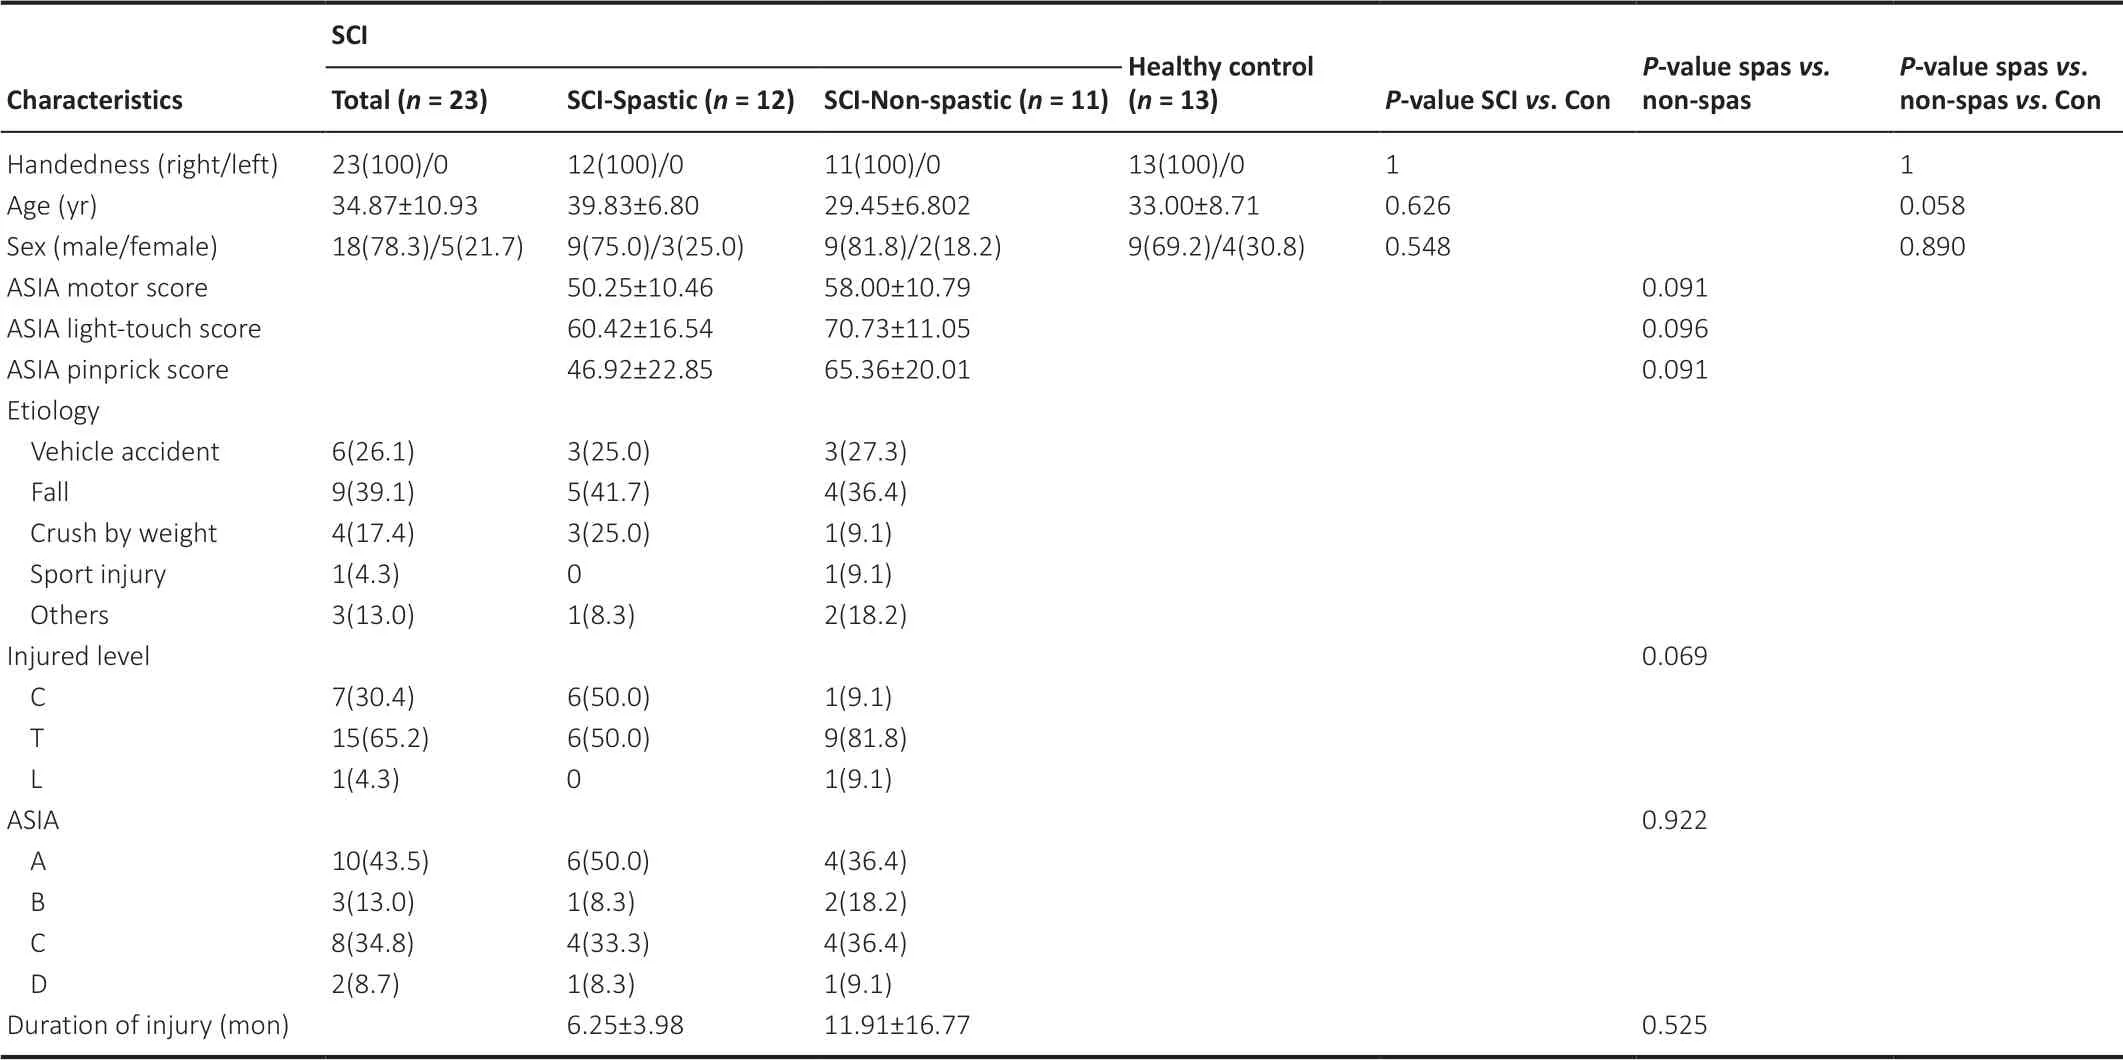
Table 1 |Demographic and clinical characteristics
Relationships between NAA concentration and clinical data
Univariate linear regression analysis demonstrated that lower NAA concentration in the PG was significantly associated with lower ASIA lighttouch scores (β = 468.81, 95% Confidence Interval [CI]: 58.93‒71.76,P
= 0.002) (Figure 4A
), ASIA left light-touch scores (β = 258.39, 95% CI: 28.67‒35.50,P
= 0.001;Figure 4B
), ASIA right light-touch scores (β = 210.42, 95% CI: 29.89, 36.63,P
= 0.004;Figure 4C
), ASIA pinprick scores (β = 646.44, 95% CI: 45.66‒65.81,P
= 0.001) (Figure 4D
), ASIA left pinprick scores (β = 338.49, 95% CI: 21.77‒32.58,P
= 0.002;Figure 4E
), ASIA right pinprick scores (β = 307.25, 95% CI: 23.56‒33.48,P
= 0.002;Figure 4F
), ASIA motor scores (β = 419.89, 95% CI: 49.15‒58.76,P
< 0.001;Figure 4G
), ASIA left motor scores (β = 207.31, 95% CI: 23.80‒31.59,P
= 0.004;Figure 4H
), and ASIA right motor scores (β = 210.68, 95% CI: 22.65‒28.83,P
< 0.001;Figure 4I
). Furthermore, longer durations of injury were associated with greater NAA levels in the PG (β = 0.001, 95% CI: 0.083‒0.105,P
= 0.001;Figure 4J
). However, no significant relationships were observed between NAA levels in the BG and any of the other clinical data (ASIA motor score, ASIA light-touch score, and ASIA pinprick score). Furthermore, no significant relationships were found between the other metabolites (MI, Cho, and Cr) and any of the clinical data (ASIA motor score, ASIA light-touch score, ASIA pinprick score, and the duration of injury).Difference of NAA concentration
Though no difference in NAA value was observed between the SCI group and the control group in the left PG (P
= 0.174) or BG (P
= 0.081) (Figure 5A
), levels were significantly lower in the spastic group than in either the nonspastic group (P
< 0.001) or the control group (P
= 0.001;Figure 5B
). However, values in the non-spastic group and the control group were comparable (P
= 0.119;Figure 5B
). The same pattern was found for NAA concentration in the left BG: NAA levels were significantly lower in the spastic group than in the non-spastic group (P
= 0.002) or the control group (P
< 0.001;Figure 5C
), but comparable between the non-spastic and control groups (P
= 0.277;Figure 5C
). Additionally, no differences were found with regard to the other metabolites between the spastic and non-spastic groups or the SCI and control groups (allP
> 0.05).
Figure 2 |Magnetic resonance spectroscopic images for patients with SCI and spasticity, patients with SCI but no spasticity, and healthy controls. (A‒F) Sagittal, axial, and coronal T1-weighted images showing the location of the 10-mm3 voxel (at the crosshairs) in the left precentral gyrus (PG) (A) and left basal ganglia (BG) (B) of a patient with SCI and spasticity, the left PG (C) and left BG (D) of a patient with SCI but no spasticity, and the left PG (E) and left BG (F) of a healthy participant. The region of interest in the PG was adjacent to central sulcus, and that in the BG was adjacent to internal capsule. The exact location was determined by a single experienced radiologist who was completely unaware of the experimental grouping. SCI: Spinal cord injury.
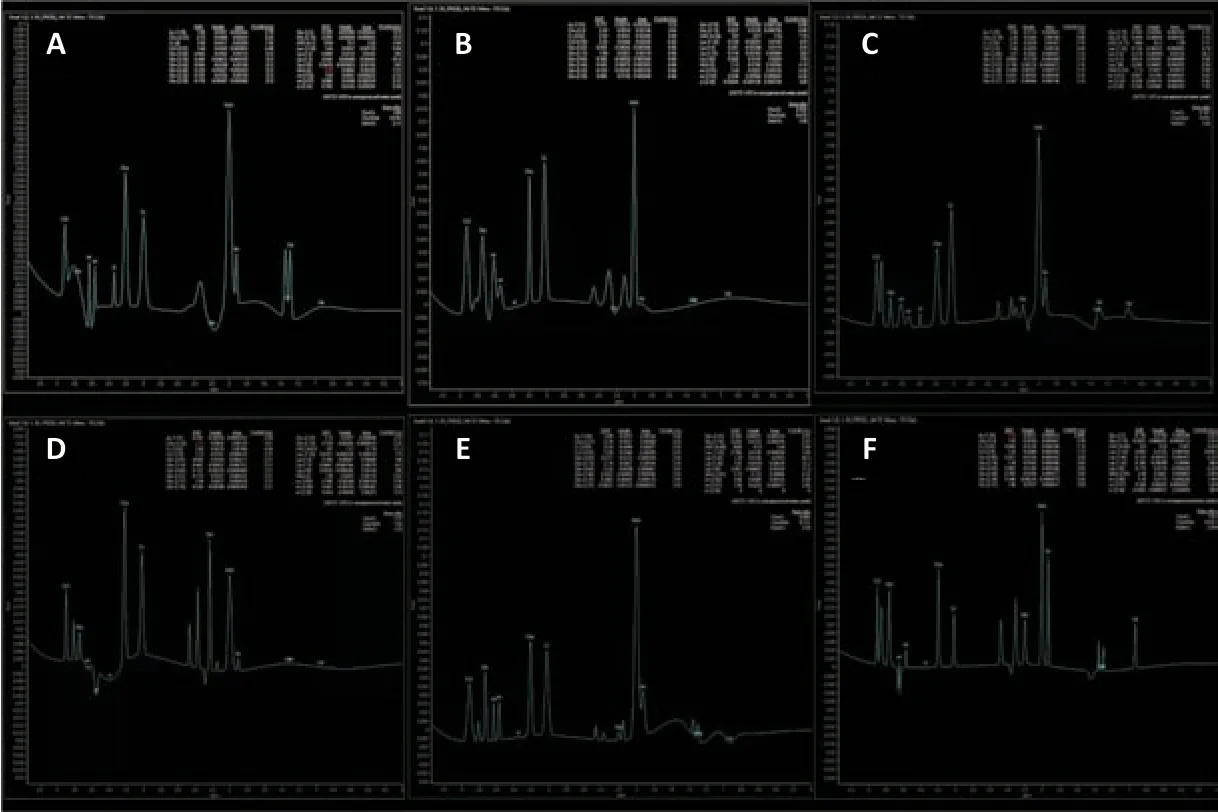
Figure 3 |Magnetic resonance spectroscopic results for the three groups.Typical single-voxel stimulated echo acquisition mode (STEAM) spectra acquired from the left PG (A) and left BG (B) of a patient with SCI and spasticity, the left PG (C) and left BG (D) of a patient with SCI but no spasticity, and the left PG (E) and left BG (F) of a healthy participant. Spectral analysis is described in the Methods section. BG: Basal ganglia; PG: precentral gyrus; SCI: spinal cord injury.

Figure 4 |The relationship between NAA concentration in the PG and clinical data.(A‒I) Univariate linear regression analysis demonstrated correlations between NAA concentration in the PG, and ASIA light-touch score (A), ASIA left light-touch score (B), ASIA right light-touch score (C), ASIA pinprick score (D), ASIA left pinprick score (E), ASIA right pinprick score (F), ASIA motor score (G), ASIA left motor score (H), and ASIA right motor score (I). (J) Univariate linear regression analysis showing that NAA concentration in the PG increased with duration of injury. ASIA: American Spinal Injury Association; NAA: N-acetylaspartate; PG: precentral gyrus.
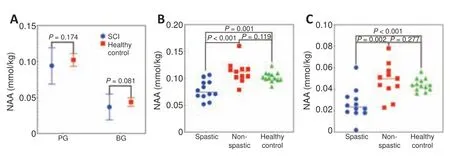
Figure 5 |Group differences in NAA concentration. (A) Differences in NAA concentration in the left PG and left BG between the SCI group and the healthy control group. (B, C) NAA concentration in the left PG (B) and left BG (C) for all three groups. BG: Basal ganglia; NAA: N-acetylaspartate; PG: precentral gyrus; SCI: spinal cord injury.
Discussion
In our examination, two brain regions which were implicated in spasticity were chosen to determine whether metabolic abnormalities are related to spasticity. Spasticity is generally considered a syndrome of upper motor neurons, originating mainly in the PG and projecting to lower motor neurons in the spinal cord through the BG, which has important connections with cortical regions. MRS sequencing was performed in the left PG and left BG, which have been suggested as the primary sites where lesions induce spasticity (Mukherjee and Chakravarty, 2010). Accordingly, impairment of axons/neurons in the PG and BG might be involved in the formation and maintenance of spasticity following SCI. Because patients with SCI often suffer from spasticity and/or neuropathic pain, they cannot tolerate a prolonged period of MRS scanning. Therefore, we did not attempt bilateral examinations. The finding that NAA concentration in the encephalic region did not differ between the left and right hemispheres supports the idea that NAA measurements from one hemisphere are representative of both (Pattany et al., 2002). Because all participants were right-handed, we chose the PG and BG of the left hemisphere when searching for changes in brain metabolites after SCI.
As a dominating metabolic feature, NAA is the most important and frequently used parameter in MRS studies. Under normal conditions, the most prominent NAA peak arises at 2.0 ppm. Synthesized in neuronal mitochondria, NAA is regarded as one of the most abundant amino acids in the CNS (Moffett et al., 2007). Though its function is not yet fully known, NAA is speculated to function as both a precursor and metabolite of N-acetylaspartylglutamate (NAAG; also called N-Acetylaspartylglutamic acid), a regulator of protein synthesis and storage of aspartate or acetyl-CoA, and as an osmolyte of neurons (Tsai and Coyle, 1995; Barker, 2001). As immunocytochemical studies have indicated that NAA is almost exclusively located in neurons and neuronal processes within the mature cerebral cortex, NAA serves as a perfect surrogate marker of neuronal density (Smith et al., 2012; Rae, 2014). Therefore, a reduction in NAA is generally believed to represent neuronal loss (Bates et al., 1996).
The present study demonstrated that lower NAA concentration in left PG of the patients with SCI was associated with increasing clinical severity of injury, as assessed by lower AISA light-touch, pinprick, and motor scores. Irreversible structural and metabolic damage to the motor and sensory neurons above the level of injury is likely to occur in SCI, which results in a prominent decline of neuronal population and therefore low levels of NAA upon MRS examination. The loss of PG neurons could reflect widespread impairment throughout the entire cerebral cortex, including the postcentral gyrus, which would explain why, in addition to lower ASIA motor scores, lower NAA concentration in the PG was also associated with lower light-touch and pinprick scores. Previous studies of a variety of CNS injuries have suggested that lower NAA levels are associated with worse neuronal outcomes (Craciunas et al., 2013; Wyss et al., 2019). Therefore, as we observed, the degree to which NAA levels are lower than normal in the PG should be most marked in patients with the most prominent motor and sensory loss. Thus, NAA concentration potentially reflects clinical signs and symptoms and serves as a potential biomarker for prognosis.
Another point to emphasize is that increased duration of injury might be associated with rising NAA levels in the PG, indicating that cortical reorganization itself is not static, and that changes in NAA levels and the regeneration of neurons is a dynamic process (Freund et al., 2013). Although neurons in the CNS are notorious for their limited ability to regenerate (Pego et al., 2012), the process of neuronal regeneration can take place in the wake of SCI (Badner et al., 2017; Abbas et al., 2020).
Previous MRS studies have demonstrated that decrease of NAA is associated with all kinds of neurological diseases, including Alzheimer’s disease, intracranial tumors, and traumatic brain injury (Lee et al., 2014; Glodzik et al., 2015; Widerstrom-Noga et al., 2016). The present study observed that NAA levels were lower than normal (i.e., healthy controls) in patients with SCI and spasticity, which is consistent with previous findings. However, this effect was exclusively confined to patients with spasticity; patients with SCI but no spasticity did not exhibit significantly lower than normal NAA. Further, as a whole, the SCI group did not exhibit significantly lower than normal NAA levels. Because the differential decrease of NAA was consistent across two motor regions, it is likely that secondary neuronal loss in the brain as a consequence of primary axonal injury in the spinal cord was greater in patients with spasticity than in those without. However, there were no differences in age, gender, ASIA sensory or motor scores, level of injury, or ASIA grading between spastic and non-spastic groups, indicating that the difference in NAA concentration levels was not a result of differing degrees of injury. Instead, the mechanisms of disease progression themselves might differ between patients with and without spasticity after SCI. Those with spasticity might undergo a higher degree of long-tract, central-peripheral dying-back axonopathy of the spinal cord, which is unrelated to the degree of injury (Powers et al., 2000).
A variety of treatments are available for alleviating symptoms of spasticity, including pharmacologic medications, surgical treatments, botulinum toxin injection, and electrical, mechanical, or thermal stimulation (Tator et al., 2012; Palazon-Garcia et al., 2019). However, a wide range of drawbacks, including incomplete relief of symptoms, limited duration, muscle weakness, and incoordination, still severely limit the usefulness of these anti-spasticity remedies. The current findings that more severe neuronal loss might be the root cause of spasticity following SCI are important for the development of new treatment strategies. These new strategies could focus on reducing the problematic impact of neuronal loss and the optimization of individual customized treatments, such as opting for neuro-regeneration therapies for the brain. Understanding of the underlying mechanism might also be useful across several neurological conditions involving spasticity, such as amyotrophic lateral sclerosis, multiple sclerosis, and stroke.
Interpretation of MRS data can reflect information about pathophysiological processes such as neuronal differentiation, cerebellar energetics, membrane turnover, neuronal loss, specific neurotransmitter activity, and the metabolism of certain drugs (Lee et al., 2014). Until now, MRS has not generally been considered necessary for routine clinical application because the metabolic changes detected tend to be trivial and the clinical significance is not fully appreciated. However, MRS can not only reveal neurochemical changes that precede structural and functional alterations (Borsook et al., 2007) but can also point to pathophysiological processes in the brain even in the absence of visible signs of cerebral involvement on conventional MRI. In light of our finding that preserved NAA is related to less spasticity as well as better sensory and motor prognosis in patients with SCI, MRS can be a valuable investigative technique for early detection of neuronal loss, prediction of spasticity or remaining neuronal function, and evaluation of treatment effects in clinical trials.
The present study had some limitations that should be considered when interpreting the results. Further study should include a larger sample, and longitudinal studies should be performed to look at serial changes in NAA within the same individuals. In addition, studies concerning the underlying pathophysiological mechanism of neuronal loss after SCI bothin vivo
andin vitro
should be performed.Conclusion
The results of this study indicate that as NAA serves as a neuronal marker, neuronal loss in the CNS likely contributes to poorer ASIA sensory and motor scores. Neuro-regeneration probably takes place as time passes after injury. Patients with SCI and spasticity might have a higher degree of neuronal loss than those without spasticity.
Acknowledgments:
We are grateful to China Rehabilitation Research Center (CRRC) for their support, and also to our colleagues from Department of Spinal and Neural Function Reconstruction; Chinese Institute of Rehabilitation Science; Center of Neural Injury and Repair; Beijing Key Laboratory of Neural Injury and Rehabilitation, CRRC for their technical support, modification advice, and statistical recommendations.
Author contributions:
Study design, recruitment, and statistical analysis: JYL; recruitment: FG, YJL, XZ; MRS data acquisition: XYC, YJL, JYL; study guidance: JJL, FG, ZT. All authors approved the final version of paper.
Conflicts of interest:
The authors declare that the research was conducted in the absence of any commercial or financial relationships that could be construed as a potential conflict of interest.
Open access statement:
This is an open access journal, and articles are distributed under the terms of the Creative Commons AttributionNonCommercial-ShareAlike 4.0 License, which allows others to remix, tweak, and build upon the work non-commercially, as long as appropriate credit is given and the new creations are licensed under the identical terms.
- 中国神经再生研究(英文版)的其它文章
- Notice of Retraction
- Neuroprotective role of Noggin in spinal cord injury
- Combined cell-based therapy strategies for the treatment of Parkinson’s disease: focus on mesenchymal stromal cells
- Lights at night: does photobiomodulation improve sleep?
- β2-Microglobulin exacerbates neuroinflammation, brain damage, and cognitive impairment after stroke in rats
- The lymphatic drainage systems in the brain: a novel target for ischemic stroke?

