Observational Subseasonal Variability of the PM2.5 Concentration in the Beijing-Tianjin-Hebei Area during the January 2021 Sudden Stratospheric Warming
Qian LU, Jian RAO, Chunhua SHI, Dong GUO, Ji WANG, Zhuoqi LIANG, and Tian WANG
1Key Laboratory of Meteorological Disaster, Ministry of Education (KLME) / Joint International Research Laboratory of Climate and Environment Change (ILCEC) / Collaborative Innovation Center on Forecast and Evaluation of Meteorological Disasters (CIC-FEMD),Nanjing University of Information Science and Technology,Nanjing 210044, China
2Key Laboratory of Meteorology and Ecological Environment of Hebei Province, Shijiazhuang 050021, China
3Beijing Regional Climate Center, Beijing 100089, China
ABSTRACT
Key words: sudden stratospheric warming (SSW), PM2.5, Beijing-Tianjin-Hebei (BTH), East Asian winter monsoon,boundary layer meteorological conditions
1. Introduction
PM2.5has become one of the main air pollutant components in most cities in eastern China, although the air quality has also improved in past years (Ye et al., 2018; Chen et al.,2019a; Fan et al., 2020). Due to their small size, PM2.5pollutants can be inhaled into the respiratory system and harm the health of human beings and even animals (Bu et al.,2021; Yang et al., 2022). Local primary emission, transport,and secondary formation of aerosols constitute the major atmospheric PM2.5pollutants over a certain region (Huang et al., 2015; Zhao et al., 2019; Fan et al., 2021a). At the same time, unfavorable weather conditions can also affect the concentration of PM2.5in the atmosphere by producing slow dilution of the pollution (Li et al., 2018; Dang and Liao, 2019).
Ample previous studies have reported that long-lasting unfavorable weather patterns for the dilution of tiny particulates floating in the boundary layer can contribute to the production of brownish haze (Wang et al., 2015; Wang and Chen, 2016; Yang et al., 2016). For example, on the regional and continental scales, winter haze in the Beijing-Tianjin-Hebei (BTH) region is usually accompanied by a positive phase of the Arctic Oscillation (AO) and/or a weakened East Asian winter monsoon period (Li et al., 2018), while Arctic surface warming in summer might also enhance the aerosol pollution in East Asia (Chen et al., 2019b). Specifically, a regional anomalous high in North China is usually observed during serious haze, corresponding to anomalous downwelling (Wu et al., 2017). Besides the large-scale circulation, unfavorable local meteorological conditions are also necessary for the occurrence of PM2.5accumulation in the near-surface layer, including low boundary layer height,strong inversion layer, and weak wind speed (Huang et al.,2018; Zhai et al., 2019). Further, higher relative humidity promotes the moisture absorption and growth of pollutants(Feng et al., 2018; Sun et al., 2019; Zhai et al., 2019).
Sudden stratospheric warming (SSW) events are a dramatic variation in the Arctic stratosphere, and on average,six major SSW events per decade occur in the Northern Hemisphere (Cao et al., 2019; Baldwin et al., 2021; Rao et al.,2021a). During major warming events, the stratosphere warms suddenly by tens of degrees Celsius within a week and the circumpolar zonal winds at 10 hPa reverse from westerlies to easterlies (Charlton and Polvani, 2007; Butler et al.,2015; Rao et al., 2019b, 2020). Two-way coupling between the stratosphere and the troposphere is observed during SSW events (Ren and Cai, 2007; Baldwin et al. 2021). Specifically, enhanced planetary waves are observed to propagate upward from the troposphere to the stratosphere in the pre-SSW period (Hu et al., 2014; Lu et al., 2021b; Rao et al.,2021a), whereas in the post-SSW period, the zonal-mean signals associated with the change of the stratospheric polar vortex are also related to development of a negative phase of the Northern Annular Mode (NAM) (Baldwin and Dunkerton, 2001; Liu et al., 2019). The stratospheric zonal-mean circulation signals can descend to impact the surface, which increases the risk of cold waves on both the Eurasian and North American continents (Kolstad et al., 2010; Yu et al.,2015; Garfinkel et al., 2017; Rao and Garfinkel, 2021). Therefore, identifying SSW and other similar extreme stratospheric events could possibly lead to an improvement in the predictability of surface weather related to the negative NAM/AO (Karpechko et al., 2018). Considering that on the subseasonal time scale the NAM/AO can modulate the variability of the winter monsoon in East Asia (EAWM) (Wei et al.,2018; Gong et al., 2019; Lu et al., 2021a; Rao et al., 2021b),the local haze pollution associated with climatic variability might also be affected by the stratospheric changes. In addition, the SSW could reduce high-level clouds, resulting in increased near-surface temperatures due to increased surface solar radiation, which can further change the near-surface air pollution by influencing the secondary formation process(Xia et al., 2021).
Previous studies have mainly focused on the tropospheric conditions that lead to the accumulation of atmospheric pollutants. So far, few studies have investigated the possible impacts of stratospheric polar vortex anomalies on pollution in the BTH region (Lu et al., 2021a). A recent study revealed that the weakening Arctic polar vortex in the winter of 2016 led to a decrease in the pollutant content in the BTH region (Huang et al., 2021). Comparing two sudden warming events (Rao et al., 2018, 2019a, 2020), Lu et al.(2021a) found that the subseasonal variation of the PM2.5content in the BTH region is more evident during the February 2018 SSW than during the January 2019 case. Another sudden warming happened at the very beginning of 2021 and was characterized by a long easterly duration in the stratosphere(Lu et al., 2021b; Rao et al., 2021b). However, it is still not clear whether or not a connection can be established between the stratospheric variability during this SSW and the PM2.5content in the BTH region. Does the stratosphere-troposphere coupling during the January 2021 SSW affect the EAWM system(s) and dilution of PM2.5in the BTH region? This paper is aimed to investigate the subseasonal evolution of the local PM2.5content following the onset of this SSW event.
The paper is constructed as follows. The data and methodology are briefly described in section 2. Section 3 introduces the SSW event in January 2021 and the associated spatiotemporal characteristics of the PM2.5content in the BTH region.Evolutions of large-scale stratospheric and tropospheric circulation during different periods of this SSW are diagnosed in section 4, respectively. The local meteorological conditions responsible for subseasonal variability of the PM2.5concentration are analyzed in section 5. Finally, section 6 summarizes the key finding in this study.
2. Data and methodology
2.1. Data
The European Centre for Medium Range Weather Forecasts’ fifth generation reanalysis (ERA5) (Hersbach et al.,2020) is employed in this paper. ERA5 is downloaded at a 1°× 1° horizontal resolution (the local grid is 0.25° × 0.25°) at 37 pressure levels. Multilevel variables used in this study include the zonal wind (u), meridional wind (v), geopotential height (Z), and air temperature (t). Single-level variables analyzed include the surface wind, sea level pressure (SLP), surface relative humidity, planetary boundary layer height(PBLH), and surface air temperature (SAT). The long-term mean from 1979-2020 on each day of the year is calculated to denote the daily climatology. Daily anomalies refer to the departure from the daily climatology. The PM2.5observation is collected by the Ministry of Environmental Protection of China from 2013 to the present (Fan et al., 2021b). There are 13 urban stations in the BTH region and 35 stations around it. The spatiotemporal distribution of the PM2.5following the SSW is analyzed.
2.2. Methodology
The SSW identification algorithm from the World Meteorological Organization (WMO) is used to determine the SSW and its onset date. Specifically, when the zonal-mean westerlies at 60°N/10 hPa are reversed to easterlies, an SSW is identified, and the day of wind reversal is the onset date (Charlton and Polvani, 2007; Butler et al., 2015). According to this definition, an SSW is identified on 5 January 2021.
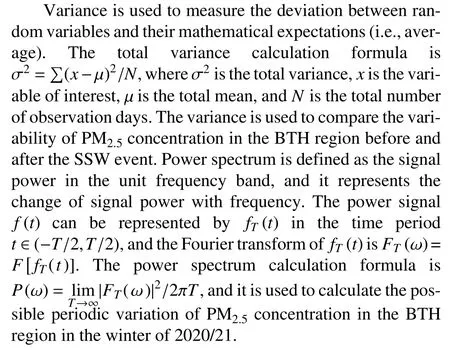
The stratospheric circulation changes drastically during the SSW, which in turn affects the tropospheric atmospheric circulation. The evolution of the PM2.5in the BTH region in the winter of 2020/21 is the main focus of this study. Its change on the subseasonal time scale might be closely related to the atmospheric variability, assuming that the emission is stable (Wu et al., 2017). By exploring the tropospheric circulation change associated with the SSW and its influence on sustaining the PM2.5content in the BTH region, the role of the stratosphere in modulating the regional air environment might be confirmed from the case study.
3. The occurrence of SSW and the temporal PM2.5 concentration in the BTH region
3.1. The occurrence of SSW in January 2021
A major warming event was observed in the stratosphere on 5 January 2021. The temporal evolutions of the circumpolar wind anomalies, polar cap temperature anomalies, and polar cap height anomalies are shown in Fig. 1. Easterly anomalies began to form on 26 December and continued until 16 February 2021, lasing for 53 days (contours in Fig.1a). The easterly anomalies increased rapidly after 31 December 2020 and reached the first maximum (-35 m s-1) on 6 January and second maximum on 16 January 2021. The easterly anomalies propagated downward to 500 hPa in early-to-mid January and to the lower troposphere in late January and early February. Correspondingly, the stratospheric polar cap warmed suddenly after 31 December 2020 at 10 hPa (temperature anomalies: 5 K) and reached its warmest state (temperature anomalies: 25 K) on 4 January 2021 (shading in Fig.1a). Namely, the Arctic temperature in the stratosphere increased by 25 K in less than a week. The polar cap warm anomalies lasted for 38 days (31 December-6 February).Compared with circulation anomalies, the warm anomalies only propagated downward to 200 hPa in middle January.
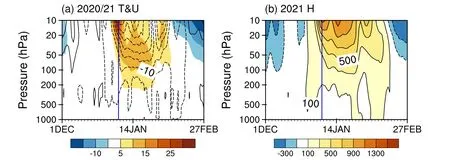
Fig. 1. Pressure-temporal evolution of the January 2021 SSW from December 2020 to February 2021. (a) Zonalmean zonal winds at 60°N (contour interval: 5; units: m s-1) and temperature anomalies over the polar cap from 60°-90°N (shadings; units: °C) from 1000-1 hPa. (b) Geopotential height anomalies over the polar cap from 60°-90°N(interval: 200; units: gpm). The onset date of the SSW is marked by a vertical blue line.
Using the geostrophic approximation, positive geopotential height anomalies in the Arctic stratosphere should correspond to easterly anomalies, which began to develop on 26 December (Fig. 1b). The polar cap height reached the first maximum (geopotential height anomalies: 900 gpm) on 6 January at 10 hPa and a second maximum on 16 January. The positive anomalies of geopotential height also lasted until 16 February and propagated downward to the surface twice.Consistent arrivals of both the easterly anomalies and positive height anomalies to the near surface indicate the development and downward pulses of the negative NAM during the SSW.
3.2. Coherent variation of the PM2.5 content in the BTH region
Firstly, the overall environmental conditions of the past five winters are investigated. The monthly PM2.5concentration from three representative cities in the BTH region in three winter months (December-February) of the last five years is shown in Fig. 2a. As the national energy conservation and emission reduction policy was strictly implemented in China, the PM2.5in the BTH region has generally shown a decreasing trend, but there are also month-to-month fluctuations in each winter. Three SSWs occurred in the Arctic during the winters of 2017/18, 2018/19, and 2020/21 (Lu et al.,2021a, b; Rao et al., 2021b). As the stratospheric signals associated with the winter SSWs (especially in 2017/18 and 2020/21) propagate downward to the ground, the PM2.5becomes relatively less. The impact of the downward-propagating signal associated with the SSWs in February 2018 and January 2019 on air pollution in the BTH region has been reported in Lu et al. (2021a), so we mainly focus on the evolution of the PM2.5concentration in the BTH region during the 2021 SSW event.
The temporal evolution of the PM2.5in three representative cities of the BTH region from 1 December 2020 to 28 February 2021 is shown in Fig. 2b. In December 2020, the PM2.5in the three cities exhibited a significant biweekly oscillation cycle, which is further confirmed by the power spectrum shown in Figs. 2c-e. The quasi-biweekly spectrum of the PM2.5concentration change might be linked with the quasi-biweekly oscillation of the wintertime atmospheric circulation, which prevails in midlatitudes during winter. However, the variability of the PM2.5concentration became greater with the downward influence of the SSW. The variance of PM2.5concentration after SSW onset was significantly greater than that before SSW onset, which was related to the atmospheric circulation anomaly caused by the stratosphere-troposphere coupling during this SSW event. Before the SSW onset date and in the early stage of the SSW (29 December 2020 to 19 January 2021), the PM2.5concentration in these three representative cities of the BTH region was relatively low, and the PM2.5concentration only on very few days exceeded 75 μg m-3. On several days after the SSW onset when the stratospheric pulse began to propagate downward (20-27 January 2021), the air quality in the BTH region worsened, and the area experienced higher pollution levels. Among the three representative stations, the maximum PM2.5concentration is observed in Shijiazhuang (~164 μg m-3). With the first arrival of the stratospheric signals descending to the surface, the concentration of PM2.5in the three cities decreased dramatically from 28 January to 9 February. As the stratospheric pulse disappeared, another pollution process occurred from 10 to 14 February that was consistently observed in the three cities, as they had severe pollution levels. Despite a policy banning fireworks and firecrackers, human activities during the Spring Festival might still have had some impact on PM2.5concentration (not shown). Immediately after the second stratospheric pulse signal reached the near-surface layer, the PM2.5concentrations in three representative cities of the BTH region dropped rapidly to their lowest values. Specifically, on 15 February,the PM2.5concentration dropped to 8 μg m-3, 13 μg m-3,and 58 μg m-3in Beijing, Tianjin, and Shijiazhuang, respectively.
According to the time series of the PM2.5concentrations in the three representative cities during the SSW (Fig. 2),the evolution of the PM2.5is divided into five different periods. The spatial distribution of the PM2.5concentration in the BTH region during these different periods is shown in Fig. 3. The evolution of the PM2.5in December 2020 showed regular quasi-biweekly changes, which might be related to tropospheric biweekly variability when the stratospheric signals were weak and did not begin to propagate downward. We mainly focused on the spatial distributions of the PM2.5in the five periods during January and February 2021 according to whether or not the stratospheric downward impact is active.
The first phase was from 29 December 2020 to 19 January 2021, covering from the onset to early stage of the SSW. The PM2.5concentration was lower than 30 μg m-3in the northern part of the BTH region, and the air quality was relatively excellent (falling between 0-35 μg m-3). In contrast, the PM2.5concentration was lower than 50 μg m-3in the southern part, and the air quality was good (falling between 35-75 μg m-3; Fig. 3a). In the second period from 20-27 January, the concentration of PM2.5in the BTH region increased significantly. The PM2.5concentration reached the light pollution level in the central and northern part of the BTH region, and the southern part reached the moderate pollution level (Fig. 3b). In the third stage from 28 January-8 February with the first stratospheric pulse reaching the troposphere and near surface, the concentration of the PM2.5in the BTH region dropped dramatically, and the air quality in the BTH region reached a good level (Fig. 3c).In the fourth period from 9-13 February when the negative NAM-like variation was absent, the heaviest pollution center appeared in the central part of the BTH region(> 130 μg m-3), reaching the moderate pollution level, and most parts of the BTH region reached the light pollution level (Fig. 3d). In the fifth period from 14-25 February when the second SSW signal pulse propagated downward to the ground, the PM2.5concentration in the BTH region was greatly reduced, and the air quality turned good (Fig. 3e).
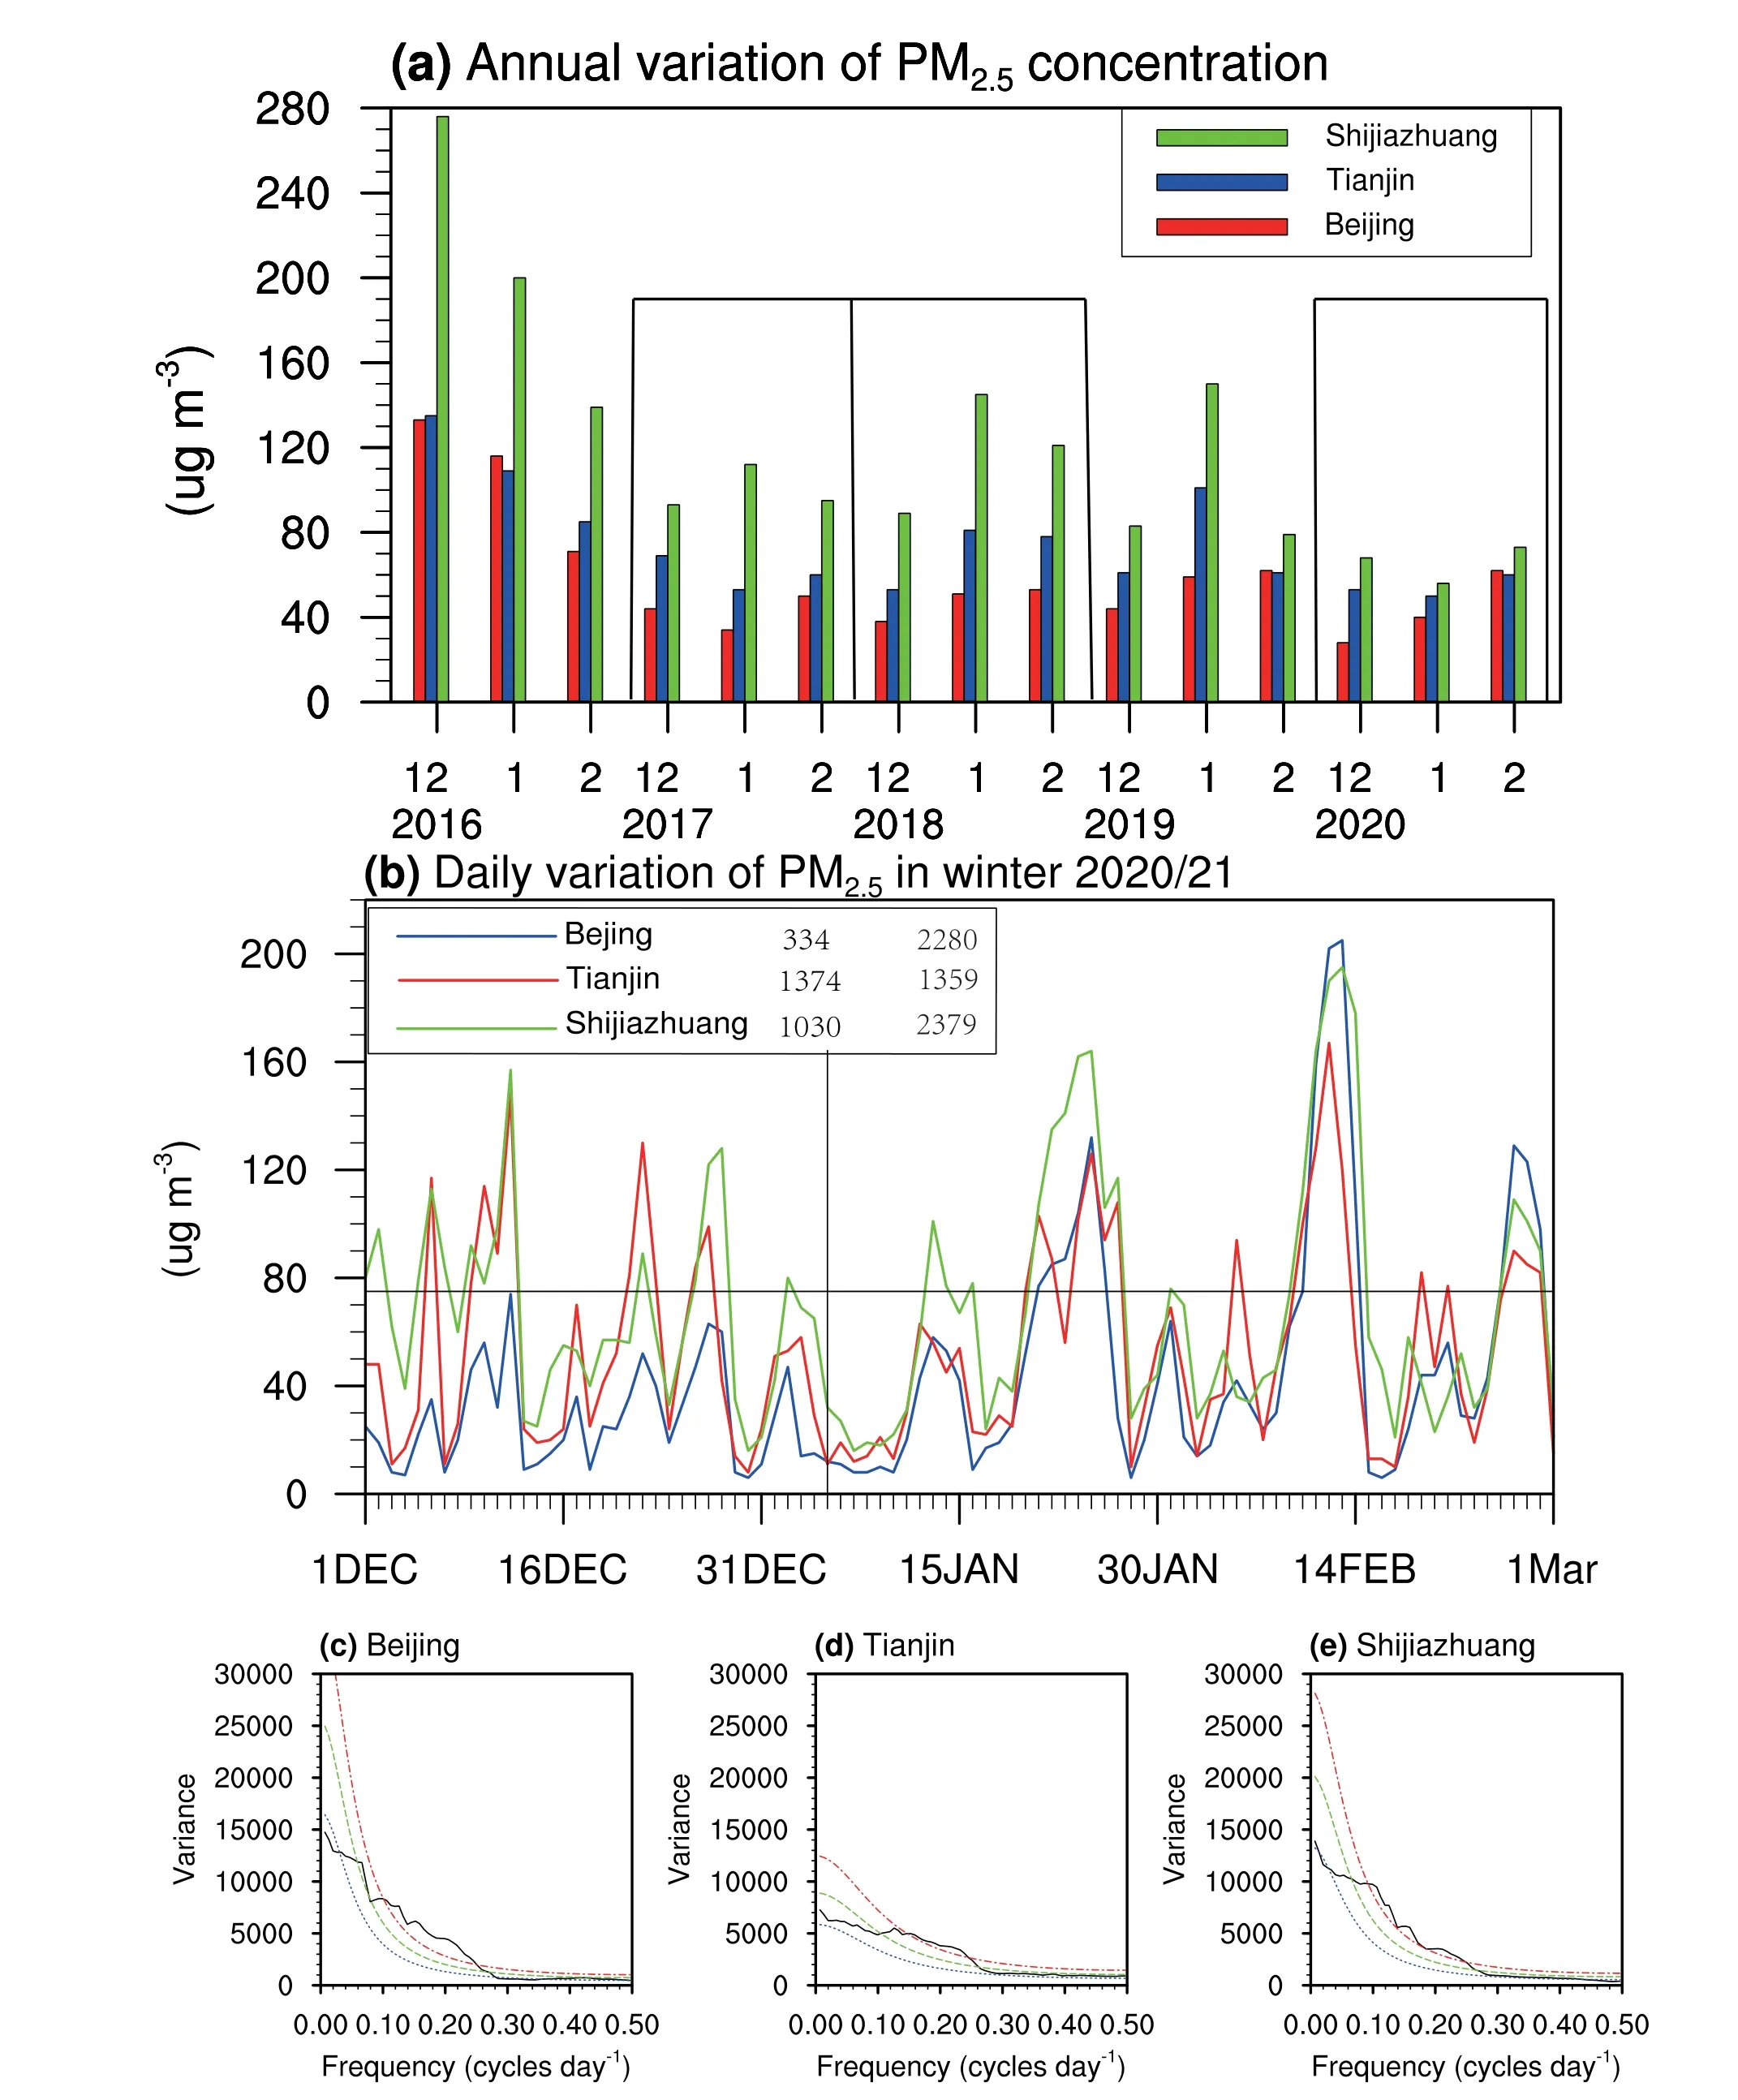
Fig. 2. (a) Monthly PM2.5 content in three representative cities of the BTH region during the last five winters. (b) The temporal evolution of PM2.5 concentrations in three representative cities from 1 December 2020 to 28 February 2021. The gray horizontal line indicates 75 μg m-3, which is the light pollution threshold. The onset date of the SSW is marked by the vertical line. The mean day-by-day variance for the PM2.5 concentrations before and after the onset of the SSW is also printed on the top left for the three representative cities. (c-e) Power spectrum of the PM2.5 concentration in the three representative cities.
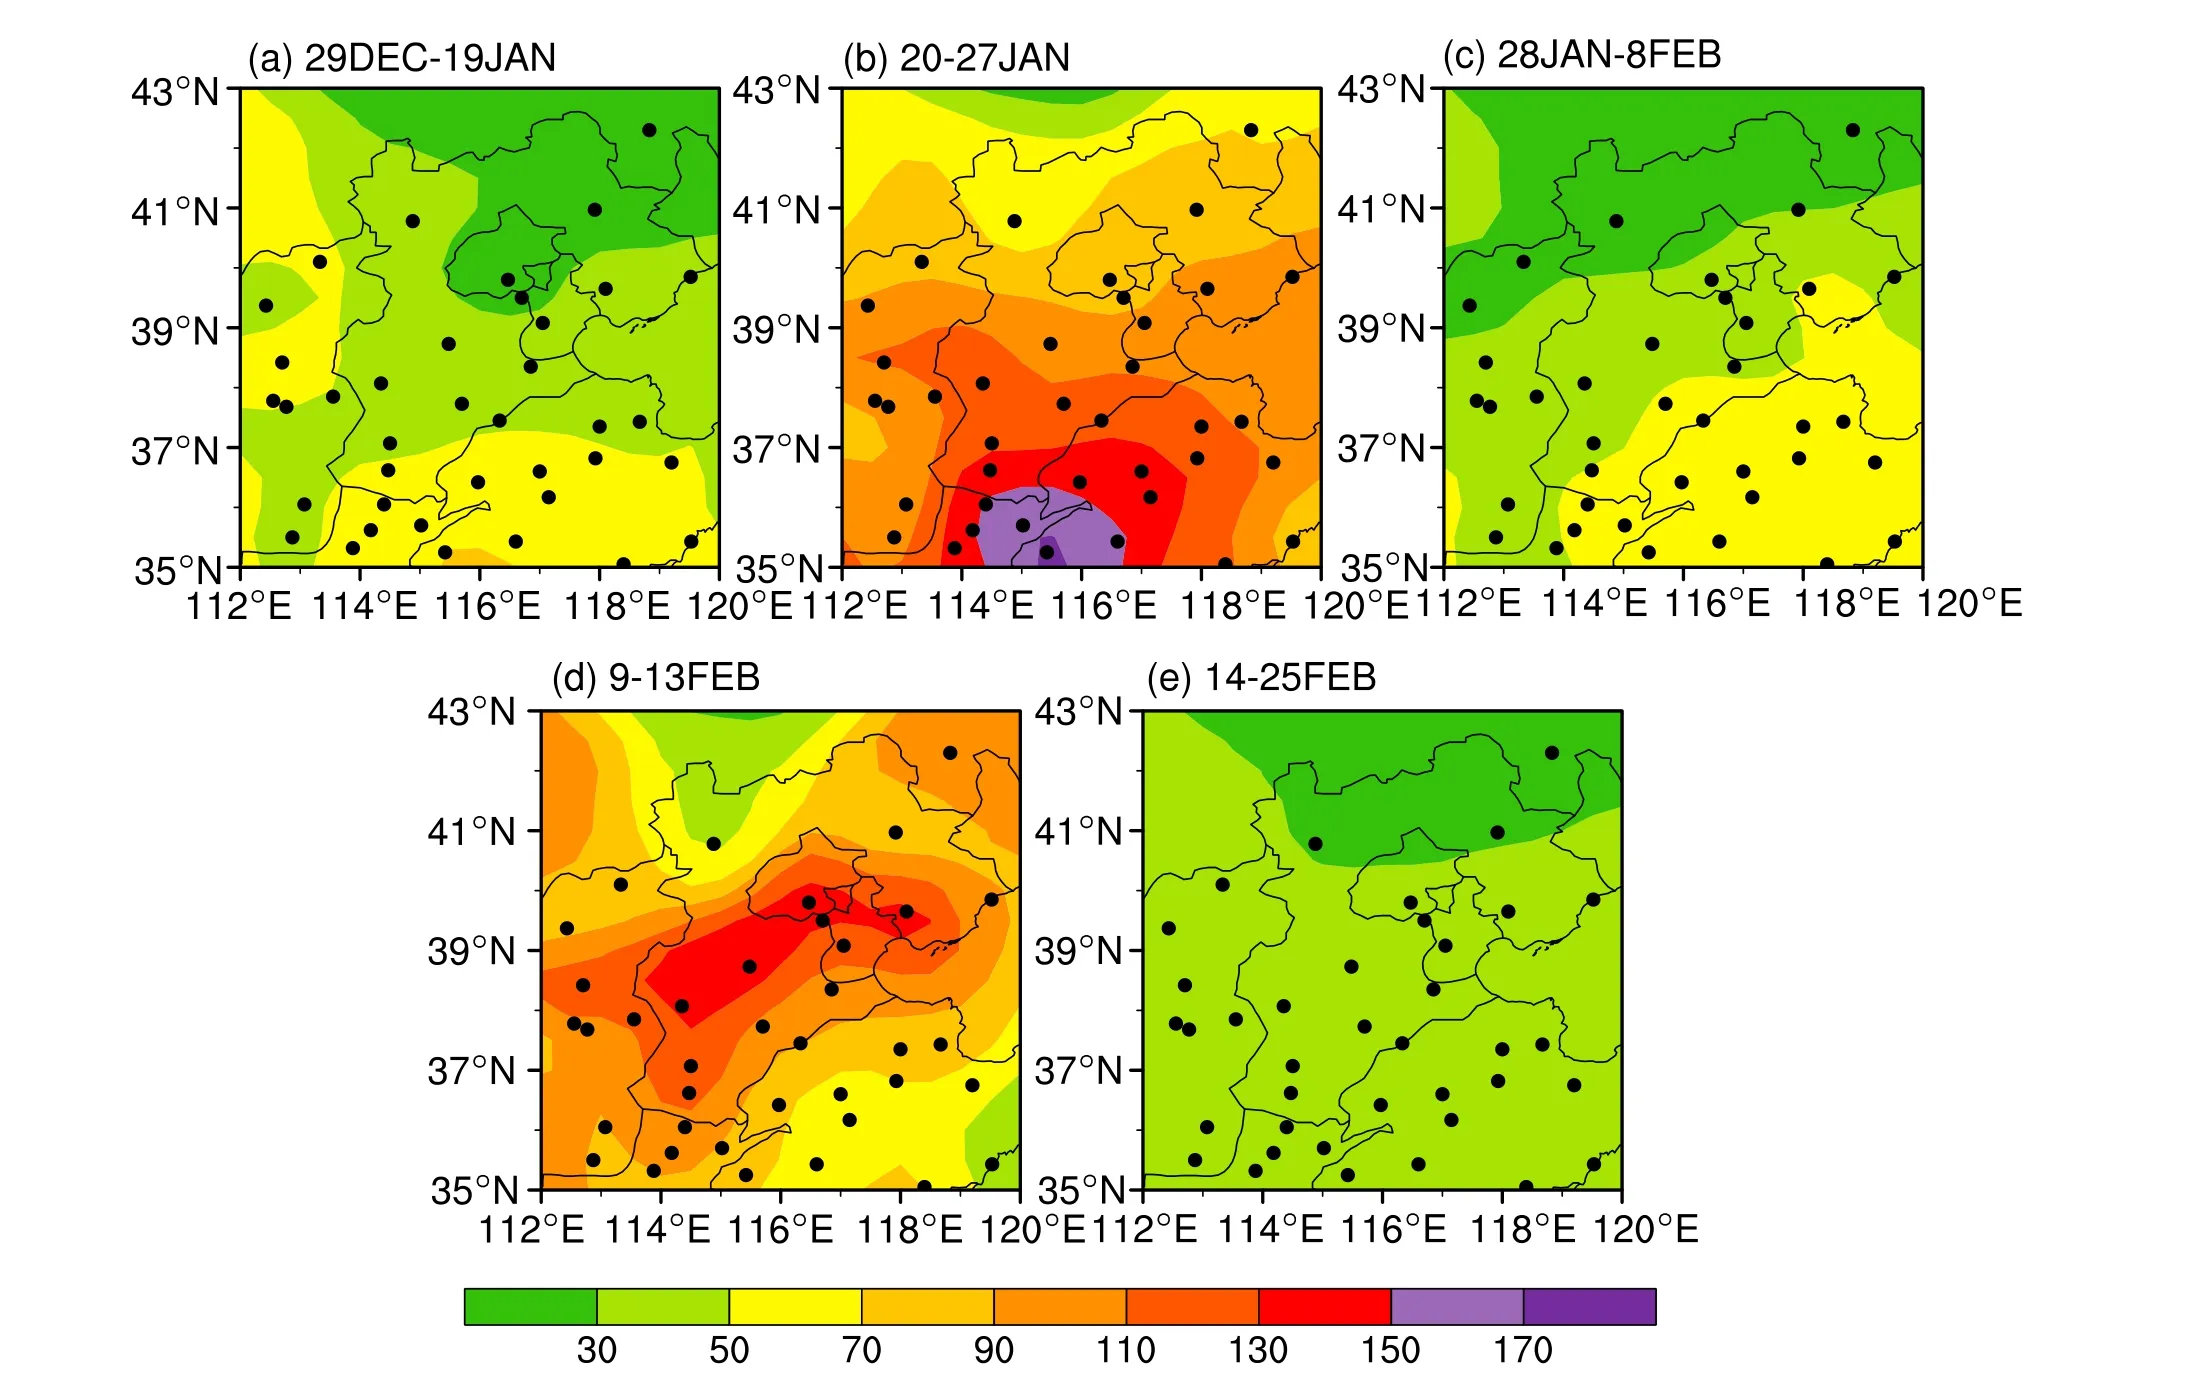
Fig. 3. Spatial distribution of the PM2.5 concentration at different stages of the January 2021 SSW in the BTH region(units: μg m-3). (a) The mean during 29 December 2020-19 January 2021. (b) The mean during 20-27 January 2021. (c) The mean during 28 January-8 February 2021. (d) The mean during 9-13 February 2021. (e) The mean during 14-25 February 2021. The black dots show the geographical positions of the 48 environmental observation stations in the BTH region.
4. Large-scale circulation evolution in different stages of the SSW
4.1. Circulation evolution in the stratosphere
The evolution of the stratospheric polar vortex in five subperiods is shown in Fig. 4. In the first phase from 29 December 2020 to 19 January 2021, the height distribution at 10 hPa resembles a wavenumber-1 pattern (Fig. 4a). Specifically, the low center of the vortex was located in the North Atlantic (center: < 29 000 m), and a high developed over the North Pacific and Alaska regions (center: > 31 250 m).During the second period from 20-27 January 2021, the center of the polar vortex moved eastward and stretched to cover the entire north Eurasian region as the height in the low center increased (center: < 29 500 m). Meanwhile, the high center also moved eastward to Alaska (Fig. 4b). During the third period from 28 January to 8 February when the first stratospheric signal pulse propagated downward to the near surface, the polar vortex moved back to the North Atlantic and began to recover (Fig. 4c). During the fourth stage from 9-13 February, the polar vortex recovered to a strong state with the center lower than 29 000 m. Meanwhile, the center of the high pressure also moved westward to the Kamchatka Peninsula region (Fig. 4d). In the fifth stage from 14-25 February 2021 when the second pulse had descended to the ground, the stratospheric polar vortex covered the North Pole again (Fig. 4e).
4.2. Circulation evolution in the troposphere
The distributions of the geopotential heights at 500 hPa during the five stages of the SSW event are shown in Fig. 5.In the first stage during 29 December 2020-19 January 2021 (i.e., in the early stage of the SSW onset), previous studies have revealed an enhancement of the tropospheric planetary wave activities, which propagated upward and affected the stratosphere (Lu et al., 2021b; Rao et al., 2021b). The tropospheric circulation associated with the enhanced wave activities in this period might favor PM2.5dilution in the BTH region. The 500-hPa height field presented three climatological troughs and three climatological ridges (Fig. 5a).These three troughs were located over the East Asian coast,western Europe, and eastern North America. The trough located over East Asia was the strongest, and the BTH region was just to the west of the climatological trough. The enhanced northwesterly winds provided a good diffusion condition for the PM2.5, corresponding to a period with good air quality.

Fig. 4. Distribution of the 10-hPa geopotential heights (units: gpm) during five periods of the January 2021 SSW. (a) The mean during 29 December 2020-19 January 2021. (b) The mean during 20-27 January 2021. (c) The mean during 28 January-8 February 2021. (d) The mean during 9-13 February 2021. (e) The mean during 14-25 February 2021.
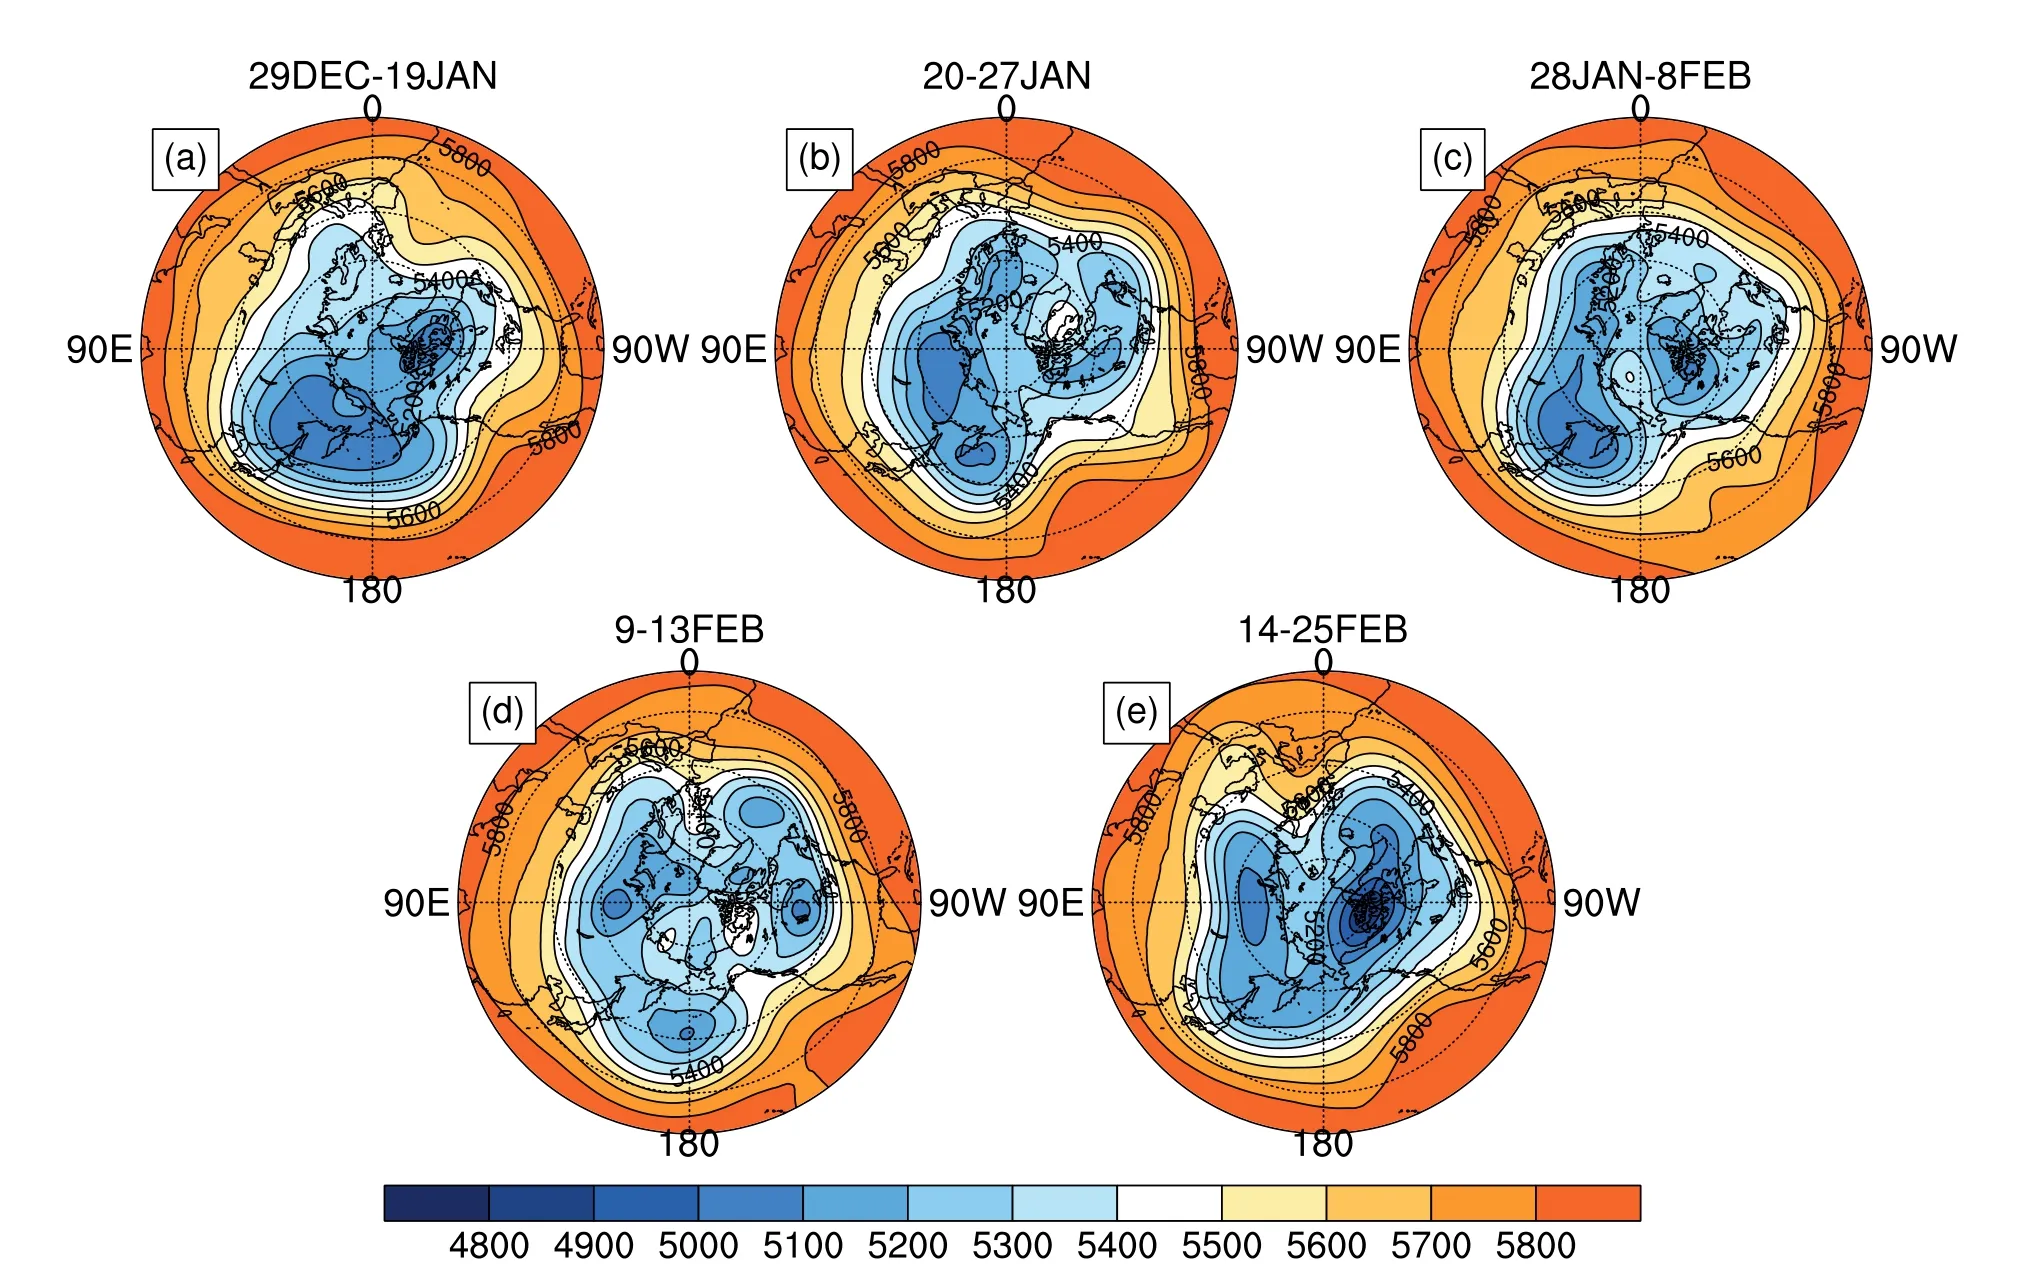
Fig. 5. Distribution of the 500-hPa heights (units: gpm) during five periods of the January 2021 SSW. (a) The mean during 29 December 2020-19 January 2021. (b) The mean during 20-27 January 2021. (c) The mean during 28 January-8 February 2021. (d) The mean during 9-13 February 2021. (e) The mean during 14-25 February 2021.
In the second period from 20-27 January 2021, the 500-hPa height displayed an elongated polar vortex split into two centers, one over Siberia and the other over the North Pacific (Fig. 5b). This period was characterized by a strong zonal circulation pattern over North China, so the BTH area was dominated by westerly airflow, consistent with the enhanced air pollution in this period. In the third period from 28 January-8 February when the first SSW signal pulse propagated downward to the ground, the 500-hPa troughs seemed to deepen again (Fig. 5c). Similar to the first period, the largest trough was still located over the east coast of Asia, and the BTH region became controlled by the northwesterly airflow again. The enhanced meridional circulation pattern favored the reduction of air pollution.
During the fourth period from 9 to 13 February when the stratospheric influence was absent, the 500-hPa height distribution became more zonally symmetric again (Fig. 5d).As the trough over the eastern coast of Asia became weak,the PM2.5concentration soon reached its maximum in the winter of 2020/21. The transient cessation of the descending stratospheric signals and flattening of the climatological troughs provided the necessary meteorological conditions for the accumulation of air pollutants. In the fifth period from 14 to 25 February when the second stratospheric signal pulse had already propagated downward to the near-surface layer, the westerly circulation turned into a more meridional circulation pattern (Fig. 5e). Consequently, the BTH region was controlled by the northwesterly airflow on the west side of the East Asian trough.

Fig. 6. Distribution of the geopotential height anomalies at 500 hPa (shadings; units: gpm) and zonal wind anomalies at 200 hPa(contours; units: m s-1; interval: 3) in Eurasia during five periods of the January 2021 SSW. The shadings show anomalies at 500 hPa (units: m), and the contours show the zonal wind anomalies at 200 hPa (units: m s-1; interval: 3). (a) The mean during 29 December 2020 -19 January 2021. (b) The mean during 20-27 January 2021. (c) The mean during 28 January-8 February 2021. (d) The mean during 9-13 February 2021. (e) The mean during 14-25 February 2021. The green box shows the focused BTH region.
5. Influence of atmospheric circulation anomalies related to stratosphere-troposphere coupling on PM2.5 in the BTH region
5.1. East Asian winter monsoon systems
The East Asian winter monsoon (EAWM) is a critically important factor controlling the East Asian weather and climate (Li et al., 2016, 2019) that usually modifies the PM2.5content, leading to a formation of severe PM2.5pollution(Zhang et al., 2020; Lu et al., 2021a). In the first period from 20 December 2020 to 19 January 2021, positive height anomalies were observed in Nova Zembla and negative height anomalies were observed over Northeast China,which resembles a positive Eurasian (EU) circulation mode(Liu et al., 2014; Wang and Zhang, 2015). At the same time,the subtropical jet at 200 hPa was enhanced in East Asia at 30°-45°N (Fig. 6a). It can be seen that at the near surface a strong positive sea level pressure (SLP) anomaly center developed around Nova Zembla (18 hPa), and most parts of Asia were anomalously cold (Fig. 7a). In the second period from 20-27 January 2021, the Siberian Plain was controlled by negative height anomalies, while the east coast of Asia was affected by positive height anomalies at 500 hPa (Fig. 6b).This almost out-of-phase distribution of height anomalies as compared with the first period denotes that the climatological trough and ridge were flattened. In contrast, anomalous high pressure developed in north Eurasia in the near surface, and anomalous low pressure developed in East Asia (Fig. 7b).These signals indicate that the EAWM weakened at this stage, which can also be confirmed by the surface warm anomalies across parts of East Asia.
In the third period from 28 January-8 February when the first stratospheric warming signal pulse descended to the ground, the 500-hPa height anomaly pattern is fairly similar to the first period with the positive EU teleconnection being strengthened (Fig. 6c). Meanwhile, positive pressure anomalies moved further equatorward, which indicates that the EAWM strengthened, and another cold air outbreak occurred in East Asia (Fig. 7c). In the fourth period, positive height anomalies still existed in the Arctic and extended southward to the east coast of Asia. Negative anomalies appeared in the midlatitudes from Ural Mountain to Baikal Lake at 500 hPa (Fig. 6d). The circulation pattern in this period is nearly identical to that in the second stage. In the fifth period when the second stratospheric warming pulse had descended to the troposphere, the midlatitudes were controlled by zonally homogeneous negative height anomalies,and the Arctic region was covered by positive geopotential height anomalies, resembling a negative AO pattern(Fig. 6e). This negative AO-like pattern extended downward to the ground, corresponding to cold anomalies in north Eurasia (Fig. 7e).
5.2. Boundary layer meteorological conditions
As the EAWM system presented an evident subseasonal variation during the descent of the stratospheric warming signal, local boundary layer meteorological conditions were inevitably changed. A change in the boundary layer meteorological conditions finally affected the PM2.5in the BTH region. The distribution of the air stability anomalies in the lower troposphere and the wind anomalies at 850 hPa around the BTH region during the five periods of the SSW are shown in Fig. 8. In the first period, strong northwesterly wind anomalies appeared in the BTH region at 850 hPa, and the air stability in the lower troposphere decreased. These conditions were conducive to a decrease of the PM2.5concentration in the BTH region, so the air quality was improved (Fig.8a). In the second period, strong southeasterly wind anomalies replaced the northerlies to the south of the BTH region, and southerly wind anomalies developed over the BTH region at 850 hPa. A positive temperature anomaly difference between 850 hPa and 1000 hPa (maximum: 3.5°C) developed in the core of the BTH region, implying the establishment of a temperature inversion, which helped to accumulate pollutants in the boundary layer (Huang et al., 2018; Chang et al.,2020; Yin et al., 2021). In the third period when the first stratospheric signal pulse associated with the SSW had reached the near surface, the BTH region was covered by due westerly wind anomalies at 850 hPa, and the atmospheric static stability also decreased in the lower troposphere (Fig.8c). In the fourth period when the first stratospheric signal became dormant, anomalous southerly winds at 850 hPa prevailed in the BTH region and positive differences between 850-hPa and 1000-hPa temperatures (maximum: 2.5°C)formed around the BTH region (Fig. 8d). In the fifth period when the second stratospheric pulse had reached the near surface, northwesterly winds increased again in the lower troposphere (Fig. 8e). In summary, the PM2.5concentration exhibits a strong subseasonal variability as the SSW signal pulse arriving at the ground varies.
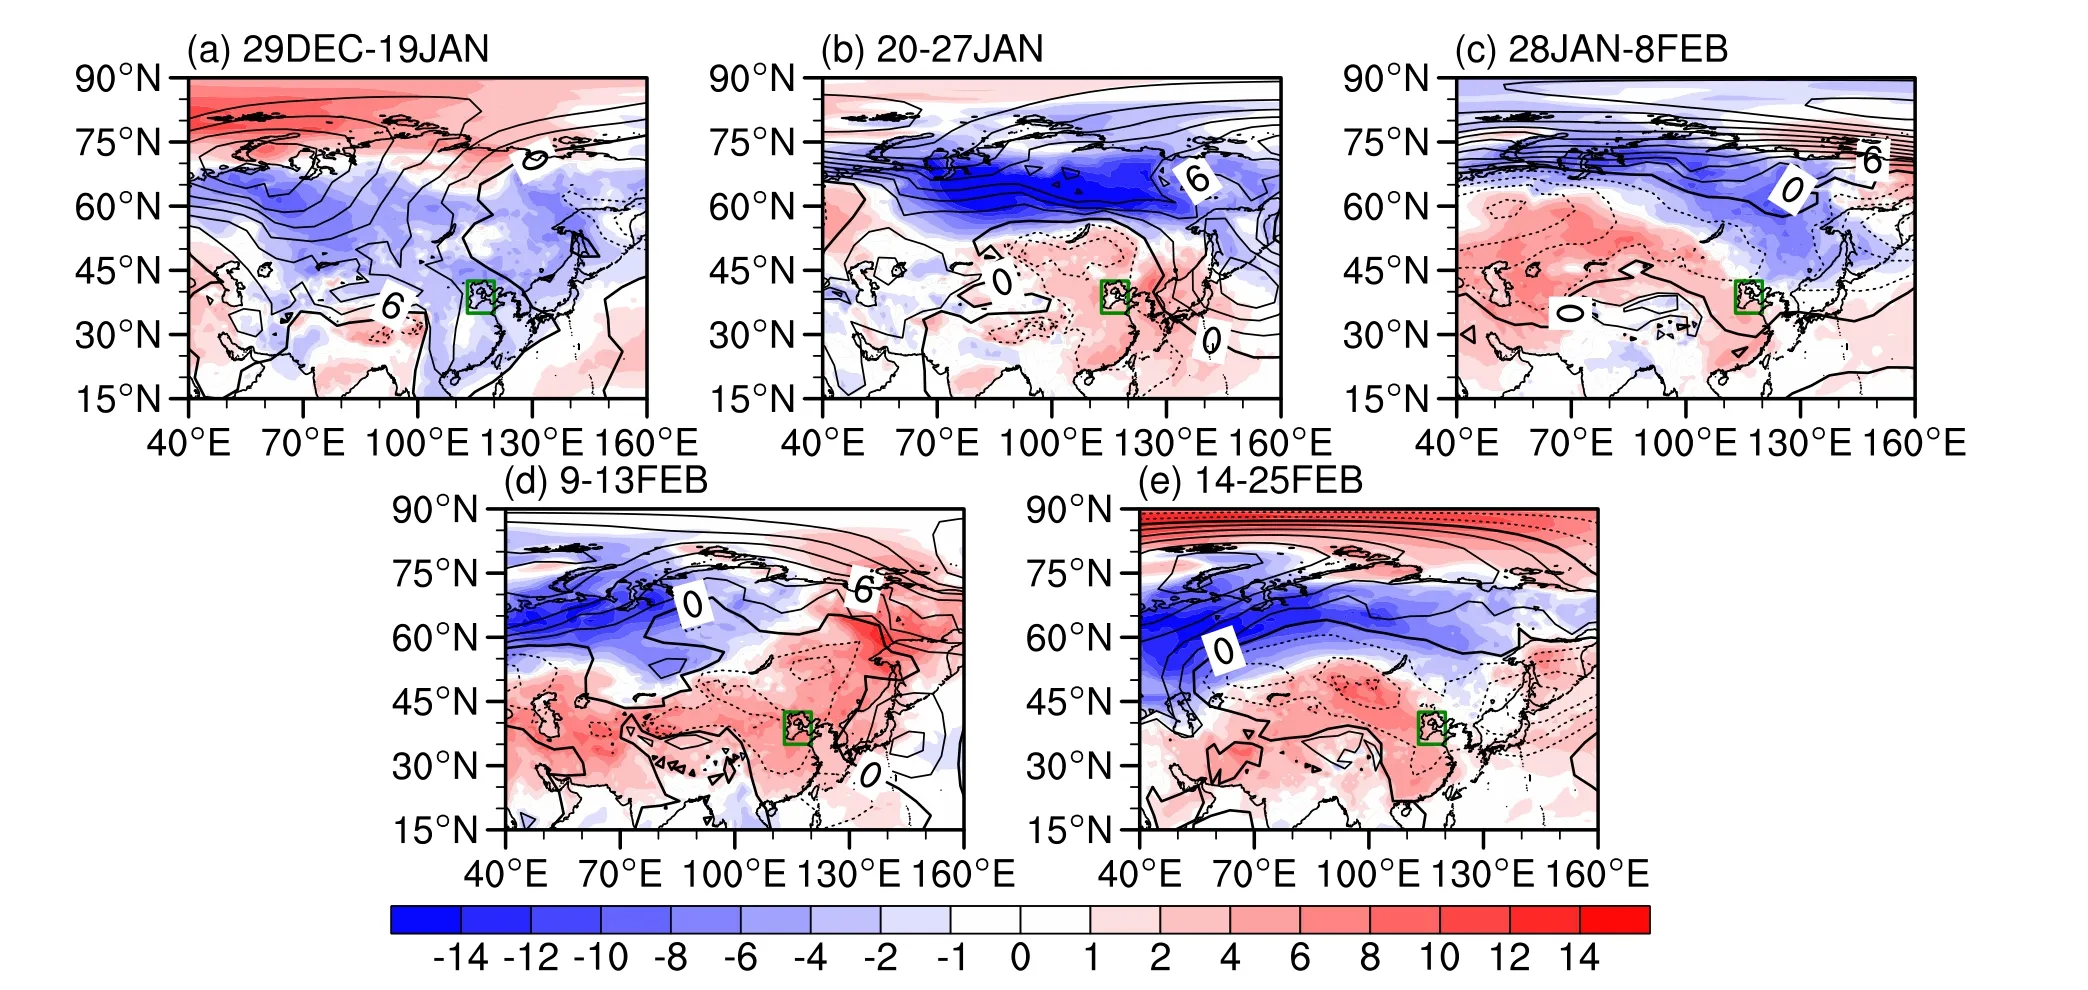
Fig. 7. As in Fig. 6, but for the sea level pressure anomalies (contours; units: hPa; interval: 3) and 2-meter air temperature anomalies (shadings; units: °C) (a) The mean during 29 December 2020-19 January 2021. (b) The mean during 20-27 January 2021. (c) The mean during 28 January-8 February 2021. (d) The mean during 9-13 February 2021. (e) The mean during 14-25 February 2021. The green box shows the focused BTH region.
Higher relative humidity is conducive to the moisture absorption and growth of aerosol particulates, and this happens especially when anomalous southerly winds develop in the lower troposphere over the BTH region. Considering that the terrain elevation around the BTH region is low on the south side and high on the north side, the convergence pattern in the BTH region with the anomalous easterlies developing on the south side helps to accumulate air pollutants (Yin and Wang, 2016; Sun et al., 2018; Chen et al., 2021; Lu et al., 2021a). Figure 9 shows the evolutions of surface wind anomalies and surface relative humidity anomalies around the BTH region in the five periods of focus. In the first period, the relative humidity of the surface layer in the central and southern parts of the BTH region had a drying center(the anomalies: ~8%) accompanied by strengthened northwesterly winds (Fig. 9a). In the second period, the relative humidity of the surface layer in the BTH region increased rapidly, with a positive anomaly greater than 8%. At the same time, a strong southeasterly wind anomaly transported water vapor from the Bohai Bay to the BTH region (Fig.9b). In the third period, the BTH region turned dry again with the negative relative humidity anomaly exceeding 11%as the surface westerly winds strengthened (Fig. 9c). In the fourth period, the relative humidity in the BTH region accumulated rapidly again with the maximum positive center situated in the heart of the BTH region (Fig. 9d). In the fifth stage, the relative humidity in the BTH region decreased as anomalous northwesterly winds appeared, suppressing an increase in the air pollutant concentration (Fig. 9e).
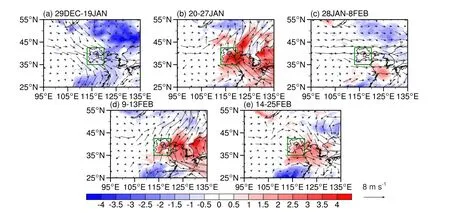
Fig. 8. Distribution of the air stability anomalies in the lower troposphere (T850-T1000; shadings; units: °C) and wind anomalies at 850 hPa (vectors) around the BTH region in five periods of the SSW. (a) The mean during 29 December 2020-19 January 2021. (b) The mean during 20-27 January 2021. (c) The mean during 28 January-8 February 2021. (d) The mean during 9-13 February 2021. (e) The mean during 14-25 February 2021. The green box shows the focused BTH region.
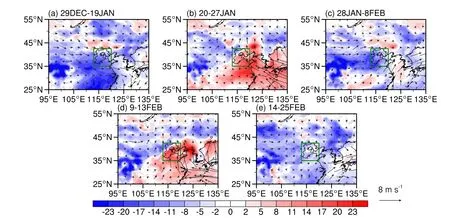
Fig. 9. Distribution of surface wind anomalies (vectors) and surface relative humidity anomalies (shadings; units: %) around the BTH region in five periods of the SSW. (a) The mean during 29 December 2020-19 January 2021. (b) The mean during 20-27 January 2021. (c) The mean during 28 January-8 February 2021. (d) The mean during 9-13 February 2021. (e) The mean during 14-25 February 2021. The green box shows the focused BTH region.
The height of the boundary layer is an important indicator to measure the capacity for diffusion of air pollutants(Huang et al., 2018, 2020). A high boundary layer height helps to diffuse air particulates, while a low boundary layer height favors the accumulation of pollutants. During the first period, the height of the boundary layer in the BTH region heightened with an anomaly around 100 m (Fig.10a). During the second period, the height of the boundary layer in the BTH region lowered with a negative anomaly magnitude around 100 m (Fig. 10b). During the third period,the elevation of the boundary layer in the BTH region conduced to the vertical diffusion of air particulates again(Fig. 10c). During the fourth period, the boundary layer top in the BTH region decreased with a negative height anomaly center around Beijing (~200 m), which corresponds to a fast accumulation of air pollutants. In fact, the PM2.5level was maximized in the central BTH region during this period throughout the winter (Fig. 10d). In the fifth stage,the boundary layer top in the BTH region began to heighten,leading to gradually improved air quality (Fig. 10e).
6. Summary
Using the PM2.5concentration observations and the ERA5 reanalysis, the PM2.5distributions during several periods of the SSW are analyzed for the BTH region where high PM2.5content is more easily observed than most other parts of China in past years (Sun et al., 2018; Ye et al., 2018;Zhang et al., 2020). Changes of the stratospheric and tropospheric circulations associated with the subseasonal variation of the PM2.5are analyzed for several periods during the SSW. The main findings of this study are as follows.
i) An SSW event occurred in January 2021 in the Arctic stratosphere, and it is reported to have been accompanied by continental-scale cold waves in Eurasia and North America.This study further investigates the subseasonal variation of the PM2.5concentration in the BTH region during this SSW.Before the SSW onset, the airborne PM2.5content in the BTH region showed smaller variability than after the SSW onset. After the SSW onset, subseasonal variability of the PM2.5concentration increased. Therefore, the SSW onset might not only affect the mean but also the variability of the local PM2.5.
ii) The diagnostic results show that two stratospheric pulses associated with the weakening stratospheric polar vortex descended to the ground twice after the onset of the January 2021 SSW. After the stratospheric pulse associated with the SSW had reached the near surface, the air quality in the BTH region was high with a low PM2.5level during the winter of 2020/21. When the stratospheric signal was dormant, the PM2.5concentration increased quickly, corresponding to periods of low-quality air in the BTH region.
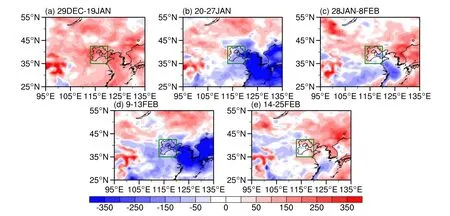
Fig. 10. Distribution of the top height anomalies of the planetary boundary layer (PBLH; units: m) around the BTH region in five periods of the SSW. (a) The mean during 29 December 2020-19 January 2021. (b) The mean during 20-27 January 2021. (c) The mean during 28 January-8 February 2021. (d) The mean during 9-13 February 2021. (e) The mean during 14-25 February 2021. The green box shows the focused BTH region.
iii) The zonal mean easterly anomalies during the 2021 SSW lasted for 53 days from 26 December 2020 to 16 February 2021, longer than the composite SSW lifecycle in other reports (Cao et al., 2019; Rao et al., 2021a). After the SSW onset, as the possibility of a cold air outbreak in East Asia increased, cold air activities due to the strengthened East Asian monsoon helped to dilute the PM2.5concentration.The modulation of the stratospheric variation on the East Asian monsoon might bridge the relationship between the SSW and the BTH environment if the emission changes little throughout the winter.
iv) Both tropospheric and stratospheric variabilities are related to the subseasonal variation of the PM2.5in one of the regions with densest population, assuming the emission is stable. The air quality was evidently good in the three subperiods. Before the 2021 SSW onset, the tropospheric planetary waves strengthened and propagated upward to affect the stratosphere, which also directly led to a period with clean air. Similarly, when the stratospheric pulses had propagated downward to affect the troposphere twice, a negative NAM/AO phase developed in the troposphere and near surface, which was accompanied with the enhanced EAWM and therefore a decrease in the PM2.5content around the BTH region. To the contrary, in the weakening period of the tropospheric waves that propagated upward to disturb the Arctic stratosphere, an eight-day high-PM2.5concentration process occurred in the BTH region. During intermittent and dormant periods after the SSW onset, a serious pollution process occurred in the winter of 2020/21 in the BTH region, which lasted as long as five days.
v) Different from the 2018 and 2019 SSW cases,changes in local meteorological conditions in the BTH region cooperated consistently with the large-scale circulation to affect subseasonal variation of the PM2.5concentration. Specifically, before the SSW onset and during the two stratospheric SSW pulses having reached the near surface,the static stability in the lower troposphere dramatically decreased, northwesterly winds prevailed, atmospheric relative humidity was reduced, and the boundary layer thickened, all of which helped to dilute and diffuse air pollutants in the BTH region and therefore improve the local air quality. In contrast, during the weakening period of the tropospheric waves that propagated upward to disturb the stratosphere, and during the intermittently dormant period of the stratospheric effect, a temperature inversion developed in the lower troposphere around the BTH region, anomalous southerly winds prevailed, atmospheric moisture increased,and the boundary layer top lowered, all of which favor the accumulation and growth of pollutants due to their moisture absorption and therefore transient nature.
Since China took strict measures to control the emission of pollutants associated with fossil fuel combustion, the PM2.5concentration in megalopolises in winter has decreased gradually (Ding et al., 2019). This study further reveals that subseasonal variability of the PM2.5content is also modulated by the background circulation state in both the stratosphere and the troposphere. Enhanced subseasonal variability of the PM2.5content in the BTH region during stratospheric extreme events such as SSWs highlighted the important role of the stratosphere in affecting the regional air environment (Chang et al., 2020; Huang et al., 2021; Lu et al., 2021a). A better understanding of the stratospheric variability and the regional air quality might help to improve the environmental prediction in winter and provide suggestions to policymakers for controlling emission of industrial waste gases. We also noticed differences in the PM2.5concentration evolutions among the three most recent SSW cases(February 2018, January 2019, and January 2021). More work is still required to investigate the common features and individual characteristics for different types of stratospheric extreme events and their roles in controlling the regional environment.
Acknowledgements. This work was supported by the National Natural Science Foundation of China (Grant Nos.42088101 and 42175069), and the National Key R&D Program of China (Grant No. 2018YFC1505602).
Data availability statement. The ECMWF provides the ERA5 reanalysis (https://cds.climate.copernicus.eu/cdsapp#!/search?type=dataset). The PM2.5observations in the BTH region are compiled by the Ministry of Environmental Protection of China (https://www.aqistudy.cn/historydata/).
 Advances in Atmospheric Sciences2022年10期
- Advances in Atmospheric Sciences的其它文章
- An Unprecedented Record Low Antarctic Sea-ice Extent during Austral Summer 2022
- 2021: A Year of Unprecedented Climate Extremes in Eastern Asia,North America, and Europe
- Transport Patterns and Potential Sources of Atmospheric Pollution during the XXIV Olympic Winter Games Period
- An Extreme Drought over South China in 2020/21 Concurrent with an Unprecedented Warm Northwest Pacific and La Niña
- How Well Do CMIP6 and CMIP5 Models Simulate the Climatological Seasonal Variations in Ocean Salinity?
- How Frequently Will the Persistent Heavy Rainfall over the Middle and Lower Yangtze River Basin in Summer 2020 Happen under Global Warming?
