
Prognostic implication and oncogenic role of RHCG in lung adenocarcinoma
2022-10-13 13:53:24YiDanSunXiaoJiangLiPeiYingYangMinNaHuangYingJieJia
Precision Medicine Research 2022年3期
Yi-Dan Sun,Xiao-Jiang Li,Pei-Ying Yang,Min-Na Huang,Ying-Jie Jia*
1Department of Oncology,First Teaching Hospital of Tianjin University of Traditional Chinese Medicine,Tianjin 300193,China.
Abstract
Keywords: lung adenocarcinoma; RHCG; prognosis; immune implication; TCGA; oxidative stress;autophagy
Introduction
Lung adenocarcinoma (LUAD),as the most common pathological type of lung cancer, has attracted much attention due to its high mortality and malignancy. Meanwhile, LUAD is one of the most common lethal tumors in the world [1]. Although the current LUAD-related tumor diagnosis and treatment guidelines are increasingly mature, there are clear surgery, radiotherapy and chemotherapy, targeted molecules and immunotherapy.However,because LUAD is not easily detected in the early stage, the diagnosis time is relatively late, and the problems such as resistance to drug resistance in the anti-tumor quality have always been difficult problems. With the advancement of medical technology, immunotherapy has made undeniable progress in the treatment of lung cancer,but the 5-year survival rate of LUAD patients is still unsatisfactory[2].This relative inefficiency is mainly due to the lack of information about the tumor microenvironment during the treatment decision-making process.For this reason,many studies have focused on discovering a new prognostic assessment method to help individualize the treatment of patients with LUAD.
Autophagy is a self-degrading mechanism involved in many biological processes, including cell death, survival, proliferation or migration [3, 4]. In tumors, autophagy plays a vital role in tumorigenesis as well as cancer progression and resistance to therapy[5]. In general, high levels of autophagy in malignant cells are associated with tumor progression and poor patient prognosis [6].Oxidative stress is a state of imbalance between oxidative and antioxidant effects in the human body [7]. Increased neutrophil infiltration and oxidative intermediates contribute to disease development through oxidative stress[8].Current research shows that oxidative stress regulates cancer progression [9]. At present, the research progress on cancer driver gene regulation is gaining momentum. Reactive oxidative species (ROS) elevated by oxidative stress have been implicated in cancer progression and drug resistance,while autophagy acts as a ROS scavenger in cancer cells.However,the regulation of autophagy and reactive oxygen species in various cancer cells in the tumor-promoting mechanism remains complex. Links between ATG genes and ROS production may contribute to tumorigenesis, malignancy and cancer recurrence. A better understanding of the regulation of ROS and autophagy may facilitate the use of diagnostic and prognostic markers and as a therapeutic target in cancer therapy.
In the Rh family, C glycoprotein (RHCG) belonged to the rhesus monkey (Rh) family and was first identified as the Rh blood group antigen [10]. Acts as an electrically neutral and bidirectional ammonium transporter [11]. Regulates transepithelial ammonia secretion. It has been shown to play a role in cancer progression [12,13]. The present study shows that expression of RHCG is higher in LUAD compared to normal tissue [14]. Since January 2015,significant progress has been made in cancer immunotherapy.Programmed cell death protein 1 (PD-1) blockade is effective in treating Hodgkin lymphoma and offers hope of changing the treatment paradigm for the disease [15, 16]. In addition, PD-L1 inhibitors are currently hot spots in the modern treatment of LUAD,and their efficacy can often benefit most tumor patients, especially in malignant melanoma. However, the clinical efficacy of current immunotherapies including anti-CTLA4, anti-PD-1 and anti-PD-L1 in LUAD is uncertain. At present, there is an urgent need to further explore more promising markers, and the combined application can make the efficacy of LUAD better [17, 18]. The reasons for treatment ineffectiveness are complex and may be related to the lack of biomarkers to guide individualized immune targets. Such as tumor-associated macrophages and tumor-infiltrating neutrophils,etc., affect the prognosis and efficacy of chemotherapy and immunotherapy. Therefore, there is an urgent need to elucidate the immunophenotype of tumor-immune interactions and to identify novel immune-related biomarkers and therapeutic targets for LUAD.This study analyzed the differential expression of RHCG in LUAD samples. Functional analysis of key co-expressed genes related to autophagy and oxidative stress in RHCG was performed to reveal the role of RHCG in the progression of LUAD. The alteration of immune cell infiltration in the tumor microenvironment of LUAD by RHCG may be one of the mechanisms by which it exhibits an anti-tumor effect and may become a potential immunotherapy target for LUAD,which is beneficial for improving immunotherapy.
Materials and methods
Data sources and expression difference and correlation analysis of pan-cancer
We first combined a study of differential expression of RHCG in TCGA,TARGET, GTEx pan-cancer data. We downloaded pan-cancer data from the UCSC Genome Browser[19, 20].
Protein-protein interaction (PPI) and enrichment analysis
In this study, STRING 11.0 version was used to analyze the protein-protein interaction network between RHCG and its related immunomodulators in the TCGA-LUAD cohort [21-23]. Gene Ontology and Kyoto Encyclopedia of Genes and Genomes enrichment analysis were employed to explore the biological functions and pathways of these immunomodulators [24,25].
Evaluation of patient characteristics
We detected its diagnostic value for LUAD from TCGA based on RHCG expression. Receiver operating characteristic (ROC) curves were generated to estimate biomackers predicting patient prognostic survival [26]. We use “rms” and “foreign” to access the nomogram survival probability plot based on multivariate logistic regression. In addition, we assessed the index of concordance and compared nomogram estimates of survival probability with Kaplan-Meier estimates of survival probability.
RHCG gene set enrichment analysis
We used the computational method gene set enrichment analysis(GSEA) to determine the statistical significance of a preferentially defined set of genes and whether there were consistent differences between the two biological states. In this study, we permuted each gene combination analyzed a thousand times. The RHCG expression level was used as a phenotypic marker. The gene set“c2.cp.v7.2.symbols.gmt” was retrieved from a molecular marker database; potential enrichment pathways were analyzed with GSEA 4.0.3. In addition, normalized enrichment scores, adjustP-values andQ-values of GSEA were generated to separate enrichment pathways into two phenotypes.In our study,gene sets with nomP-value <0.05 and FDRQ-value <0.25 were considered significantly enriched.
Analysis of the relative abundance of tumor-infiltrating immune cells
To assess the relative correlation between RHCG expression and tumor infiltrating immune cells (TIICs), we used a gene expression-based deconvolution algorithm, CIBERSORT(http://cibersort.stanford.edu/) [27]. This method helps characterize the cellular composition of complex tissues. Using the CIBERSORT method, the relationship between RHCG high and low expression groups was assessed by the immune responses of 22 TIICs.TheP-value for each sample is then calculated according to the deconvolution algorithm.
Results
Pan-cancer correlation analysis of RHCG
We quantified the hazard ratio and significance of RHCG in pan-cancer by using the Logrank test to obtain a significance forest plot of overall survival prognostic risk in pan-cancer (Figure 1A). We used R software (version 3.6.4) to calculate the difference in expression between normal and tumor samples in each tumor. Using unpaired Wilcoxon Rank Sum and Signed Rank Tests to perform significance of differences analysis, we observed in 8 tumors significantly up-regulated such as UCEC (Tumor: -1.29 ± 3.32,Normal: -6.85 ± 2.88,P= 1.4e-10), CESC (Tumor: 4.64 ± 4.52,Normal:1.51 ±5.68,P=0.03),COAD (Tumor:-1.00 ±2.61,Normal:-1.54 ± 1.89,P= 1.3e-5), READ (Tumor: -0.80 ± 2.52, Normal:-1.54 ±1.87,P= 1.2e-9), LUSC (Tumor: 3.26 ±3.66, Normal:-2.71±2.81,P= 2.2e-91), significant down-regulation was observed in 21 tumors such as GBM (Tumor:-1.35 ±2.23, Normal: 0.36 ±1.39,P=9.0e-27), LGG (Tumor: -1.32 ± 1.62, Normal: 0.36 ± 1.39,P=5.2e-89), BRCA (Tumor: -2.80 ± 3.35, Normal: -0.80 ± 1.62,P=4.6e-36), LUAD (Tumor: -3.02 ± 3.20, Normal: -2.71 ± 2.81,P=1.4e-4). Differences between LUAD and normal samples. In addition,in order to analyze whether the expression of RHCG in pan-cancer affects the molecular mechanism of cancer, we analyzed the correlation between RHCG and various key genes. First, we investigated the marker genes of 44 three types of RNA modification(m1A(10), m5C(13), m6A(21)) genes and found that their expression in each sample correlated with RHCG(Figure 1B).Then, w RHCG was positively correlated with cg21548950 and cg09103291; RHCG was negatively correlated with cg11332236, cg01837657, cg24653181,cg02805106, cg10453365, cg12042113, cg18726691, cg18726691,cg10721782, cg07485916.e further explored the correlation between RHCG and each methylation site (Figure 2). To correlate molecular mechanisms, we calculated pearson correlations of RHCG and key immune checkpoints (Figure 1C) and marker genes of five classes of immune regulatory pathways(Figure 1D).
Significant differences in expression of RHCG
We combined all sample data in TCGA, TARGET and GTEx databases(PANCAN, N = 19131, G = 60499). Up-regulated in 8 tumors, such as UCEC (Tumor:-1.29 ±3.32, Normal:-6.85 ±2.88,P= 1.4e-10),CESC (Tumor: 4.64 ± 4.52, Normal: 1.51 ± 5.68,P= 0.03), COAD(Tumor: -1.00 ± 2.61, Normal: -1.54 ± 1.89,P= 1.3e-5), READ(Tumor: -0.80 ± 2.52, Normal: -1.54 ± 1.87,P= 1.2e-9), LUSC(Tumor: 3.26 ±3.66, Normal:-2.71 ±2.81,P= 2.2e-91), significant down-regulation was observed in 21 tumors such as GBM (Tumor:-1.35±2.23,Normal:0.36±1.39,P=9.0e-27),LGG(Tumor:-1.32±1.62, Normal: 0.36 ±1.39,P= 5.2e-89), BRCA (Tumor:-2.80 ±3.35,Normal: -0.80 ± 1.62,P= 4.6e-36), LUAD (Tumor: -3.02 ± 3.20,Normal: -2.71 ± 2.81,P= 1.4e-4) (Figure 3A). The differential expression of RHCG in pan-cancer and paired normal samples was basically consistent (Figure 3B). We then focused on the differential expression of RHCG in TCGA-LUAD tissues(Figure 3C-Figure 3D).We retrieved all the genes related to oxidative stress and autophagy from the Genecards database to obtain the key genes related to RHCG co-expressed genes and phenotypes for subsequent enrichment analysis of functions and molecular pathways. Venn diagram of the intersection of RHCG co-expressed genes and oxidative stress and autophagy-related genes in LUAD (Figure 3E-Figure 3F).
Construction of a PPI network of differentially expressed genes associated with oxidative stress and autophagy
A PPI was constructed by the maximum confidence interaction score was set to 0.4, which was analyzed and visualized by Cytoscape’s network analyzer tool (Figure 4A) using MCODE and CytoHubba plugins to screen and visualize the Top 10 closely related genes of the PPI network module (Figure 4B-Figure 4C). Subsequently, we analyzed the relationship between RHCG and AHSG, ALB, SERPINA4,LEP, SST, NOS2, DKK1, GATA4, MMP13 and HMGCS2 correlation(Figure 4D).
Functional enrichment analysis

Figure 2 Correlation between RHCG and each methylation site.(A,B) RHCG was positively correlated with cg21548950 and cg09103291.(C-L) RHCG was negatively correlated with cg11332236,cg01837657, cg24653181,cg02805106,cg10453365,cg12042113,cg18726691,cg18726691,cg10721782, cg07485916. RHCG, Rh family, C glycoprotein.

Figure 3 Significant expression differences of RHCG. (A, B) Differential expression of RHCG in pan-cancer in unpaired and paired non-tumor samples of pan-cancer and its corresponding patients. (C, D) Boxplots of RHCG differential expression between LUAD tissues and normal samples.(E) Volcano plots of co-expressed genes of RHCG in LUAD. (F) Venn diagram of the intersection of RHCG co-expressed genes and oxidative stress and autophagy-related genes in LUAD. RHCG, Rh family, C glycoprotein.
The subsequent enrichment analysis was performed on the 102 RHCG corexpression genes, which were displayed as histograms, bubble plots, chord plots and enrichment plots (Figure 5,Table 1). It was found that the corexpression genes of RHCG enriched in TFF, GABA,NRF2 pathways, drug metabolism cytochrome P450 and other enzymes, steroid hormone biosynthesis, starch and sucrosemetabolism, pentose and glucuronic acid interconversion,ascorbic acid and aldosterone metabolism, retinoids Biotransformation-related pathways and biological functions such as alcohol metabolism,glucuronidation and bio-oxidation were enriched.Accordingly, computational GSEA was performed (Table 2). The results were basically the same (Figure 6).
Prognostic and predictive value of RHCG in LUAD
Next, we analyzed the predictive power of RHCG expression on prognosis of clinical case variables in patients with LUAD (Table 3).Kaplan-Meier survival analysis suggested that high RHCG expression was associated with poor prognosis in LUAD (Figure 7A-Figure 7C).Nomograms and calibration curves also demonstrated that high RHCG expression was associated with poor prognosis in the LUAD clinicopathological subgroup (Figure 7D-Figure 7E). Meanwhile, the ROC curve also confirmed that the AUC of RHCG in TCGA-LUAD was 0.656 (Figure 8A). Time-dependent ROC curves showed that RHCG had good performance in predicting survival prognosis at LUAD1, 3 and 5 years (Figure 8B-Figure 8D).

Figure 4 Construction of a PPI network of DEGs related to oxidative stress and autophagy. (A) A protein-protein interaction network (PPI)was constructed from the STRING database to reflect intermolecular interactions, and the maximum confidence interaction score was set to 0.4,which was analyzed and visualized by Cytoscape’s Network Analyzer tool.(B) The closely related genes of the PPI network modules were screened and visualized using the MCODE plugin. (C) Top10 closely related genes were screened using CytoHubba plugin. (D) The correlation heat map between 10 co-expression Hub genes.PPI, protein-protein interaction network.
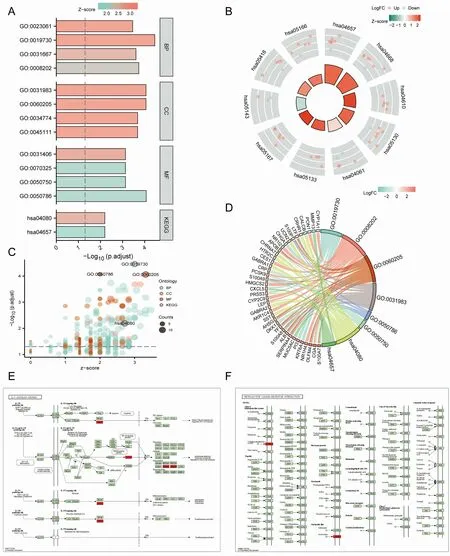
Figure 5 Enrichment analysis of Hub genes. (A-D) GO and KEGG enrichment analysis of RHCG’s Hub differentially expressed genes with histograms, bubble plots, chord plots and enrichment plots. (E, F) Pathway map for KEGG enrichment analysis of Hub differentially expressed genes. GO, Gene Ontology;KEGG, Kyoto Encyclopedia of Genes and Genomes; RHCG, Rh family, C glycoprotein.
Cox regression analyses
Cox regression analysis of T, N, M stage, outcome, pathological stage and RHCG in patients with LUAD suggested that the expression of RHCG (Table 4)and the status of primary therapy outcome were independent factors affecting the prognosis of patients with LUAD(Figure 8E-Figure 8F).

Table 1 GO &KEGG enrichment analysis of hub co-expressed differentially genes of RHCG
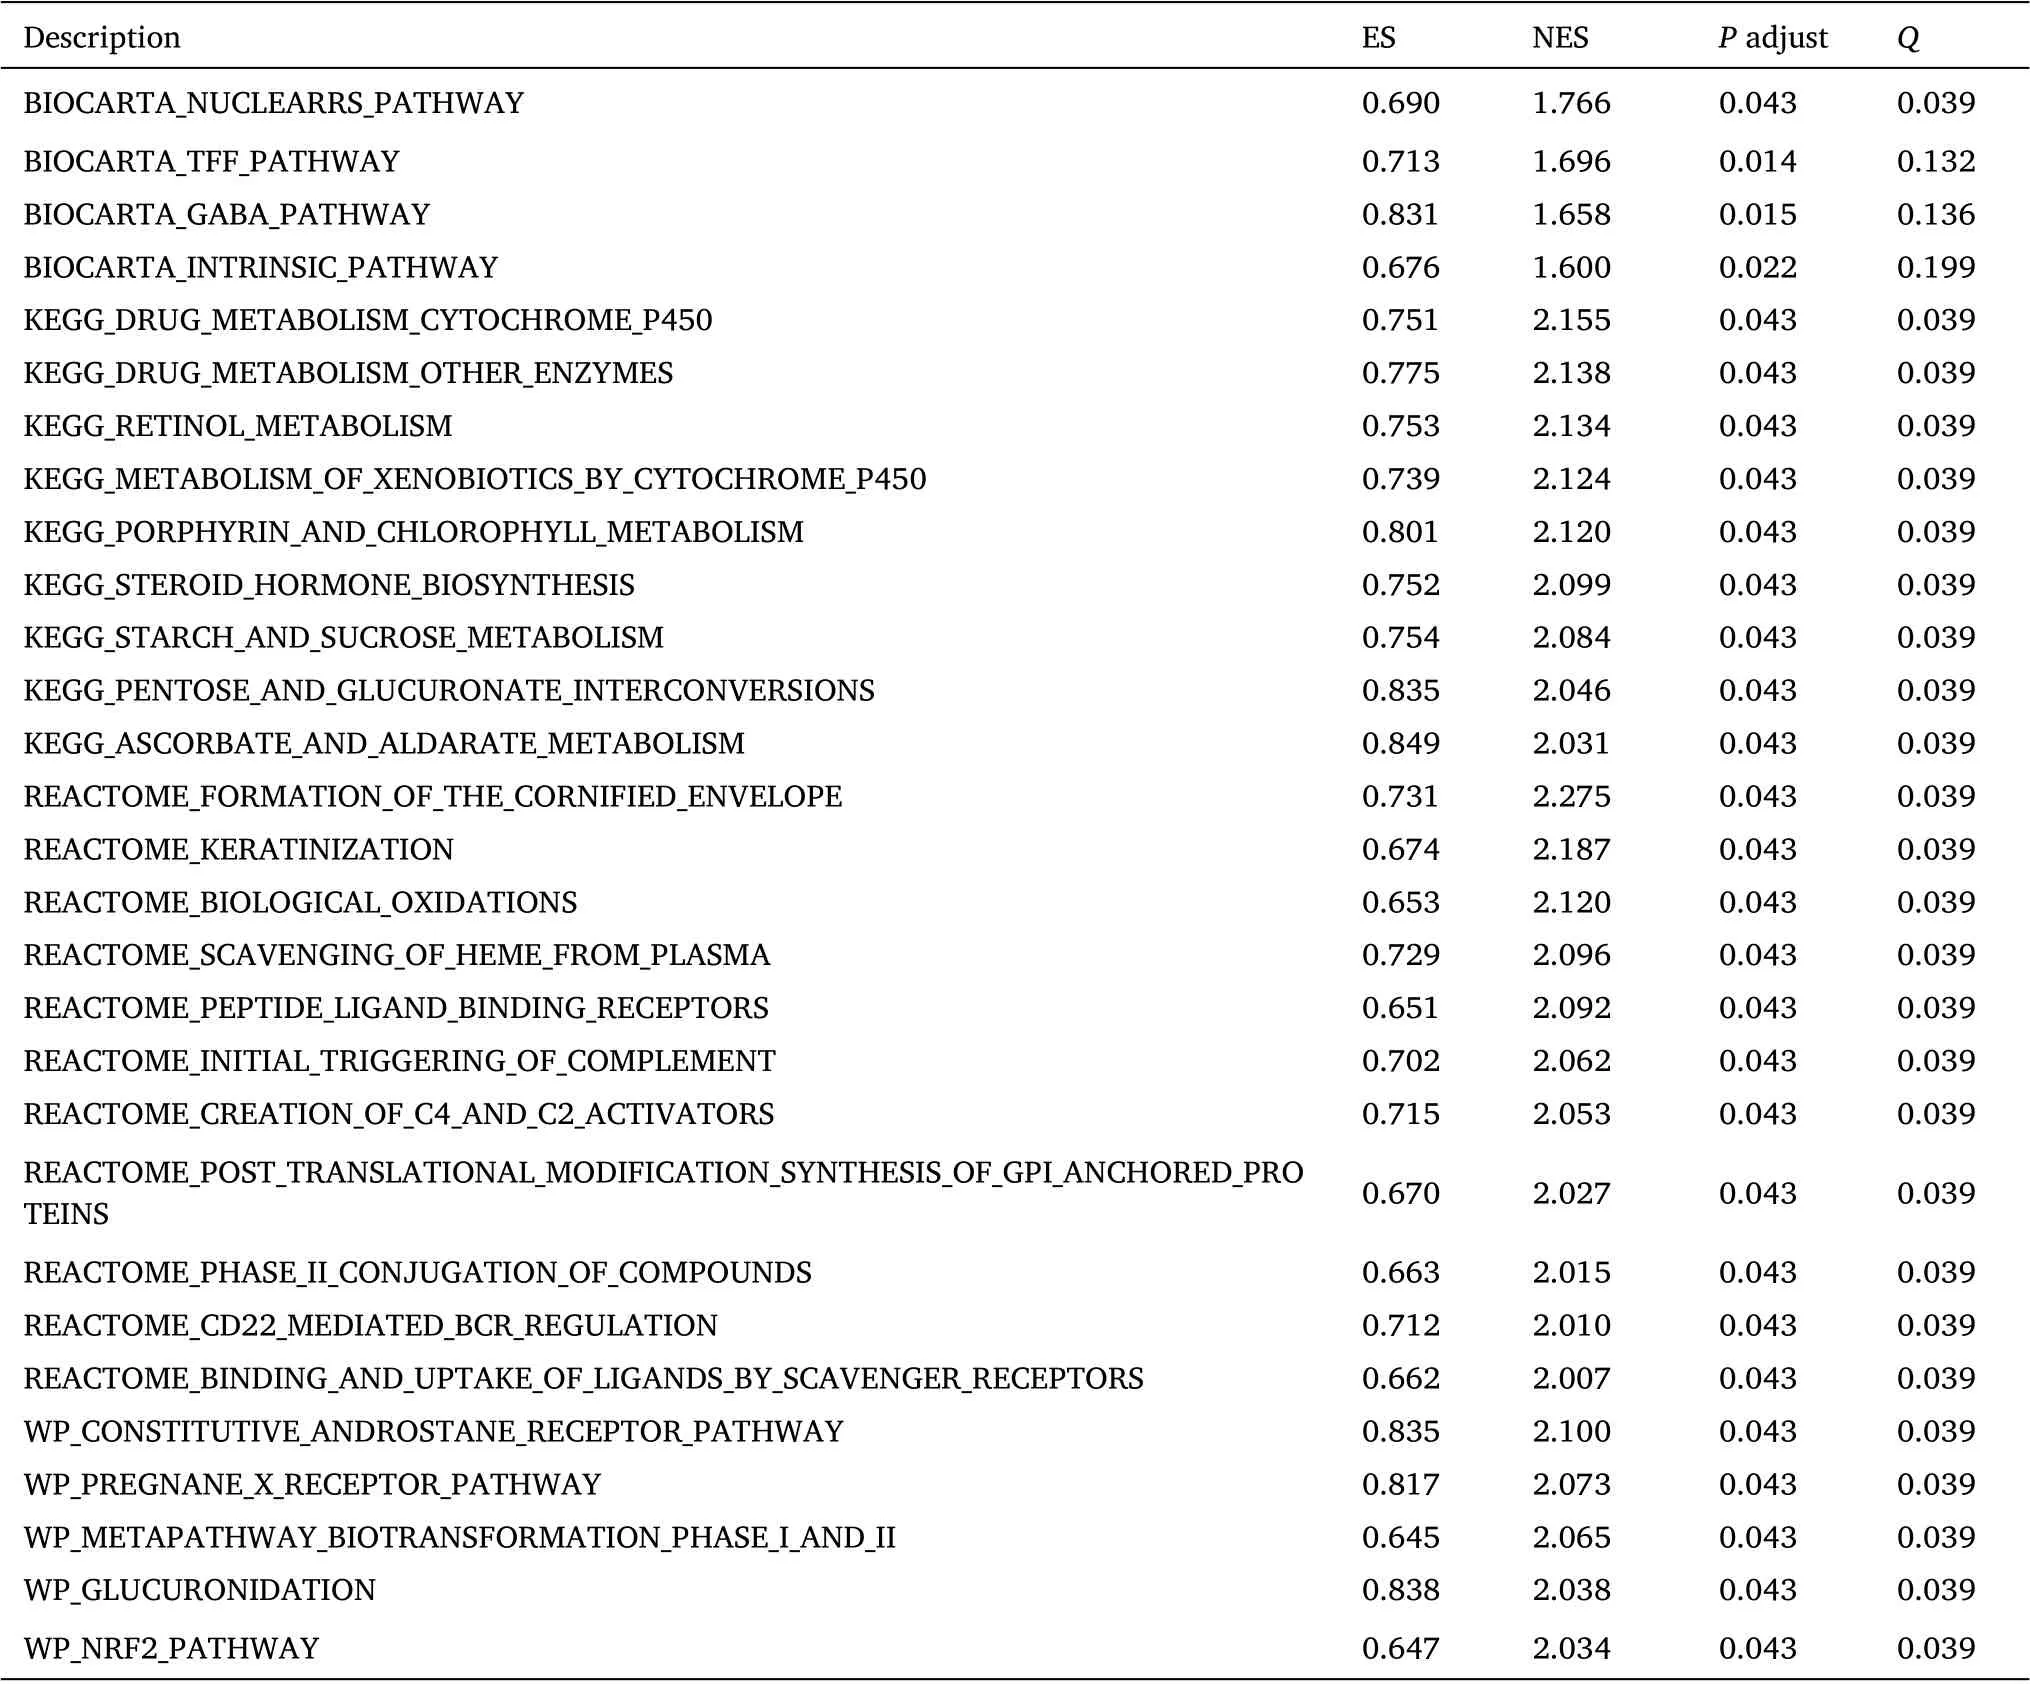
Table 2 GSEA enrichment analysis of RHCG

Figure 6 Gene set enrichment analysis of RHCG. Enriching pathways in WP (A), REACTOME (B), KEGG (C), and BIOCARTA (D), respectively.(E-H) Mountain plot showing enrichment scores for enriched pathways. KEGG, Kyoto Encyclopedia of Genes and Genomes; RHCG, Rh family, C glycoprotein.

Table 3 Baseline comparison of clinical characteristics of patients between high and low RHCG expression groups in the TCGA-LUAD
Analysis of differential expression of RHCG in clinical subgroups of LUAD
We targeted different subgroup analyses related to LUAD prognosis.We targeted various subgroup analyses associated with LUAD prognosis.RHCG was found to be significantly highly expressed in the poor prognostic subgroups of tumor T, N, M stage, pathologic stage and primary therapy outcome (Figure 9A-Figure 9D). At the same time, we compared the expression differences of RHCG in different survival status subgroups of overall Survival (OS), disease specific survival (DSS), progress free interval (PFI), and the results were consistent (Figure 9E-Figure 9G). All the above results suggest that the high expression of RHCG predicts the poor prognosis of LUAD(Figure 10).
Immune cell infiltration analysis
CIBERSORT analysis of the correlation between NECAP2 and 22 types of immune cell infiltration, lollipop plot and distribution difference boxplot suggest that NK cells, Neutrophils, NK CD56bright cells, Tem and Tgd between the high and low expression groups of RHCG. There were significant differences in infiltration (Figure 11A-Figure 11B).Further expression correlation analysis (Table 5) indicated that RHCG was significantly positively correlated with the distribution of Tgd,Neutrophils and Th2 cells, with correlation coefficients of 0.299,0.178 and 0.218, respectively (Figure 11C-Figure 11E). At the same time, RHCG was significantly negatively correlated with the distribution of TFH, Tem, Eosinophils, Th17 cells and Tcm with correlation coefficients of -0.241, -0.210, -0.149, -0.138, -0.148,respectively (Figure 11F-Figure 11K). The results suggest that RHCG is significantly associated with various immune cell infiltrations in the LUAD tumor microenvironment in the CIBERSORT analysis.
Discussion
RHCG functions as an electrically neutral and bidirectional ammonium transporter. RHCG belonged to the rhesus monkey family and was first identified as the Rh blood group antigen in human erythroid cells. Physiological function of RHCG is not well explained[28]. Decreased RHCG has been reported in tongue squamous cell carcinoma and esophageal squamous cell carcinoma [13]. However,the effect of changes in RHCG expression on tumor growth, including lung adenocarcinoma,has not been investigated[29].Autophagy may also interfere with immunotherapy, as several studies have demonstrated a link between autophagy and immune checkpoint activity and/or expression, including CTLA-4, IDO, and PD1/PD-L1[30-32]. Autophagy promoting the immunogenic cell death of tumor cells and favoring the activation and proliferation of immune cells[33]. Autophagy may also promotes tumorigenesis to cancer cells [8,32]. In this study, we analyzed the differential expression of RHCG in LUAD samples. Functional analysis of the highly expressed genes of RHCG was performed to reveal the role of RHCG in the progression of LUAD. The alteration of immune cell infiltration in the tumor microenvironment of LUAD by RHCG may be one of the mechanisms by which it exhibits an anti-tumor effect and may become a potential immunotherapy target for LUAD, which is beneficial for improving immunotherapy. The role of RHCG in tumors, especially its relationship with immune infiltration, has not been reported yet.Therefore, this study aimed to comprehensively understand the expression level of RHCG in LUAD and its relationship with malignant characteristics and the prognosis of LUAD patients. In addition, we also investigated the correlation of RHCG with different levels of immune cell infiltration to further evaluate the predictive performance of RHCG for high infiltration levels in LUAD. Therefore,RHCG may be a potential prognostic biomarker and therapeutic target for human LUAD. Combined with the analysis of the correlation between RHCG and RNA modification genes and their methylation sites,it is considered that the molecular mechanism of RHCG affecting LUAD may be related to promoter hypermethylation. In conclusion,our findings support that RHCG is a novel LUAD oncogene that affects the tumor immune microenvironment of LUAD, can predict the prognosis of LUAD and plays an essential role in the occurrence and development of LUAD.
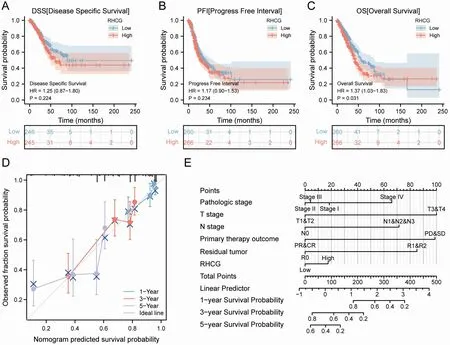
Figure 7 Survival prognostic analysis of RHCG. (A-C) Survival curve of RHCG for DSS, PFI, and OS in patients with LUAD. (D) Calibration curves for evaluating nomogram-predicted 1-,3-,and 5-year survival to show the difference between nomogram prediction and actual survival.(E)Nomogram for predicting 1-, 3-, 5-year survival in LUAD patients. RHCG, Rh family, C glycoprotein; OS, overall survival; DSS, disease specific survival; PFI, progress free interval; LUAD, lung adenocarcinoma.
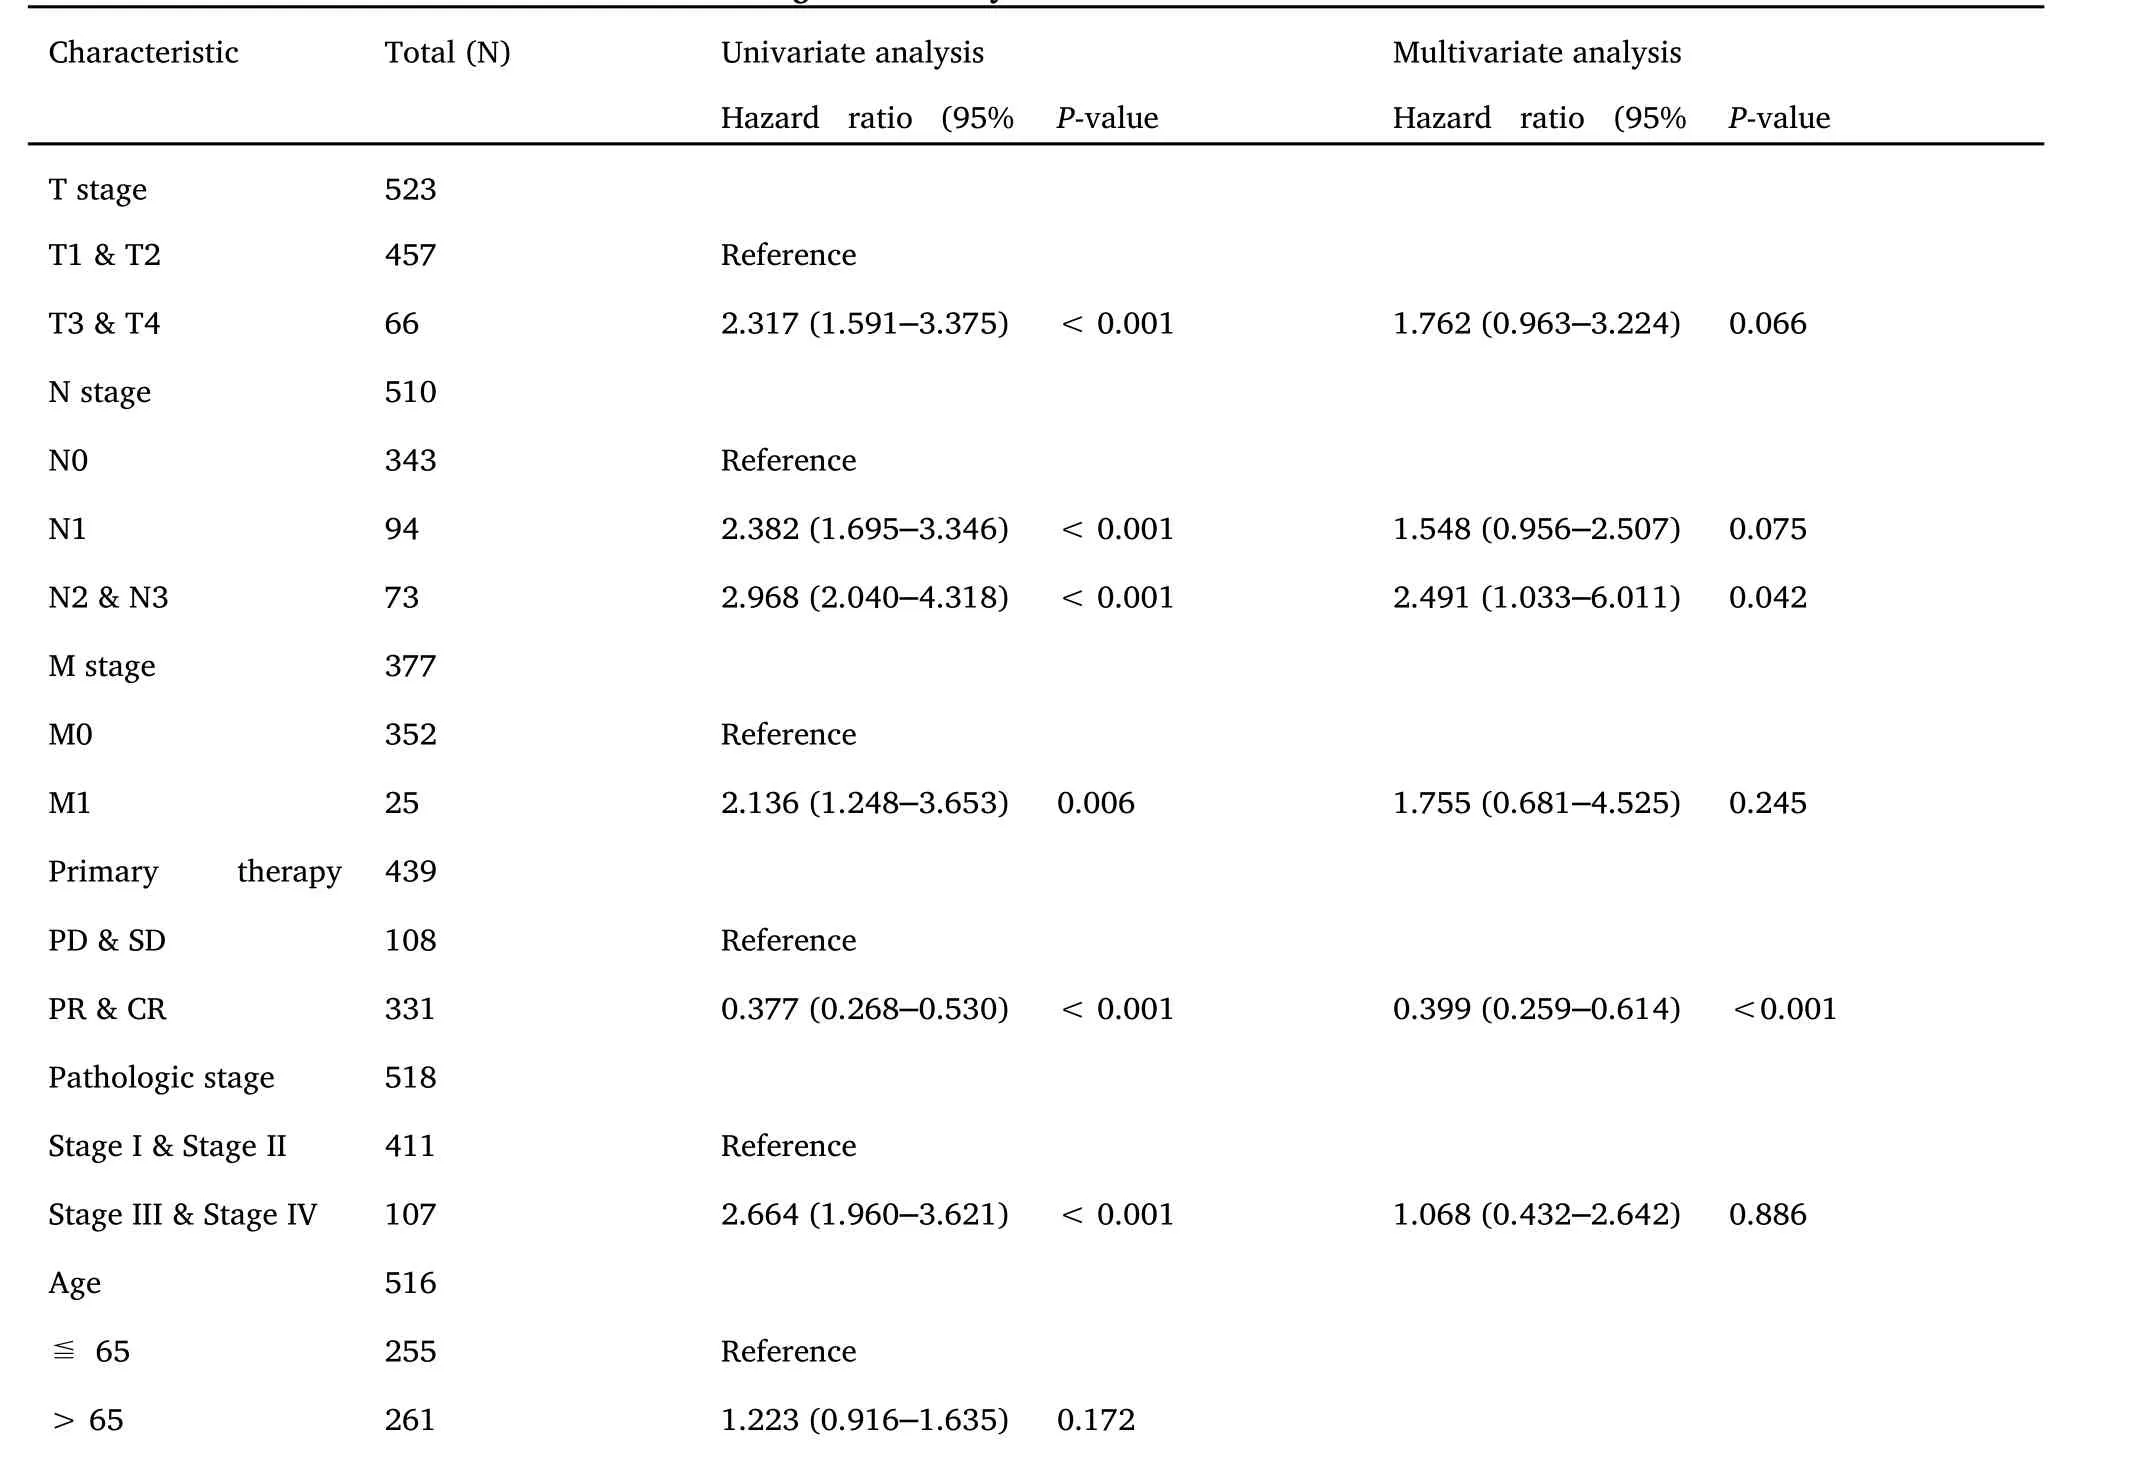
Table 4 Univariate and multivariate Cox regression analyses of clinical characteristics associated with overall survival
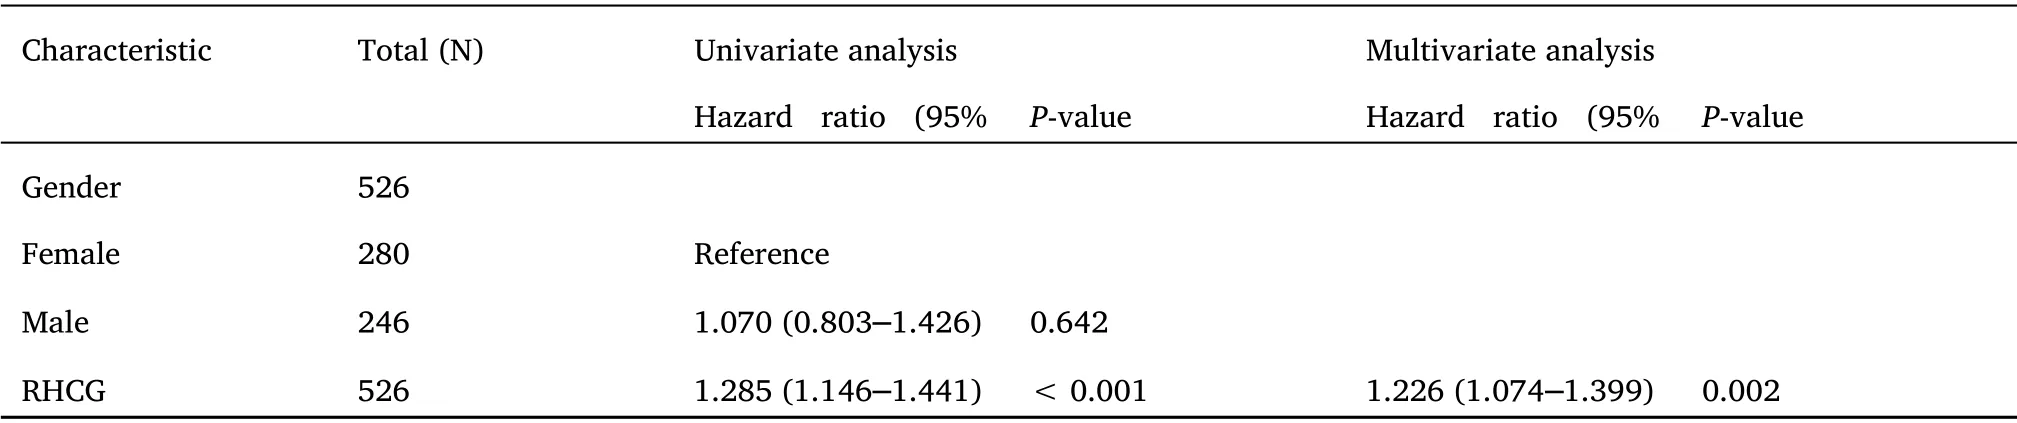
Table 4 Univariate and multivariate Cox regression analyses of clinical characteristics associated with overall survival (continued)

Figure 8 Predictive power of RHCG expression for prognosis of clinical case variables in LUAD patients. (A) The AUC of RHCG in TCGA-LUAD was 0.656.(B-D) Time-dependent ROC curve shows that RHCG has good performance in predicting the survival prognosis of LUAD1,3,and 5 years.(E,F)Univariate and multivariate Cox of T,N,M stage,outcome,Pathologic stage,and RHCG in LUAD patients regression analysis.RHCG, Rh family, C glycoprotein; LUAD, lung adenocarcinoma.
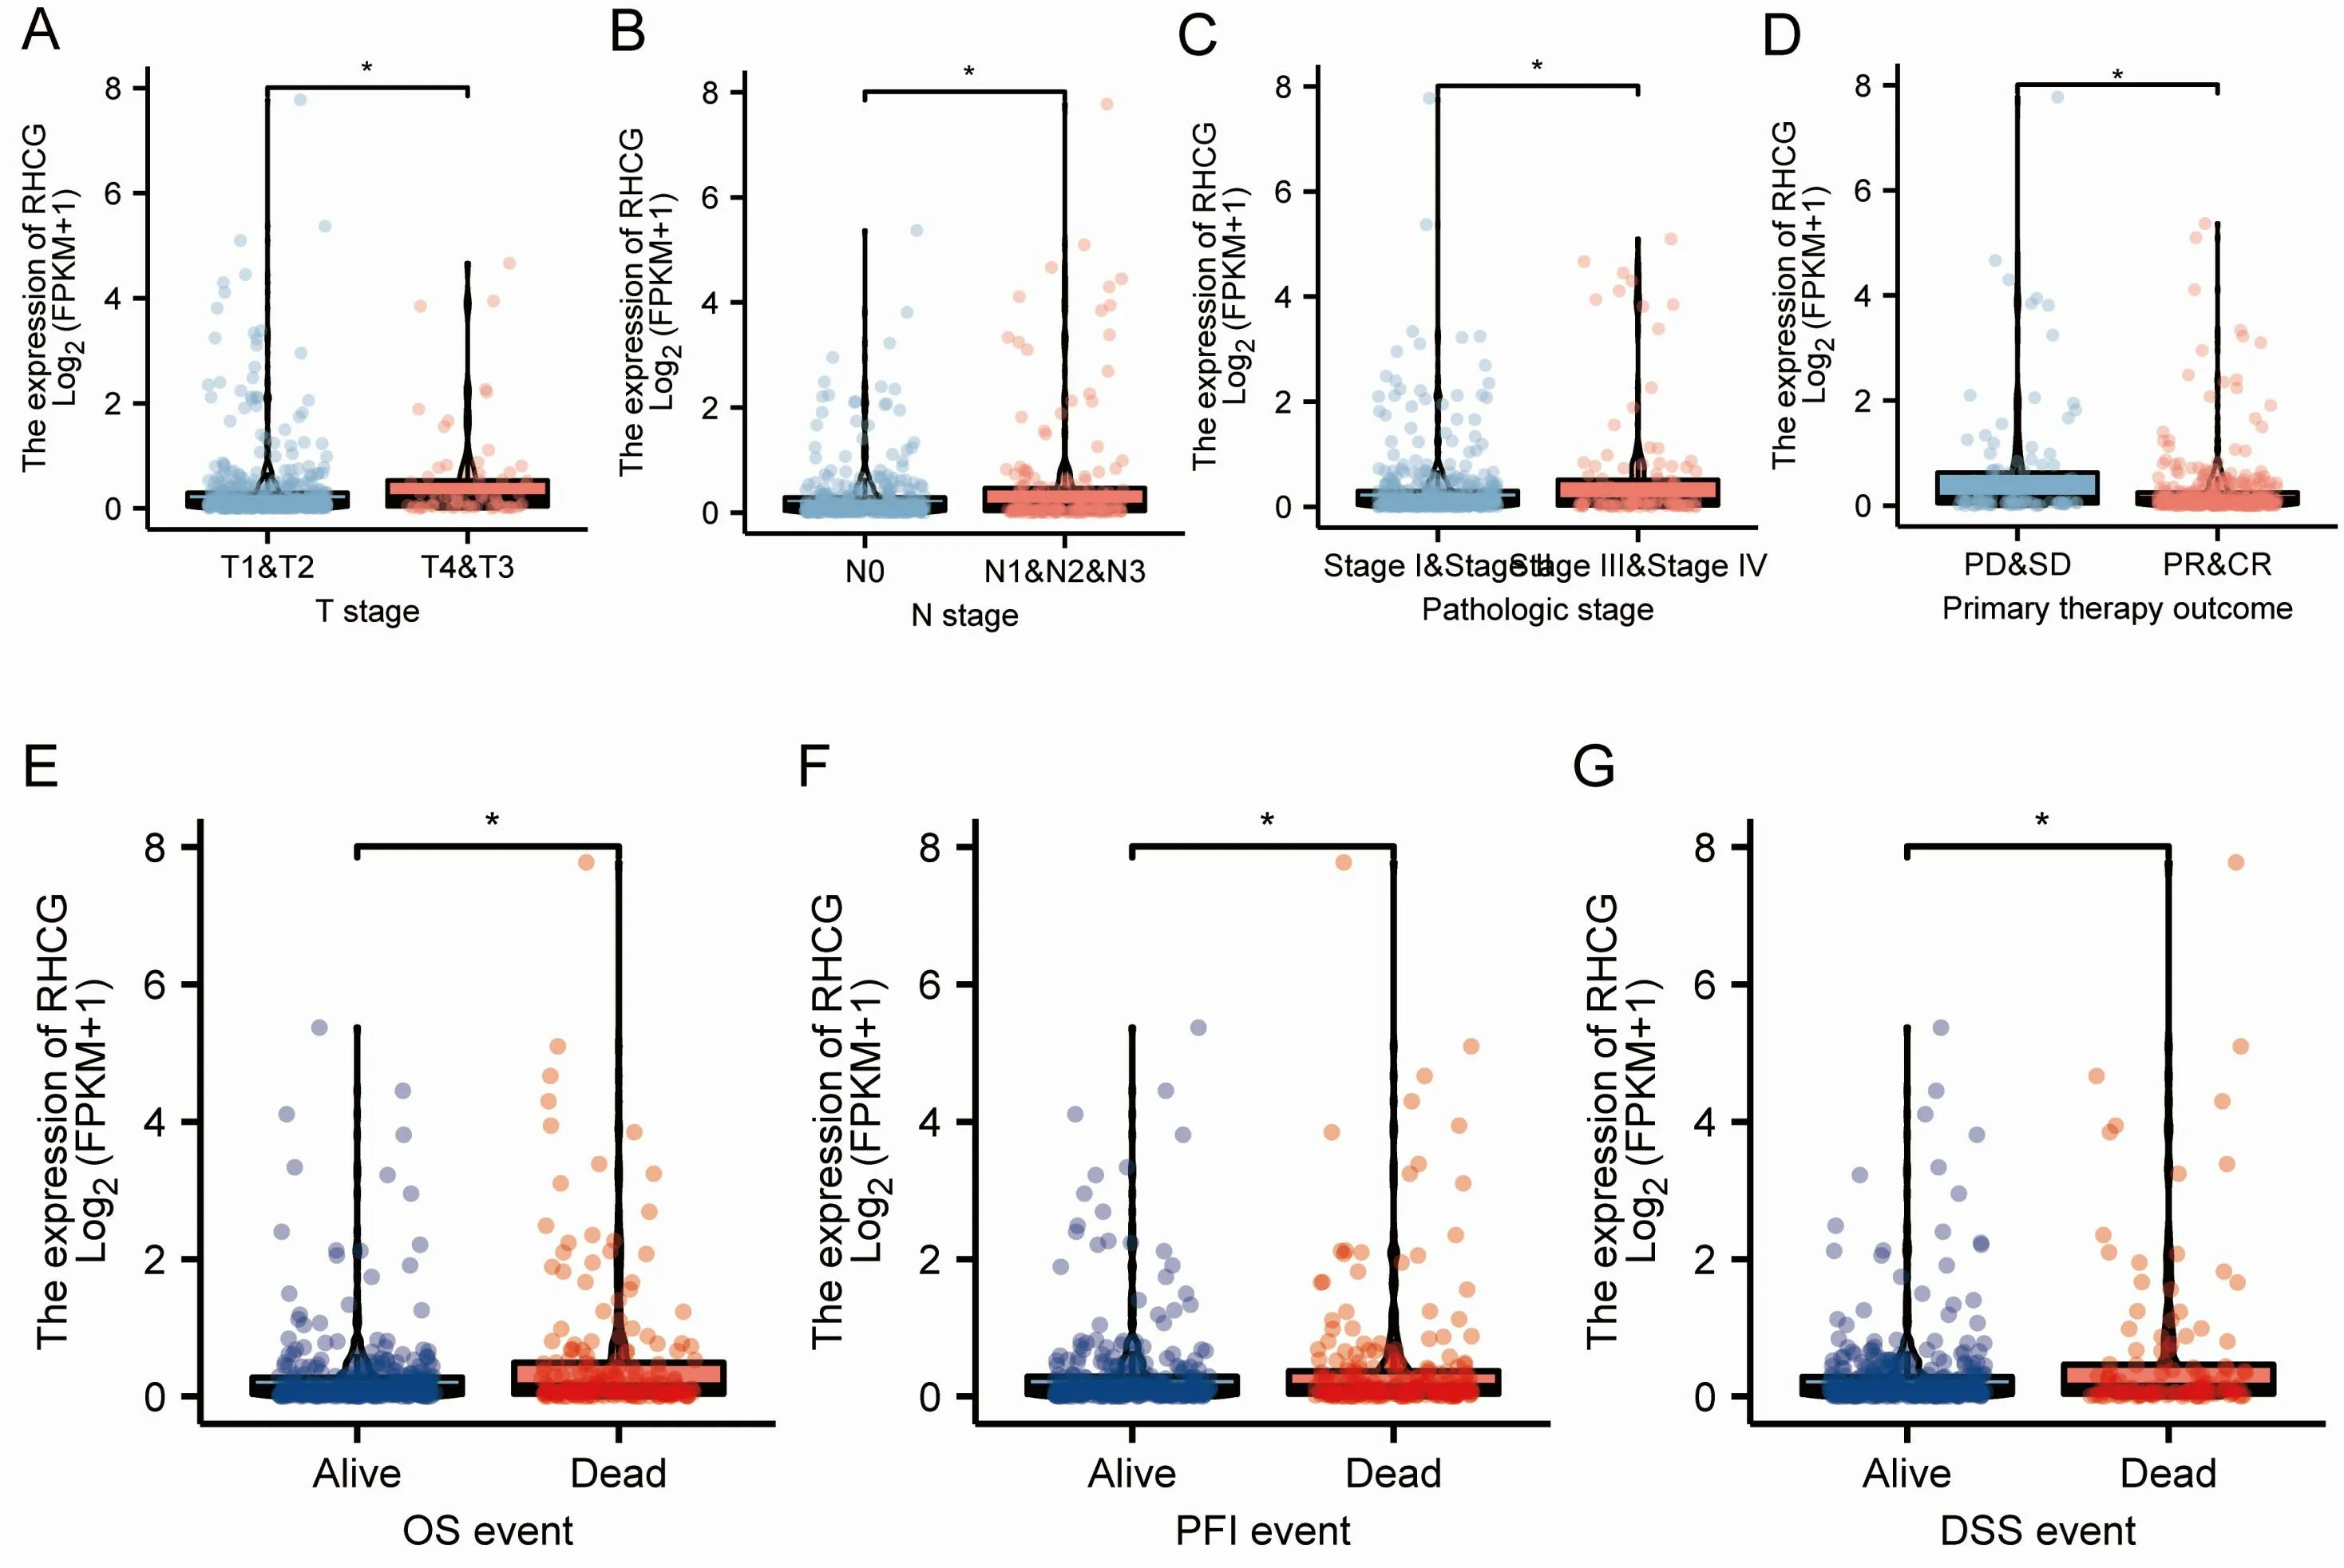
Figure 9 Association of RHCG expression with clinicopathological features in the TCGA-LUAD dataset.(A-D)Expression differences between subgroups of pathological parameters (P <0.001). (E-G) The expression difference of RHCG in different OS, PFI and DSS survival status of LUAD patients. RHCG, Rh family, C glycoprotein; OS, overall survival; DSS, disease specific survival; PFI, progress free interval; LUAD, lung adenocarcinoma.

Figure 10 K-M curves of RHCG affect the overall survival of LUAD patients in each pathological subgroup in TCGA-LUAD. (A-F) RHCG showed overall survival prognostic significance in the T,M,N subgroup.(G-H) RHCG showed a significant overall survival prognostic significance in PD&SD and PR&CR subgroup.(I-J)RHCG showed a significant overall survival prognostic significance in the tumor stage subgroup.RHCG,Rh family, C glycoprotein; LUAD, lung adenocarcinoma.
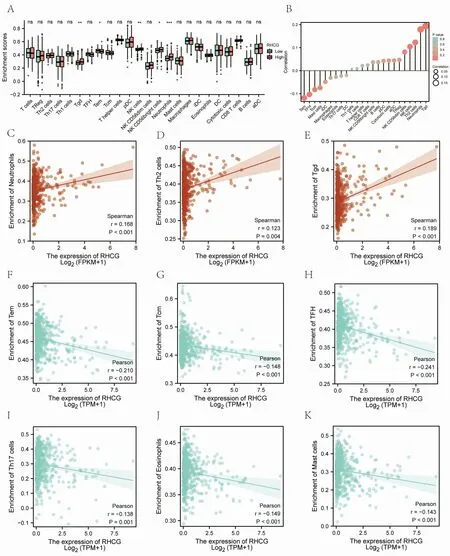
Figure 11 Analysis of immune cell infiltration. (A, B) CIBERSORT analysis of RHCG and 22 kinds of immune cell infiltration correlation distribution difference box plot and lollipop plot. (C-K) CIBERSORT analysis of RHCG and 22 types of immune cell infiltration significantly correlated with the scatter plot.
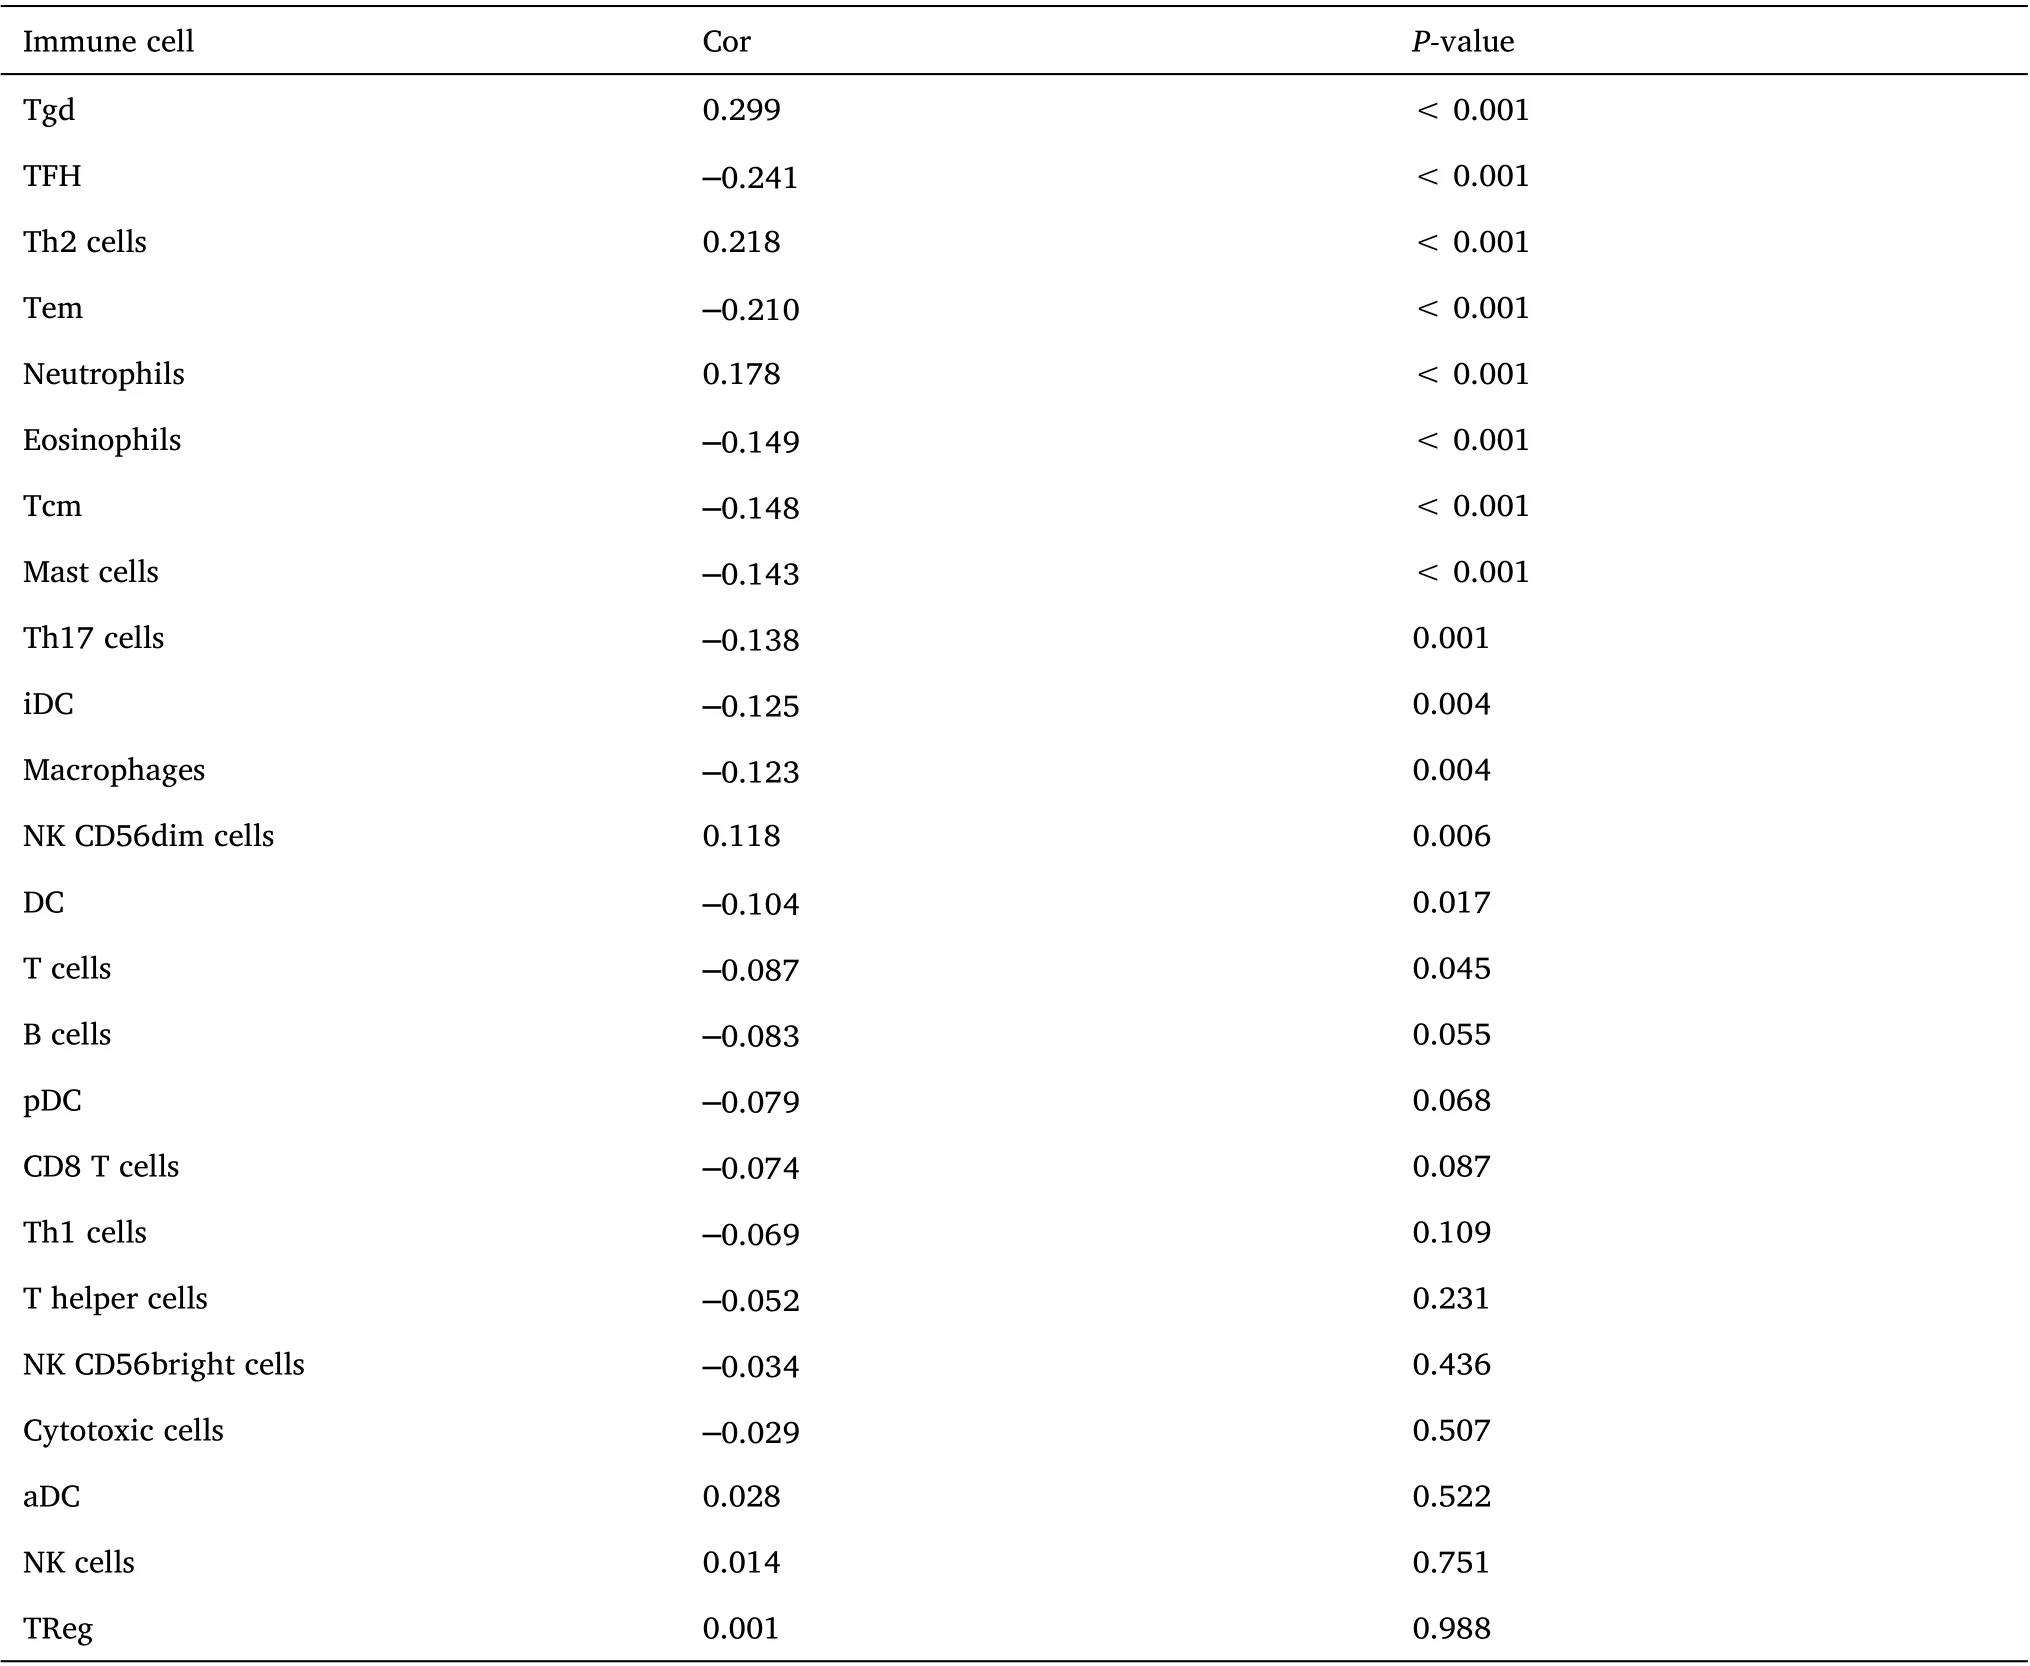
Table 5 Correlation bet ween RHCG and i mmune cells i n the LUAD microenvironment
 Precision Medicine Research2022年3期
- Precision Medicine Research的其它文章
- The cuproptosis-related gene signature predicts clinical diagnosis, prognosis, and immune microenvironment for glioblastoma multiforme
- Correlation of bisphenol A action on genes interfering with estrogen signaling pathways and the development of endometriosis
- Identification of overlapping differentially expressed genes in hepatocellular carcinoma,breast cancer,and depression by bioinformatics analysis