Analysis and Study on Characteristics and Detection Methods of Cotton Diseases and Insect Pests
Chao ZHU, Wanlin SUN, Chen HAN, Miao WANG
1. Department of Physics, Changji University, Changji 831100, China; 2. Engineering Branch of Xinjiang Agricultural Vocational Technical College, Changji 831100, China
Abstract [Objectives] The paper was to find the diseases and insect pests in the process of cotton growth quickly, effectively and timely. [Methods] The growth process of cotton was dynamically monitored by UAV aerial photography, and the aerial data map was converted into geotif image with longitude and latitude and then inputted into the detection system for preprocessing, mainly for image feature extraction and classification. Through deep learning of MATLAB software and BP neural network algorithm, the feature similarity of the images in the established characteristic database of cotton diseases and insect pests was compared. [Results] Through comparative analysis of characteristics of a large number of diseases and insect pests, it was found that deep learning method had high discrimination accuracy and good reliability. [Conclusions] The dynamic detection system using deep learning can well find cotton diseases and insect pests, and achieve early detection and early treatment, so as to effectively improve the yield and quality of cotton.
Key words Cotton diseases and insect pests; Characteristic map; UAV; MATLAB; Deep learning
1 Introduction
In order to ensure the yield and quality of cotton effectively, it is necessary to closely monitor the cotton growth process to prevent diseases and insect pests from affecting the normal growth of cotton. Since the symptoms caused by cotton diseases and insect pests in the initial stage are not obvious, it is difficult to find diseases and insect pests in time unless there are large areas of damage, but significant losses have been caused at this time. Therefore, a modern intelligent method is urgently needed for rapid, accurate and efficient automatic identification and detection of cotton diseases and insect pests, which can find timely and perform effective prevention and treatment when small pathological changes occur, so as to avoid the spread of diseases and insect pests in large area and to maintain high quality and high yield of cotton.
2 Establishment of characteristic database of cotton diseases and insect pests
The common diseases and insect pests in the growth process of cotton were studied, such asFusariumwilt, black spot,Verticilliumwilt, cotton bollworm, pink bollworm, cotton aphid,etc.Based on the existing data images, the database of characteristic images of cotton disease and insect pests had been gradually established. At the same time, the index table of image characteristics of cotton disease and insect pests was established, and appropriate similarity matching algorithm was selected to match the extracted features and calculate the similarity between images. Subsequently, the similarity was compared with the pictures taken by unmanned aerial vehicle (UAV) during field detection and the established characteristic database of cotton diseases and insect pests. If the features of cotton picture taken by UVA are basically the same as those of an image in the characteristic database of cotton diseases and insect pests, they are suffering from the same disease. If it has been successfully detected, control measures can be taken quickly; otherwise, it is normal.
3 Analysis of cotton diseases and insect pests
Due to the low-altitude aerial photography technology adopted by UAV, the shooting content mainly focused on the blades and heads of cotton. Generally, the symptoms of blades are more obvious, while the characteristics of stems and roots are not obvious. Therefore, the characteristics of cotton blades were mainly studied. The diseases mainly include black spot (ring rot), anthracnose, angular leaf spot,Fusariumwilt,Verticilliumwilt,etc.[1], and the insect pests mainly are cotton aphid, pink bollworm, cotton bollworm,etc.
Anthracnose: The disease occurs throughout the whole growth period. The disease mainly leads to vacant patch and broken stems, and the infected apex of seedlings is black brown and withered. It generally occurs in the middle of blades, and will cause rotten bolls during bolling period. The prevention and control measures include selection of excellent varieties and dressing seeds with 50% carbendazim WP.
Black spot: The disease mainly occurs at seedling stage and adult plant stage. Reddish brown spots are produced on blade surface, and then gradually spread into irregular elliptic spots. The cotton seeds can be mixed with 50% carbendazim or seedvax at the dose of 0.5% seed weight[2].
Fusariumwilt: The disease occurs throughout the whole growth period. A large amount of cotton seedlings are wilting, showing the typical symptoms of yellowing wilt, purplish-red wilt and bacterial wilt. The healthy area should be protected by preventive measures, and diseased plants must be eliminated as soon as possible.
Angular leaf spot: The disease occurs from leaf stage to adult plant stage. Dark green spots appear on abaxial surface of leaf blade, then rapidly expand to subcircular dark green spots. Water accumulation should be cleaned up in time after rainfall, and the amount of watering should be controlled to avoid too much watering, and the fallen cotton leaves must be cleaned up in time.
Cotton bollworm: The disease occurs from leaf stage to mature stage. The disease will spoil the boll, and reduce the yield and quality of cotton. 20% Fenvalerate EC can be sprayed to control the disease.
Cotton aphid: The disease occurs from leaf stage to mature stage. The plant will stop growing with bent leaves, or the whole plant will die off in severe cases; the injured cotton buds and bolls will fall off directly. 10% Imidacloprid WP 1 000 times dilution can be sprayed on tender heads and blade back of cotton.
4 Establishment of characteristic detection system of cotton diseases and insect pests
Dynamic image acquisition system was adopted for detection in the following procedures: obtaining cotton images by UAV equipped with highly sensitive image sensors, transmitting images to the control system, screening out suspicious areas, extracting features of diseases and insect pests, comparing with features of the characteristic database, outputting if similarity is greater than 50%, determining the specific location of diseases and insect pests, inspecting the field by cotton planting technicians, and formulating specific control measures. MATLAB software was used to detect and extract image features[3]. MATLAB software has great advantages in data analysis, matrix operation, image recognition, image detection, nonlinear dynamic modeling, multifunctional program operation,etc.Meantime, deep learning and neural network algorithms were used for fast calculation, so as to achieve the purpose of dynamic detection[4].
4.1 Image characteristics extraction of diseases and insect pests from diseased cottonTaking images ofVerticilliumwilt as an example, the images were selected from the newly built database of cotton diseases and insect pests traindate to extract image characteristics. In order to better observe the texture features, MATLAB software was used for effective extraction and comparative analysis of characteristics. TakingVerticilliumwilt as an example, the specific steps are as follows.
Step 1: To create a MATLAB file and program a data image, the image must be captured from the computer and stored for post-processing. The software is exited after finishing image processing so that the platform has the basic image characteristics.
Step 2: When processing the image, the format of the corresponding image is compiled, and codes are written for the images (data) input and processed by the software. Algorithm operation is required in image processing, in order to prevent errors or conduct positioning if the error is too large.
Step 3: The characteristics of the diseased parts of cotton diseases and insect pest are relatively obvious. Numerical analysis principle is applied in image processing, and numerical values are used to define the study area when editing codes.
Step 4: Because MATLAB processing of image data dynamically collected will bring some undetermined interference, some measures such as noise elimination are also needed in order to improve the accuracy of image recognition.
Step 5: According to the disease position and disease characteristics in images of cotton diseases and insect pests, the parts that can best reflect the diseases and insect pests are selected, and those typical parts are instructed with codes when writing codes (Fig.1).
Step 6: For better research and analysis, the image is transformed into gray-scale map without any color information, which can effectively improve the operating rate and comprehensive problem solving ability.
Step 7: The gray-scale map in Fig.1 is converted to a binary image, that is, the threshold is set as 0 or 255. The use of binary image in image processing is conducive to further image processing. The set nature of images is only related to the position of points with the pixel value of 0 or 255, and the multi-level value of pixel is no longer involved, which makes the processing simple and the compression amount small, highlights the key contour of the research area, and further helps the extraction of features[5]. As shown in Fig.2, the disease characteristics ofVerticilliumwilt are extracted.

Fig.1 Grey-scale picture of cotton Verticillium wilt
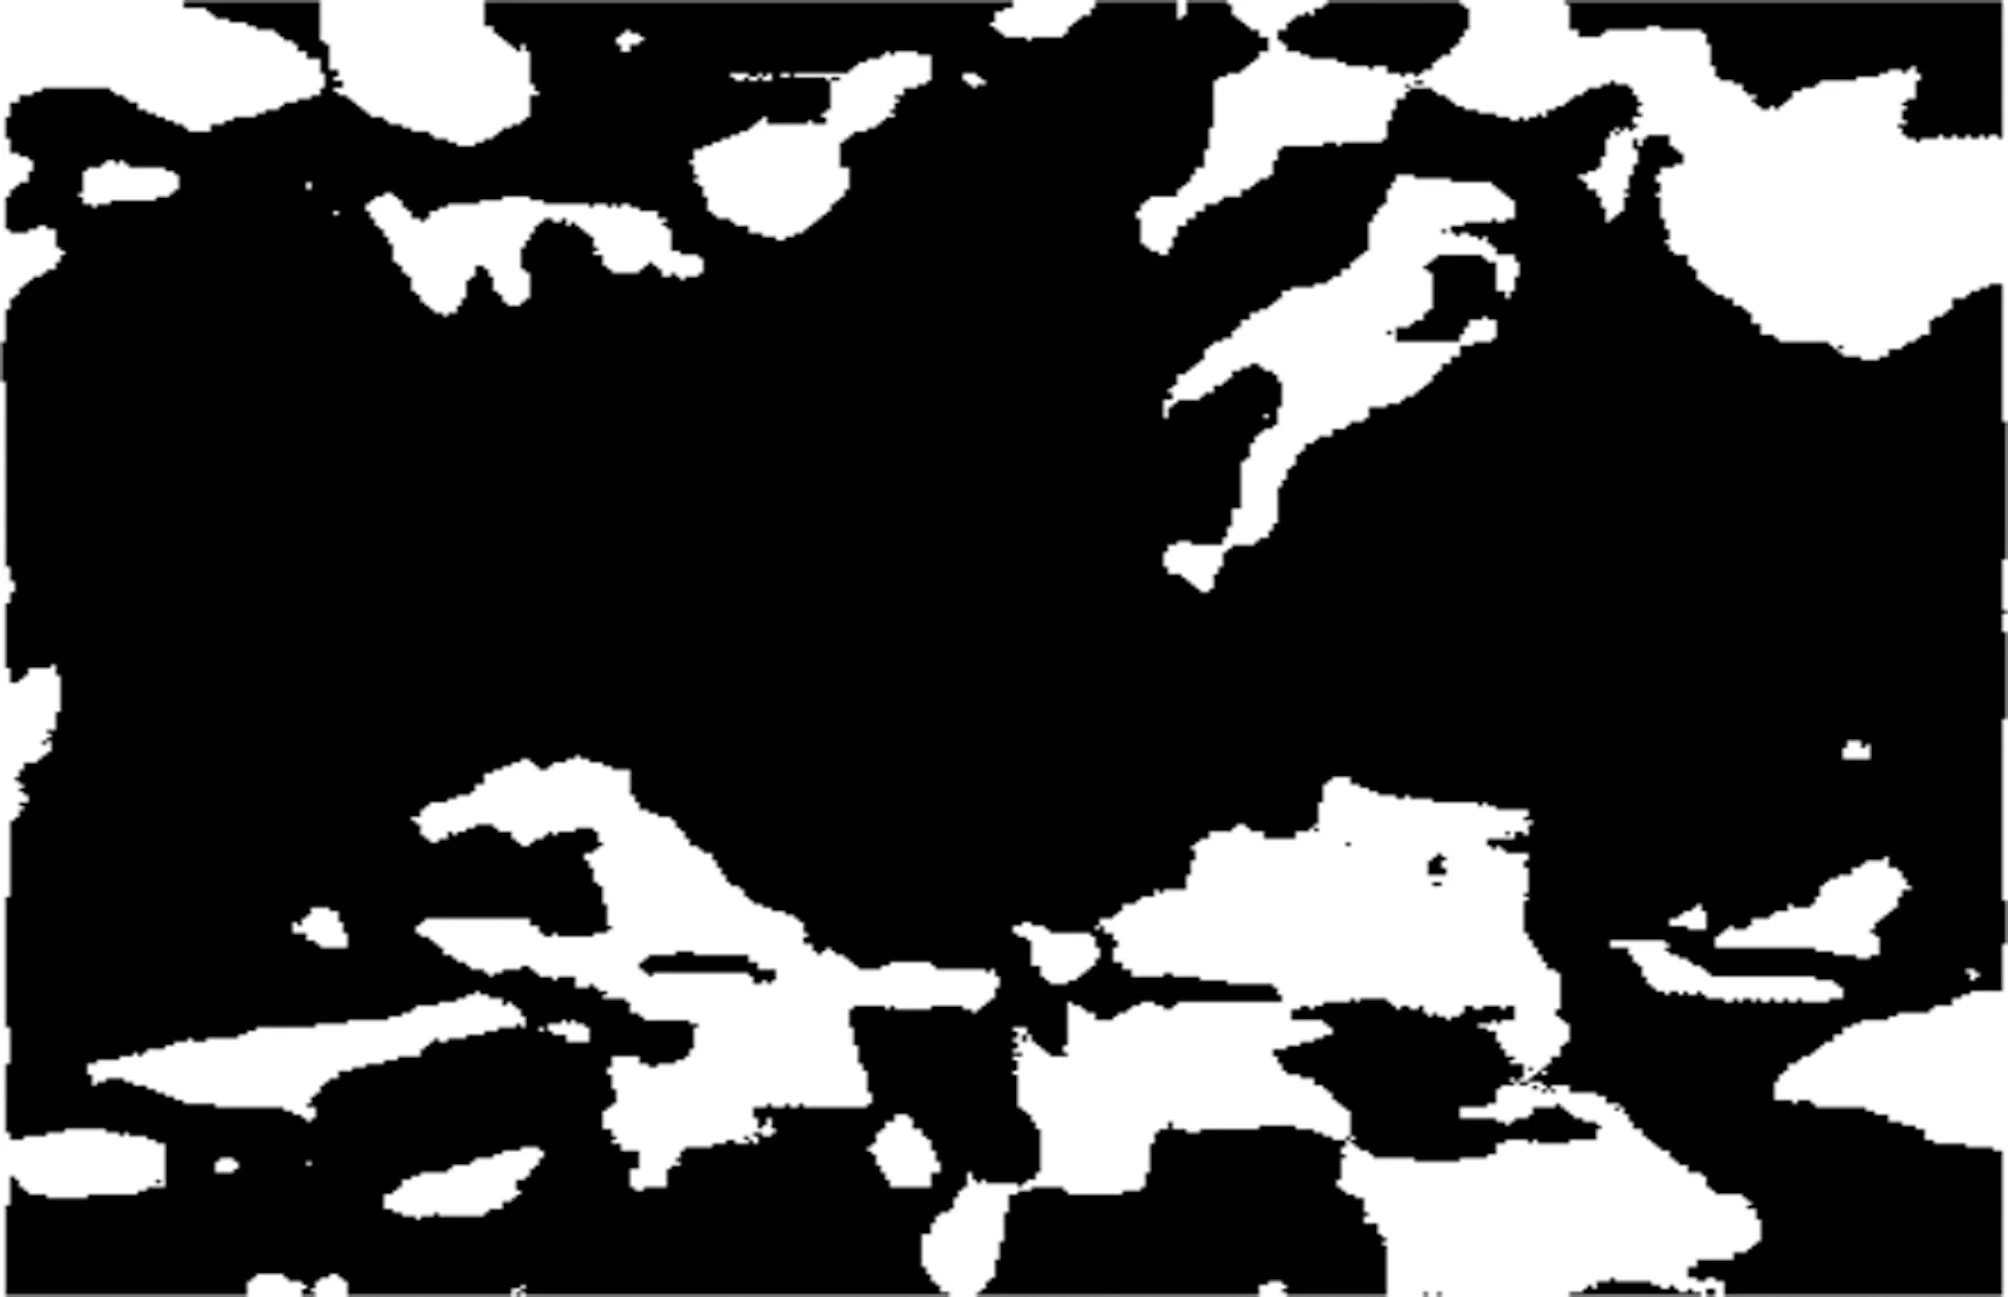
Fig.2 Characteristics of Verticillium wilt in cotton
4.2 Image characteristics extraction of normal cotton blade
The normal cotton blades were selected from the newly built image database of cotton diseases and insect pests for feature extraction. The naming statement imread was used to read the data of normal cotton blades in the computer. The parts with obvious characteristics can be obtained by rotating the normal blades, and then the characteristic regions were extracted and defined. The region selected in this picture was [60 38 100 120], and the image of the study region was sheared (Fig.3).
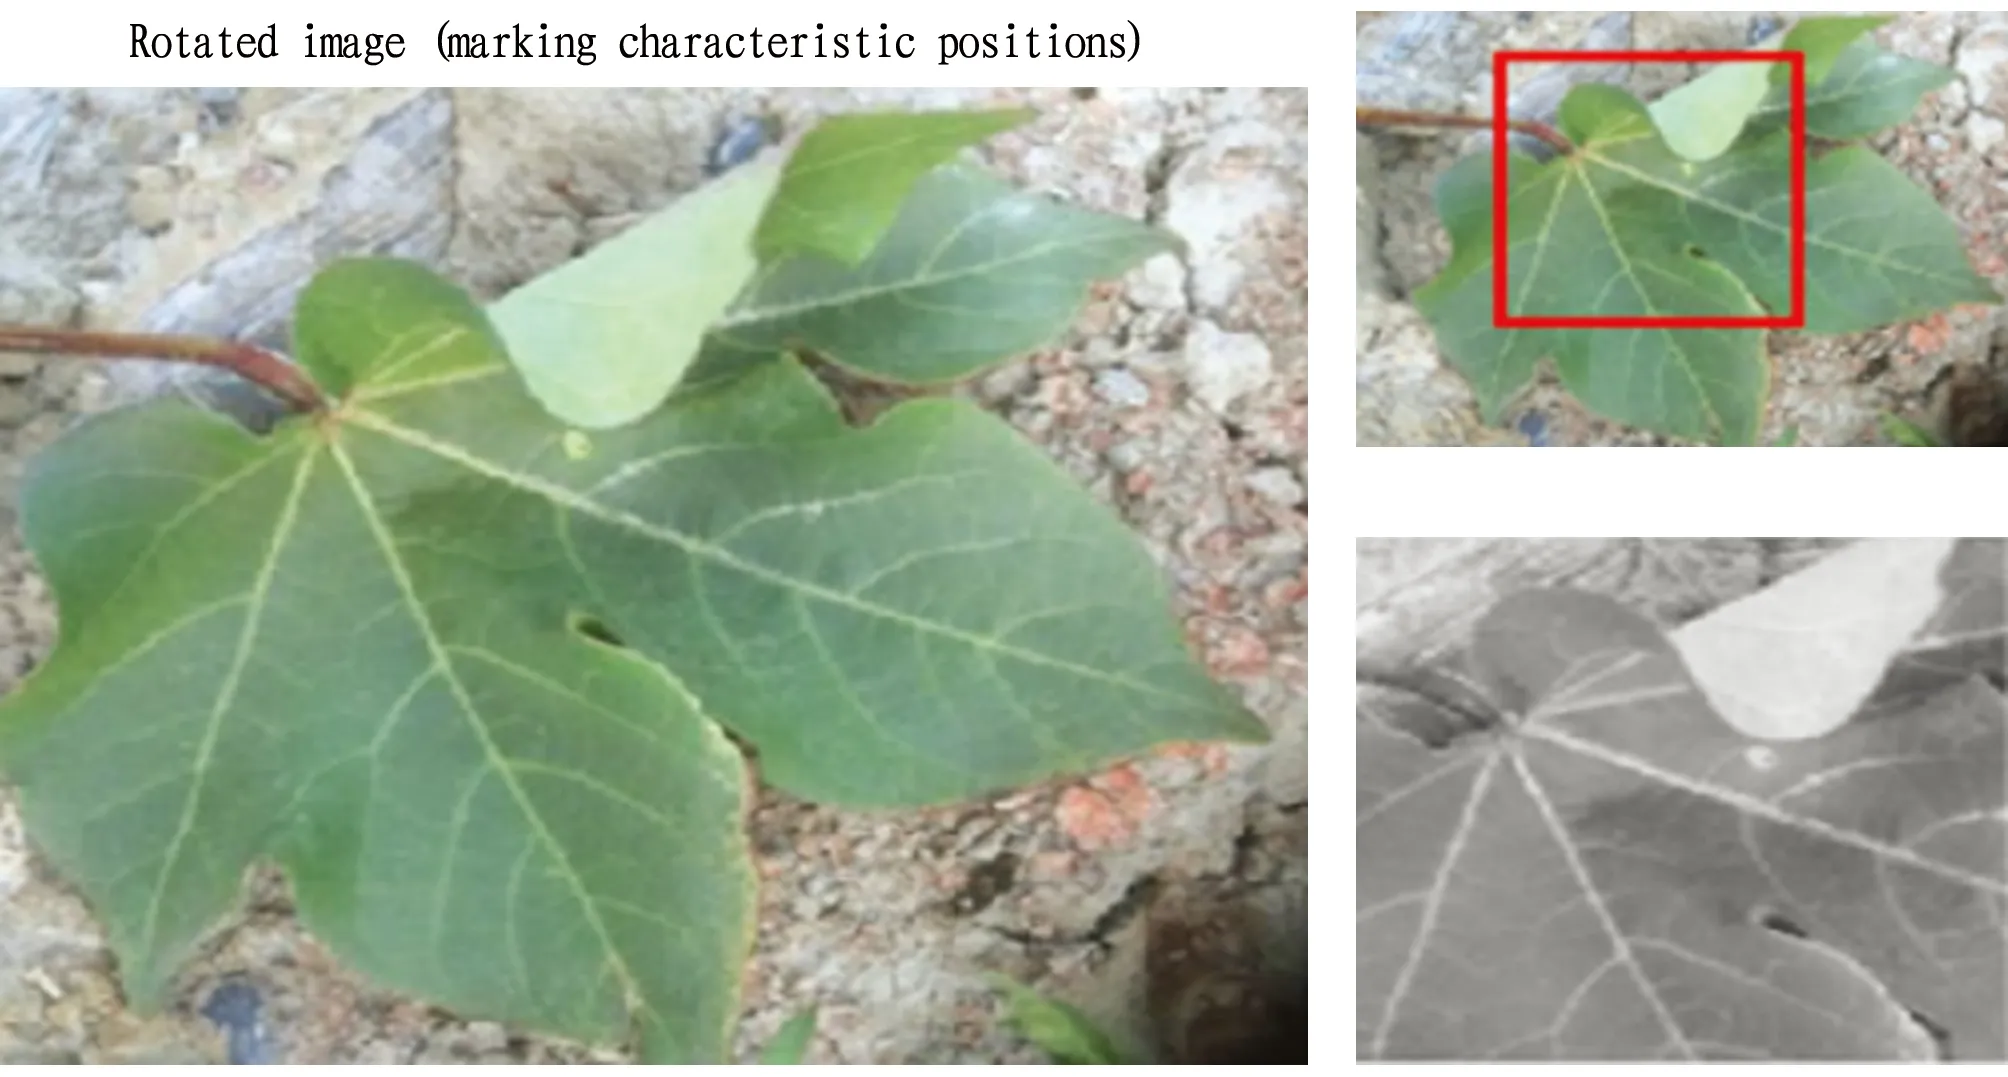
Fig.3 Signs of image characteristics
Through the program, the image was grayed to extract characteristic points, and the threshold part was marked in the figure. The transformation of binary image can be completed by assigning 0 to the part less than the threshold and 255 to the part greater than the threshold (Fig.4A)[6]. The binary image was marked for image shearing, and image feature extraction of normal blades was completed (Fig.4B).

Fig.4 Gray processing of image features (A) and binary image (B)
Similarly, the image chararcteristics of normal cotton blades and cotton blades infected by diseases and insect pests were extracted. In the process of extraction, the research on cotton diseases mainly tookVerticilliumwilt as an example for extraction, and the extraction of other image characteristics was the same as that ofVerticilliumwilt. Just by modifying the image read by imread, the more accurate image characteristics of each diseased part can be obtained.
Through the above comparative analysis of cotton normal blades and diseased blades, it could be obviously found that the characteristics of the two different states were obviously different. The edge of cotton blades infected byVerticilliumwilt withered badly, and the texture features were clear. The texture of normal cotton blades observed under the microscope was very clear and flat.
4.3 Setting of dynamic image acquisition mode of UAVUAV aerial photography was adopted to collect real-time data of cotton growth, with 4K high-definition camera. The flying height was 3 m, with the effective acquisition range of 1 m on each side, and the flying speed was 2 m/s. Equipped with Beidou navigation system, the UAV with aerial photography conducted initial positioning every time when collecting data. After the running track and paths were set in the program, the image can be collected dynamically. After the data image was collected, it would be automatically stored in the built-in memory card (128 G). At the same time, real-time data were directly transmitted to the mobile phone for the operators or technicians to view through wireless transmission mode. In the process of shooting, the integrity of photos of each area should be ensured, but the edges can not be repeatedly taken too many times. The positioning technology and image processing software pix4dmapper were used to detect the characteristics of diseases and insect pests in UAV aerial photography data. Images needed to be captured during image processing, and the captured image data can be determined according to the shooting height and speed. In the current speed mode, one image was captured in 0.1 s. Longitude and latitude can be added to each screenshot via Beidou navigation system, so that each data image to be tested would become a geotif image with longitude and latitude[6].
4.4 Detection principleData and images were collected by aerial photography technology. After simple processing, image recognition technology was used to obtain data of cotton diseases and insect pests. The geotif images with latitude and longitude were input into the detection system for preprocessing, and then image characteristics were extracted. The images were classified according to the extracted characteristics, and then compared and matched with the images in the established database of cotton diseases and insect pests, and finally the results were outputted. As shown in Fig.5, the cotton field is first photographed by UAV at low speed and low altitude to collect the information of cotton blades. The cotton field is often damaged in patches. An area suspected of being infected can be detected in the whole picture, and this area can be segmented to extract the characteristics of the image and determine whether the area is infected. If no suspicious characteristics are detected, this area is healthy and labeled with healthy signs. If suspicious characteristics are detected, it is necessary to judge the species of the disease according to the characteristics, and the algorithm of image recognition is used.
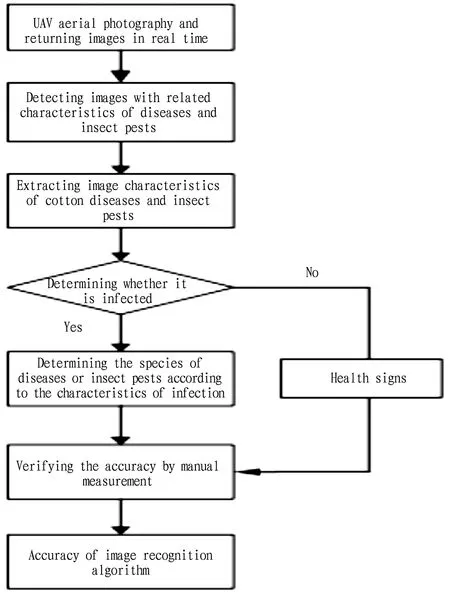
Fig.5 Automatic identification technology roadmap of characteristic maps of cotton diseases and insect pests collected by UAV
5 Image preprocessing
Image preprocessing mainly completes characteristic extraction of cotton blades and acquisition of accurate data characteristics. Noise interference is very large in complex environment, and the image can be segmented by color features to remove background interference. The efficiency will be much higher by using MATLAB software to preprocess the image and using the algorithm to control the image recognition.
5.1 Characteristic map extraction—Preprocessing of blade imagePreprocessing was conducted withVerticilliumwilt (Fig.1) as an example. An m file was established on MATLAB software, and the preprocessing program was input. The image was first read and characteristic points were sheared, and then conventional preprocessing was carried out.
5.1.1Gray processing of color image. In order to avoid large calculation errors, only the brightness information of blade image was obtained after gray-scale processing of blade color image. A 256-level gray image was used, whose attribute is a matrix composed of individual data. If it is a double-precision matrix, the threshold is [0, 1]; if it is unite8 type, the threshold is [0, 255]. When the brightness value is 0, it means black; when the brightness value is 1 (or 255 for unite8 type), it means white.
5.1.2Image binaryzation. Through threshold segmentation, the threshold was set. The gray values below the threshold were set as zero, and those above the threshold were set as the maximum, so as to realize image binarization. The blade and background can be effectively divided into the two poles of 0 and 255, and the contour information of blades was retained to highlight the blade contour[7].
5.1.3Morphological processing. A variety of operations in morphological processing were combined by corrosion and expansion, including opening operation and closing operation. Corrosion is to expand the area with small gray value, while expansion is to expand and enhance the area with large gray value, but they are often combined and used together. Fig.6A shows the result of closing operation, which expands the connected region. Fig.6B shows the result of opening operation, and the fine white points in the image are eliminated.

Fig.6 Calculation results of morphological processing
This was the image preprocessing under simple background, but in case of the image with complex background, the complex background will affect the extraction of features, so the image background needs to be removed first.
5.2 Characteristic map extraction—Image preprocessing under complex backgroundThe objects identified in this study were different not only in texture features but also in color, and the difference in color was large. Therefore, in the case of complex background, the color of the image should be processed first. RGB color space is the most common color pattern in image processing, and is the most basic and commonly used color space[8]. The advantage is intuitive and easy to understand, and the disadvantage is that R, G and B components are highly correlated. The RGB color characteristics of cotton plants are very obvious, and the RGB characteristics of cotton plants and soil are obviously different. Therefore, RGB color processing was carried out, and operations were performed in the MATLAB command bar.
As shown in Fig.7, the image can be input into the computer, and the mouse was moved to the place where people want to get the color, and clicked to get the color. The color obtained was stored on the right side. Exporting color data was outputted from a command window.
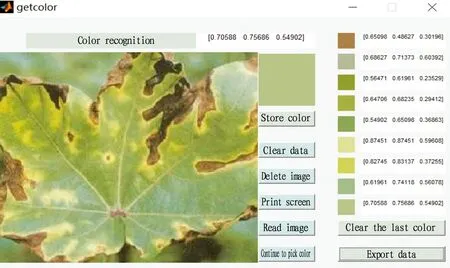
Fig.7 Extraction of color information
6 Comparative analysis of characteristic database cotton diseases and insect pests
In this study, the deep learning training method was first selected, and the pre-training network was imported via deep learning network toolbox in MATLAB software for training and learning. Afterwards, the BP neural network was used for training. After the experimental results were obtained, the accuracy was compared to analyze which algorithm is more suitable for identifying the species of cotton diseases and insect pests.
6.1 Application of deep learning in characteristic recognition cotton pests and diseasesDeep learning is a complex machine learning algorithm, which has obvious advantages in image recognition. It can realize automatic learning by building a multi-layer network, obtain the data hidden in the links, extract higher dimensional and more abstract data, and make the learned characteristics more expressive.
6.1.1Methods. The deep learning network toolbox in MATLAB software was used to import the pre-training network, design the network structure, adjust the main parameters, and conduct training and learning.
6.1.2Materials. A total of 368 original images were collected, including 80 images of normal cotton leaves, 76 images ofFusariumwilt, 32 images of angular leaf spot, 24 images ofVerticilliumwilt, 44 images of black spot, 20 images of anthracnose, 52 images of cotton aphid, and 40 images of cotton mite. The 8 categories of images were placed in 8 different folders, each of which represented a category label. Labels 1-8 represented normal leaves,Fusariumwilt, angular leaf spot,Verticilliumwilt, black spot, anthracnose, cotton aphid, and cotton mite, respectively. 30% of the test set was taken directly from the training set.
6.1.3Preprocessing of dataset. The original Alexnet model is a classification for ImageNet dataset, and the data are simply preprocessed. All datasets used in the test were also simply preprocessed, and the size of images was redefined. In this test, the image was redefined as 224×224×3, which reduced the pixel value and eliminated a large amount of redundant information, thus reducing the calculation amount.
6.1.4Experimental procedure. (i) Based on the Xception network module, the modified interface was entered. The input was imageinput and the right side was the parameter setting. In the right attribute of imageinput, inputsize was changed to (224, 224, 3), which is consistent with the size of the actual dataset; the nomalization as set as zerocenter, that is, zero-centered normalization; the mean of image normalization was 0, and the standard deviation was 1; the dimension was set as automatic. The fully connected layer was fullyconnectedlayer; the output was changed to 8 in attribute, and the outputs were softmax and classoutput.
(ii) After setting the parameters of Designer, the characteristic database data of cotton diseases and insect pests were imported. When clicking the import data card, there were two data sources, one of which was imported from a folder and the other of which was imported from the MATLAB workspace. When imported from a folder, the more data the better. However, due to the limited data collected, data enhancement (rotation, translation, mirror image, angle change,etc.) was used to expand the image database, and 30% of the training set was used for verification.
(iii) After importing, the training set and validation set were split proportionally, so the number of data sets and validation sets was the same. The role of the training set in the model process is to update the parameters of the model to obtain better performance, and its behavior confirms that the model has relevant knowledge. The abscissa is the category label and the ordinate is the number of observations. The validation set is equivalent to a practice exam, which is just an indicator of one’s own state. The outcome of this adjustment could be better or worse. The existence of the validation set helps us select the best performing model from a bunch of possible models, and can be used to select hyperparameters.
(iv) When data were successfully imported, parameters were first adjusted before training, and the training option was clicked to further set the training parameters. The gradient descent of learning selected by the solver was random. The Initial LearnRate was selected as 0.000 1. The learning rate has an important impact on iteration. The Initial LearnRate has an optimal value. If the value is too high, the model will not converge; if it is too small, the convergence speed will be particularly slow or the learning will be impossible. After many experiments, it is found that 0.000 1 was the best choice, and it is better to change minibanchsize to 5. After setting parameters such as model design, data import and training settings, the option training was clicked.
(v) Once the parameters were adjusted, training can be started. Fig.8a is the screenshot of the first round of training, and it can be seen that the accuracy was low at this time. After 1 530 iterations, the accuracy was 64.86%. The final results are shown in Fig.8b.

Note: a. The first round of training; b. The final results.
When the final results appeared, the data set and validation set were exported, and the codes were automatically generated, stored, and named Xception. A verification program was then written, and named TestCode. The program is shown in appendix 3. The EXCEL sheet name.xlsx was copied to MATLAB workspace, and verified by running the program. The image to be verified was selected, and the following results would appear (Fig.9).
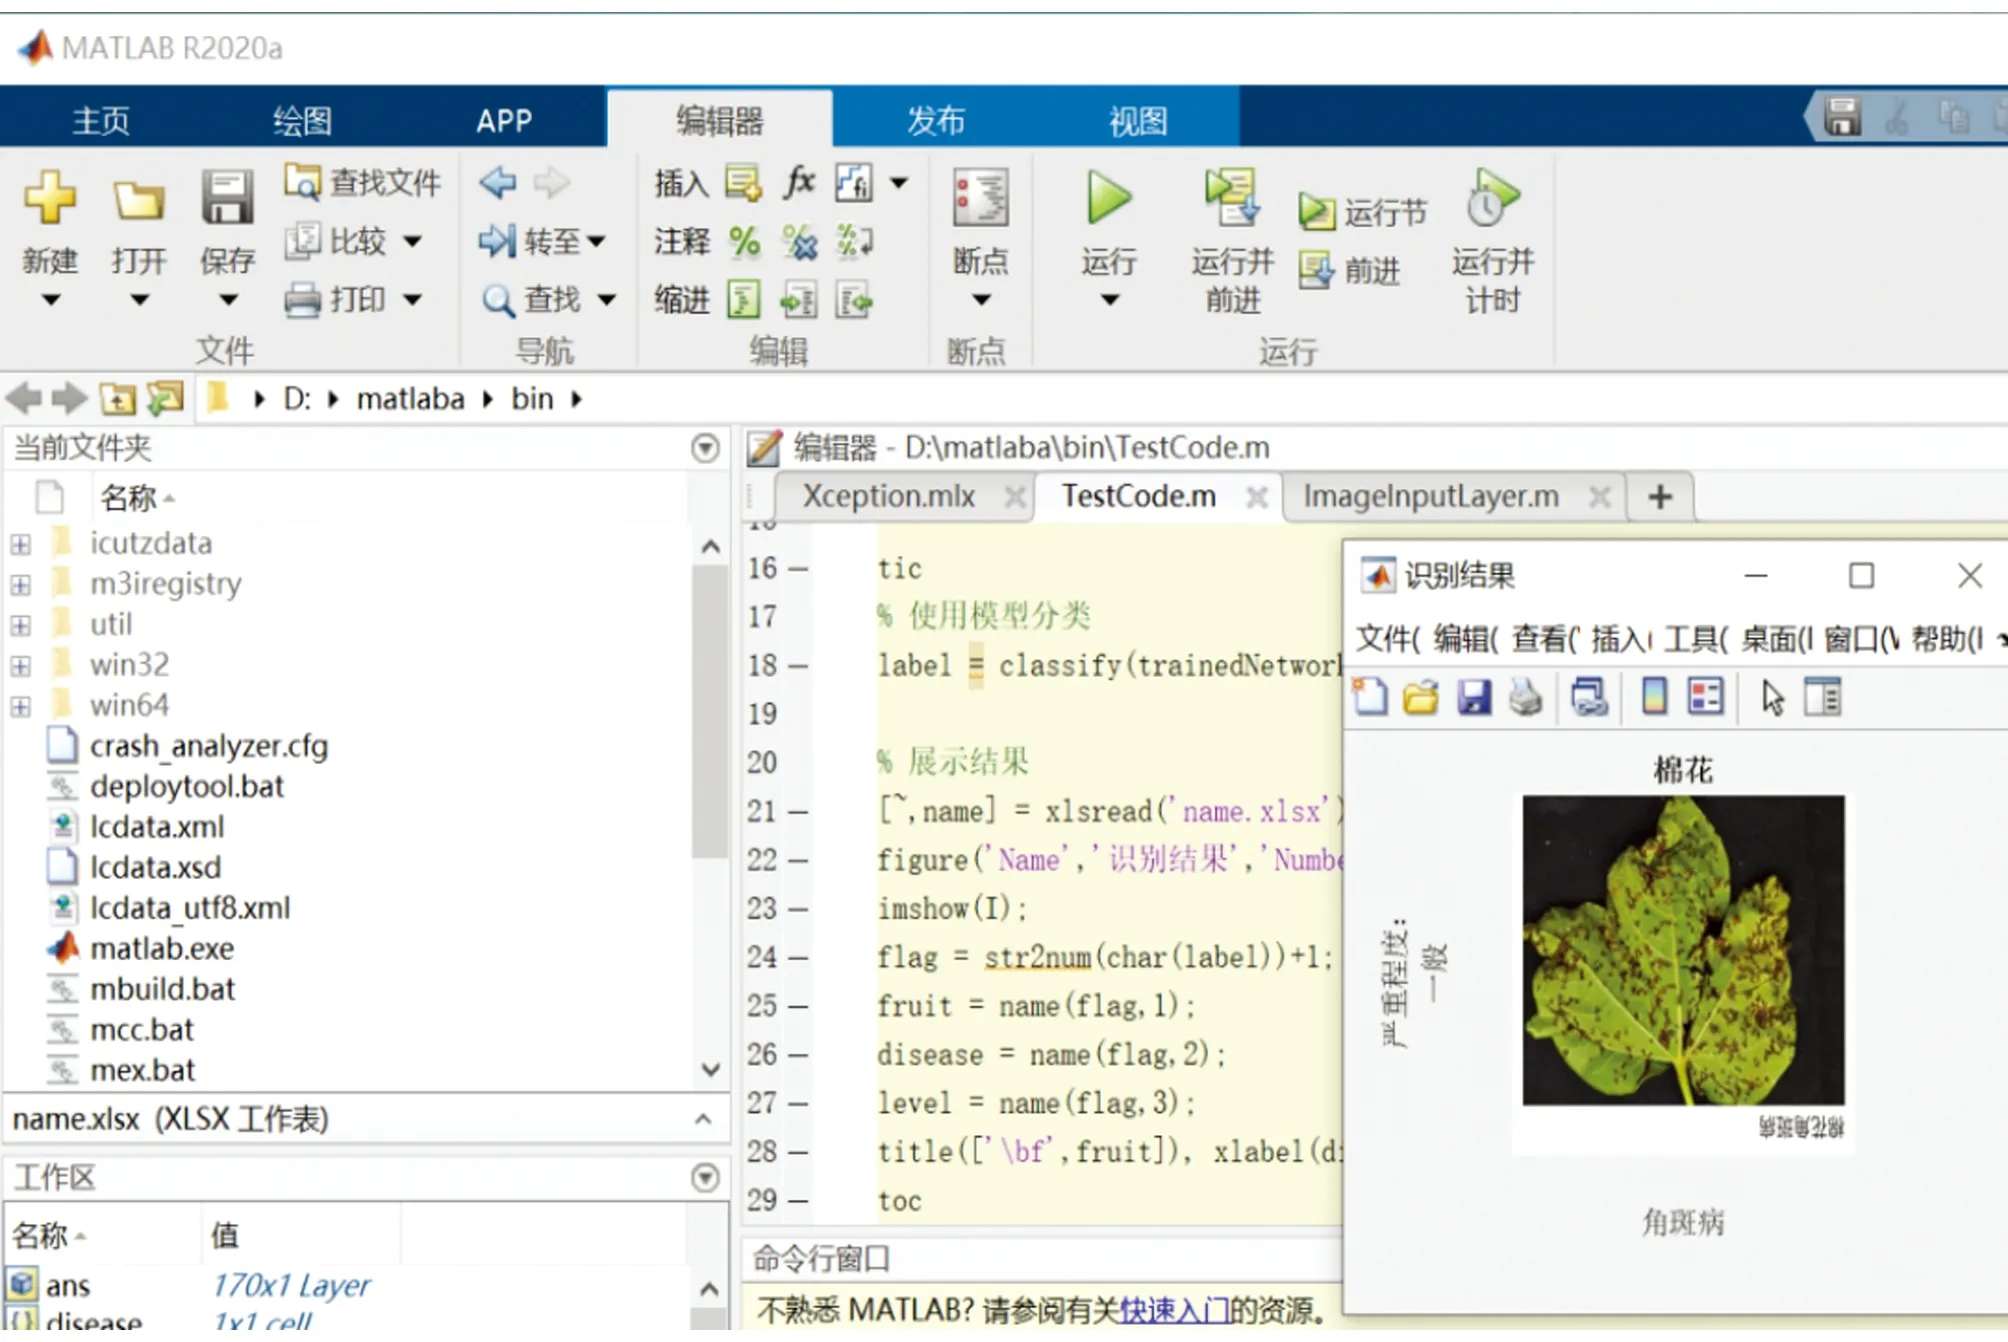
Fig.9 Correct verification
As the accuracy rate was only 64.86%, lower than the expected accuracy, some identification results were wrong. It is necessary to continue to adjust parameters for optimization to achieve higher accuracy.
6.2 Result analysisThe test had been successfully completed and the precision rate reached 64.84%. The comparison and summary showed that the results were attributed to the following reasons: (i) The amount of experimental training data was insufficient; (ii) The average brightness value of the image was uneven because there was no de-meanization of the image, which affected the training; (iii) The characteristic images of some datasets were fuzzy with insufficient accuracy; (iv) The image environment was too complex since the original background and stem of the image were not removed, and the quality of the image was not high, which affected the training; (v) Parameter adjustment was not ac-curate enough. The parameters affecting the curve in deep learning included Initial LearnRate, hidden layer, number of units, minibatchsize, number of hidden layers, and attenuation coefficient of learning rate. Due to the large operation problems of the experimental equipments, this study mainly started from the optimization of Initial LearnRate and minibatchsize.
6.3 Improvements in parametersBecause the expected learning accuracy can reach 80%, and it had not reached the expected accuracy, it was improved by changing the main parameters.
(i) minibatchsize: the minibatch was modified; when the minibatch was 5, the accuracy was 64.84%; when the minibatch was modified to 6, the training time became longer and the accuracy was 66.82%; if the minibatch was 8, the training time was even longer and the accuracy decreased to 62.93%. The smaller the batch, the less significant the acceleration effect was likely to be. Certainly, bigger batch is not always better, and weight update will not be so frequent in case of too large batch, resulting in too long optimization process[9]. Therefore, the minibatch size should be selected according to the size of datasets and the computing capacity of equipments. In this experiment, increasing the minibatchsize took longer and got lower accuracy. It was found that the gradient descent method using sgdm with appropriate value of minibatch could greatly speed up the training speed and improve the accuracy. However, the batch size should not be too small. If the batch size is too small, the adjustment value will be random, and the training of samples may not be the most effective. If the batch size is too large, it will adversely affect the training set epoch[10].
(ii) Initial LearnRate. The initial LearnRate was changed to 0.001, and the accuracy rate reached up to 72.55%. The initial LearnRate has an optimal value. If it is too large, the model will not converge; if it is too small, the model will converge very slowly or the learning will be impossible[11].
6.4 BP neural networks algorithmIn this paper, MATLAB 2020 was used to identify BP neural network algorithm. The BP network test was carried out on CPU, a total of 368 cotton leaves were trained, including 80 images of normal cotton leaves, 76 images ofFusariumwilt, 32 images of angular leaf spot, 24 images ofVerticilliumwilt, 44 images of black spot, 20 images of anthracnose, 52 images of cotton aphid, and 40 images of cotton mite. In this paper, 40 images of diseased blades were identified, and the recognition results obtained are shown in Table 1.

Table 1 Recognition accuracy of BP neural network
As shown in Table 1, the recognition rate of BP neural network was low. Therefore, it is not suitable for automatic identification of cotton diseases and insect pests.
7 Conclusions
MATLAB software was used to carry out deep learning and BP neural network algorithm was used to compare the feature similarity with the images in the established characteristic database of cotton diseases and insect pests. Through the comparative analysis of characteristics of a large number of diseases and insect pests, it was found that deep learning method had high discrimination accuracy (72.55%). To solve the problem of low accuracy, the dataset can be further optimized, such as removing the background, removing the roots and stems, de-meanization of the image, and continuing to adjust and optimize parameter configuration, and the accuracy is expected to reach more than 85%. Theoretically, the recognition rate of BP neural network should be relatively high, but it is difficult to achieve satisfactory results in practice, and the effect is not good in practical use due to too long training time and very low efficiency. There are many reasons that may cause such results, such as methods or inaccurate data model,etc., which will be further studied in the future. The current research results show that the dynamic detection system using deep learning can better find the characteristics of cotton diseases and insect pests, and timely achieve early detection and treatment, so as to effectively improve the yield and quality of cotton. The result has certain reference for improving the overall benefit of cotton growth.
- 植物病虫害研究(英文版)的其它文章
- Demonstration and Promotion of Integrated Management Technology of Wheat Sheath Blight and Wheat Crown Rot in Zibo City
- Status Analysis of Recycling and Disposal of Pesticide Packaging Waste in Western Zhejiang
- Identification and Control of Several Leaf Diseases of Poplar
- Life History and Control Measures of Dendrolimus sibiricus Tschetw. in Northeast China
- Control Measures against Main Pinus koraiensis Diseases in Liaoning Province
- Effects of Different Fertilization Measures on Chemical Composition and Quality of Flue-cured Tobacco

