
Solar Flare Forecast Model Based on Resampling and Fusion Method
2022-09-02 12:25JieWanJunFengFuDaiMinTanKeHanMengYaoYuandPeng
Jie WanJun-Feng FuDai-Min TanKe HanMeng-Yao Yuand Peng E
1 Laboratory for Space Environment and Physical Sciences,Harbin Institute of Technology,Harbin 150001,China; epeng@hit.edu.cn
2 School of Electrical Engineering and Automation,Harbin Institute of Technology,Harbin 150001,China
3 School of Computer and Information Engineering,Harbin University of Commerce,Harbin 150028,China
Abstract Predicting the activity of solar flares is of great significance for studying its physical mechanism and the impact on human production and life.Problems such as class imbalance,high time-series sensitivity,and over-localization of important features exist in the sample data used for flare forecasting.We design a solar flare fusion method based on resampling and the CNN-GRU algorithm to try to solve the above problems.In order to verify the effectiveness of this fusion method,first,we compared the forecast performance of different resampling methods by keeping the forecast model unchanged.Then,we used the resampling algorithm with high performance to combine some single forecast models and fusion forecast models respectively.We use the 2010–2017 sunspot data set to train and test the performance of the flare model in predicting flare events in the next 48 h.Through the conclusion of the above steps,we prove that the resampling method SMOTE and its variant SMOTE-ENN are more advantageous in class imbalance problem of flare samples.In addition,after the fusion of one-dimensional convolution and recurrent network with“forget-gate”,combined with the SMOTEENN to achieve TSS=61%,HSS=61%,TPRate=77%and TNRate=83%.This proves that the fusion model based on resampling and the CNN-GRU algorithm is more suitable for solar flare forecasting.
Key words: (Sun:) sunspots–Sun: flares–Sun: X-rays–gamma-rays–Sun: magnetic fields–Sun: corona
1.Introduction
1.1.Flare Forecast Background Description
The eruption of solar flares is a complex nonlinear process,which is an important issue in the field of solar-terrestrial research (Soumya et al.2020).When it explodes,it will generate a huge energy and probably with coronal mass ejection (CME) (Temmer et al.2010).The generated rays and high-energy particles will affect the operational reliability of space-based and ground-based systems.The earliest human discovery of flares dates back to 1859,when British astronomer Carrington observed flashes in the visible light range(Carrington1859).A reliable flare forecasting model should explain how energy is stored in the Sun’s atmosphere and how it is released.The accepted standard is to refer to the flare model Sweet-park (Parker1957) to describe the evolution mechanism of flares under steady-state magnetic reconnection.It is believed that the energy released by the flare comes from the magnetic field,and the core process of specific energy release and transformation is magnetic reconnection.
However,there is no more reliable physical model used to accurately describe the flare mechanism in the existing research;data-driven models are better at establishing nonlinear mapping relationships with a large number of samples.The use of machine learning methods combined with data processing technology to research on flare forecasting is of great significance.
1.2.Flare Forecasting Methods
The core problem of solar flare forecasting is to effectively distinguish flare events from non-events.Park and Leka’s research focuses on the“transition region”between flare events and non-events (Park et al.2020).The study captures all flare events in a complete solar cycle,graphically and quantitatively showing three different event types: event/event,no event/event,no event/no event.However,this method is highly dependent on human experience and does not take into account the temporal characteristics of flares during their evolution.There are attempts to design solar flare forecasting algorithms to study short and long term fluctuations in sunspots (Soumya et al.2020).By acquiring sunspot data of 12 months,the study analyzed the performance of short-term data and medium-tolong-term data in forecasting,and finally proved that sequence data containing nonlinear and multi-period information can better describe the evolution of flares.
In order to improve the performance of forecasting algorithm,Nishizuka tried to build a special deep learning model named DeFN (Nishizuka et al.2020) deep learning network.The basic principle is to automatically identify sunspots through a convolutional network,and then extract 79 features.Soft X-ray data are used to evaluate flare levels,includingX-level,M-level,andC-level large flares.Finally,the correlation analysis of these 79 features and the flare level is carried out for flare forecasting.
In terms of deep learning networks,some scholars have proposed further methods.Yi et al.(2020) introduced Long Short-Term Memory (LSTM) networks for flare forecasting,evaluating and comparing them with four regression models.Finally,the model was evaluated using ten-fold crossvalidation and rms error criterion.The testing results proved that this improved recurrent network has better performance in forecasting.However,unlike other studies,this study only made time series forecasting of X-ray flux,and did not discuss other predictors that affect flare events in detail.
1.3.Problems to be Solved Urgently in Flare Forecasting
Compared with other typical machine learning,deep learning is more suitable for processing large amounts of data to obtain corresponding patterns.Solar activity is highly correlated with time accumulation,and only convolutional layer networks cannot capture the time-series features in samples.Solar activity is mainly concentrated in sunspots,and only Recurrent Neural Network(RNN) cannot fully adapt to the problem of highly localized features.Some scholars have tried the fusion of convolutional layers and recurrent networks,which are widely used in other industries(Wang et al.2016),but did not explain how to solve the problem of flare forecasting.
M-class and X-class flare events are low-probability events,and there are a large number of class imbalances (Wan et al.2021),and the models used to predict solar flares also need to deal with class imbalances.The testing results have proved that directly using unbalanced processing algorithm such as resampling or weighting is not conducive to the accuracy of the forecasting model.We need to select a class imbalance processing algorithm suitable for the flare forecasting problem by comparing comprehensively.
The sections of this paper are arranged as follows:Section1is Introduction.Section2introduces the data and basic methods,including how to obtain the data and typical deep learning methods.Section3introduces the fusion algorithm applied to flare forecasting,including the use of the improved synthetic minority oversampling technique(SMOTE)algorithm,and how to achieve the fusion of 1D convolutional and recurrent networks.Section4presents testing and analysis,where we introduce the adopted evaluation metrics and show the specific performance of each method.Section5draws the conclusion.
2.Data and Method
2.1.Data Source
Accurately classifying labels in flare samples is the basic task of forecasting.A more common approach is to extract all the predictors and corresponding data on whether or not a flare event will occur through an open source website.
For sunspot acquisition,we can easily download daily sunspot observation data from (ftp.swpc.noaa.gov/pub/warehouse).We can also extract forecast data for solar flares as comprehensively as possible by selecting keywords on the JSOC website(https://www.jsoc.stanford.edu).Among them,the selection of predictors is in principle not less than 10.The sampling time of single predictor data is not less than 1 minute or more than 1 week,and the total sample sampling time of all predictors is not less than 1 yr.
Regarding the method of acquiring soft X-ray labels,GOES satellites are civilian geostationary orbiting weather satellites under the umbrella of NOAA and NASA.The satellite continuously observes and records data related to soft X-ray flares,including start time,end time and level based on soft X-ray flux assessments,and NOAA numbers for the sunspot.If a flare of magnitude M1.0 and above occurs in the sunspot within the next 48 h,it is marked as a positive sample and marked as “1”.Otherwise,a negative sample is marked as “0”.
SunPy is a Python-based API for solar physicists.Through the program written by yourself,you can easily obtain the GOES flare event data set within a specified time range through SunPy,as a reference for the labeling of subsequent flare samples.Of course,what you need to know is that a more convenient way to obtain data is to refer to the sunspot magnetogram and flare data set(Xin et al.2018)provided by the Interdisciplinary Innovation Working Group on Space Environment Early Warning and Artificial Intelligence Technology.
We choose the sunspot sequence data from 2010 to 2017 as the initial data.The main parameters included are shown in Table1.
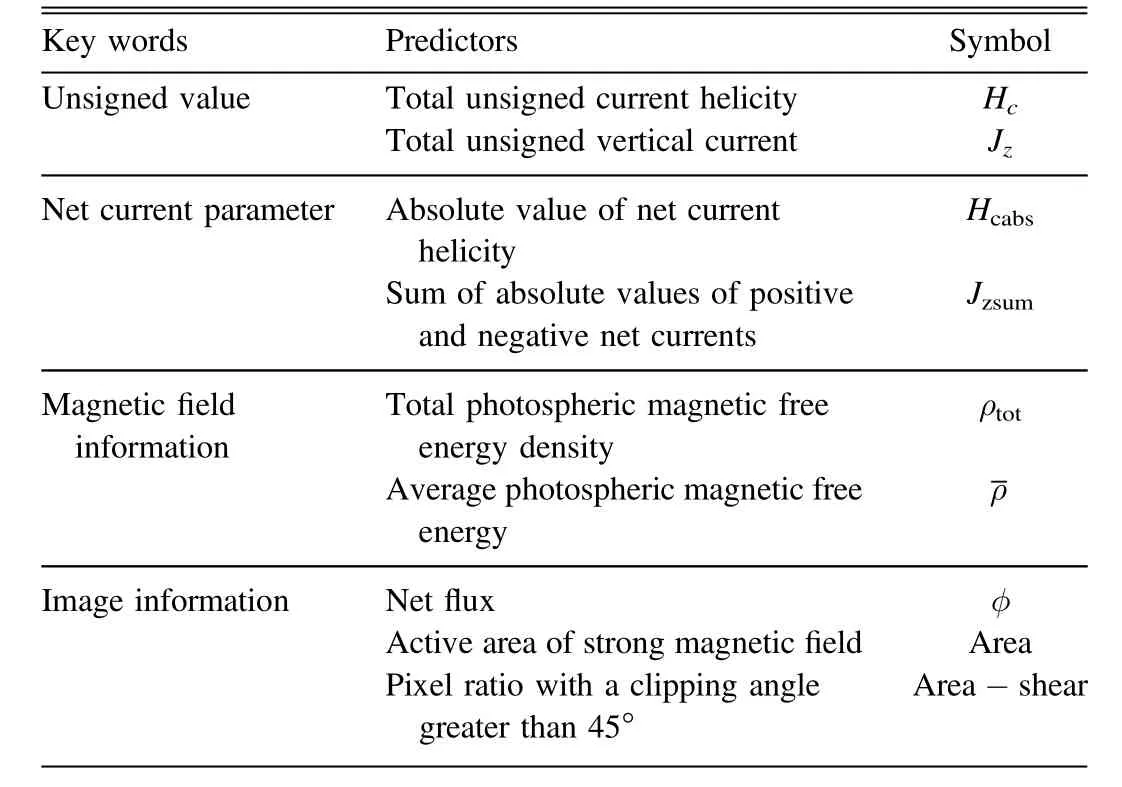
Table 1Main Parameters
2.2.Deep Learning Method
Deep learning not only has obvious advantages when dealing with massive amounts of data but also has the nature of extracting features from the original data,which can mine unknown internal connections and mechanisms in the data.Multiple neurons form a neural network,including an input layer,a hidden layer,and an output layer.In particular,the introduction of the hidden layer strengthens the expressive ability of the network,but it also leads to an increase in computational complexity.The hidden layer can have more than one layer,the output layer can also have multiple outputs.
The neural network realizes the extraction of knowledge by transforming the input data layer by layer.The weights of the transformation are obtained through learning.This process is the “training model”.First,the network transforms the input value and outputs the predicted value.Then,the loss function is used to calculate the difference between the predicted value and the true value to obtain the loss value.Finally,the optimizer uses the value calculated by the loss function to update the weights value in the opposite direction of the gradient and so on,until the model accuracy reaches a satisfactory accuracy or the convergence is complete.
Convolutional Neural Network (CNN) algorithms are designed to process data with a grid structure such as a matrix.The neurons between the layers are locally connected,and weight values are shared among all neurons in a single layer,thereby reducing the amount of calculation.For one-dimensional sequence data,the one-dimensional CNN is used to extract local features,as shown in Figure1.For twodimensional data such as magneto-grams,the two-dimensional CNN is generally used for feature extraction,and the calculation principle is shown in Figure2.
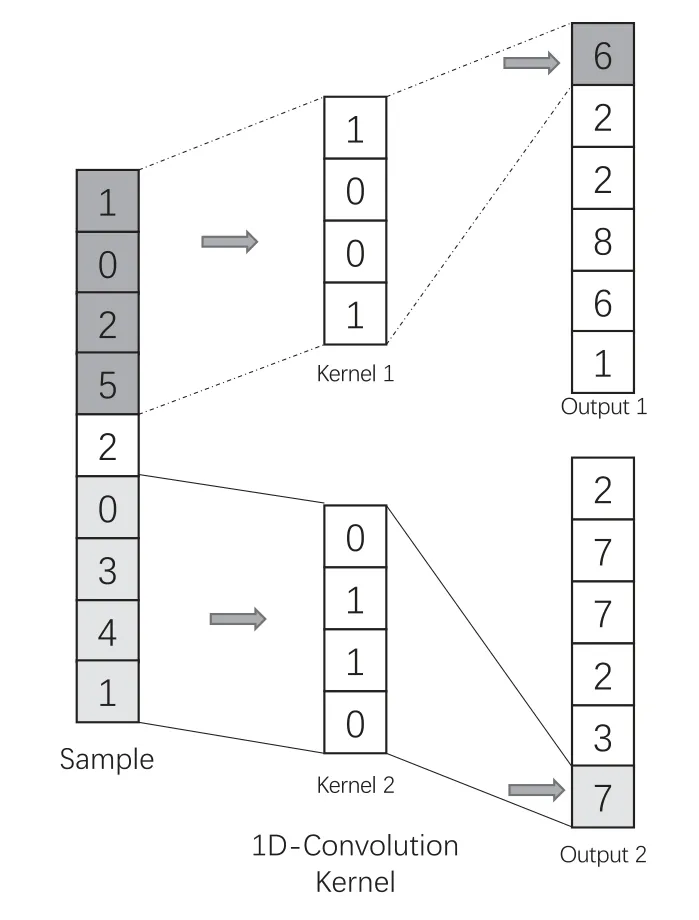
Figure 1.One-dimensional convolution.
For RNN,its feature is that the hidden layer transformation result of the previous sample and the current sample is used as the input of the network at the same time,thus introducing the concept of time.In formula (1),uandvare the weight matrices between hidden layers,Ht−1andHtare the hidden layers of the previous sample time series value.f(.)is the activation function,andwis the weight matrix of the time series.However,the traditional RNN only considers neighboring samples,that is,the state at the most recent moment,and cannot well extract features with long-term dependence.Therefore,a variant of RNN called LSTM was proposed by Jurgen Schmidhuber quote in 1997 (Hochreiter &Schmidhuber1997).In recent years,it has been widely used as the basic structure of deep learning networks,mainly for fusion with CNN and other feature recognition algorithms

Compared with the traditional RNN,LSTM obtains the transmission stateCtthat RNN does not have,as shown in Figure3.In the process of successive network transformation of samples,the gate stateCtchanges very slowly compared with the transformation valueHtof the hidden layer.This remembers longterm information and forgets unimportant information.

Figure 2.Two-dimensional convolution.

Figure 3.Typical RNN network principle.

Figure 4.SMOTE resampling effect comparison.
LSTM has many internal operation parameters,which makes matrix operation difficult.Therefore,its improved variant Gated Recurrent Unit(GRU)was proposed.GRU has one less gating setting than LSTM and uses the same gate state to achieve selection and forgetting memory.It has fewer parameters than LSTM,so it is easier to train and can achieve similar or even better results.
3.Solar Flare Fusion Forecasting Model Based on Class Imbalance and CNN-GRU Algorithm
3.1.SMOTE-ENN Resampling Algorithm Based on Clustering
The idea of SMOTE is summarized as interpolating between minority samples to generate additional samples.Define the density of minority class samplesxiasDi.The densityDirefers to the number of samples whose distance from the samplexiis less than or equal to the average distance between samples in the minority class.Record the density thresholdDTas the mean of the densityDiof all minority class samplesxi.Determine the relationship betweenDiandDT.IfDiis less thanDT,the sample is a dense point,otherwise it is a sparse point.
The characteristic of SMOTE is that it will randomly select minority samples to synthesize new samples,regardless of the surrounding samples.This is likely to cause two problems: (1) if the selected minority samples are surrounded by minority samples,the newly synthesized sample will not provide much useful information.This is like the point far from the margin in the support vector machine that has little effect on the decision boundary.(2)If the selected minority samples are surrounded by majority samples,such samples may be noises,then the newly synthesized sample will overlap most of the surrounding majority samples,making classification difficult.The effect of the SMOTE algorithm is shown in Figure4.Therefore,it is necessary to implement the Edited Nearest Neighbor(ENN)method in the data cleaning method.

Figure 5.Basic principles of the fusion model.
For a sample belonging to the majority class,if more than half of its K neighbors do not belong to the majority class,this sample will be eliminated.Another variant of this method is that all K neighbors do not belong to the majority class,and this sample will be eliminated.The disadvantage of the SMOTE algorithm is that the generated minority samples are easy to overlap with the surrounding majority samples and are difficult to classify.The data cleaning technology can just deal with overlapping samples,so the two can be combined to form a pipeline,namely“SMOTE-ENN”(Lu et al.2019).“SMOTEENN” can usually remove more overlapping samples.
3.2.Fusion Algorithm Based on CNN-GRU
A forecasting model based on a convolutional network fusion recurrent neural network is built.As shown in Figure5,the magneto-gram information is extracted through the convolutional network,the sample features are output,and then the pattern recognition is performed through the recurrent neural network,and then the global regression layer is designed to output the forecast result of the flare yield.The advantage of using the fusion model is that it can not only analyze the morphological characteristics of the active region from the magneto-gram,but also extract the time series characteristics based on the time evolution of the flare,and draw the forecasting conclusion through comprehensive judgment,which is closer to the actual evolution process of the flare than a single algorithm.
It should be noted that before constructing a forecast model,the data of sunspots need to be distinguished.Although the physical properties of sunspots are similar to a certain extent,it does not mean that they are in the same state at the same time.As shown in Figure6,data for different sunspots need to be input into the forecast model separately.Similarly,in the forecasting process,it is also necessary to associate the sunspot number with the model as much as possible.
We will explain the process from sequence data to sample.To analyze the impact of changes in sequence data in time series on flares,and to unleash the maximum performance of computing hardware.We concatenate sequence data consisting of multiple predictors into a 2D matrix whose rows and columns are features and batches,respectively.Take time series data of three predictors as an example,as shown in Figure7.
Next,we regard the matrix composed of predictors as input and design a one-dimensional convolution kernel and its relu function of the same width to complete the design of the convolution layer.As shown in Figure8.All convolutional layers use the same framework to capture the morphological features of the sequence data.
CNN will output this change rule as a set of features,and then through multiple layers and then through the RNN layer to capture the time change rule of these features.The specific process is shown in Figure9.

Figure 6.Associate sunspot numbers with forecast models.
Finally,this law is output to the full link layer for identifying and judging whether flares occur.
As shown in Figures8and9,the input to this model is the sequence data of the predictors,and the output is a Boolean value of whether a flare has occurred.The role of the convolutional network is that it is better at capturing the morphological laws in the samples and outputting them in the form of data.At the same time,considering that solar flares are a time-accumulating problem,we combine the GRU to capture long time series problems in sequence data.Compared with a single model,this model that considers both the regularity of data changes and the accumulation of time is more advantageous in flare forecasting.

Figure 7.Extension of sequence data to a two-dimensional matrix.

Figure 8.Design of convolutional layers.

Figure 9.Design of the recurrent network layer.
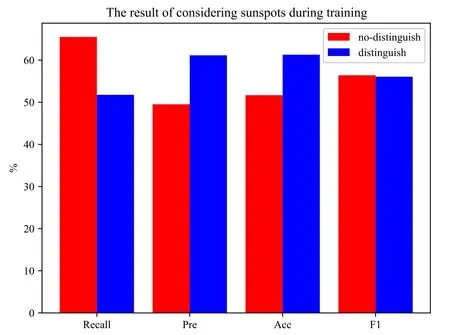
Figure 10.Comparing the effects of sunspot numbers on forecasts.
4.Performance Index and Test Results
4.1.Performance Index
This paper has researched the data-based forecasting strategies of solar flare physical activities.The main contents are as follows:First,according to the physical mechanism of solar flare eruption,a suitable combination of parameters is selected and the data are extracted.Learn algorithmic solar flare forecasting methods,and design multiple sets of comparative examples.The evaluation index used in this paper is the confusion matrix of the two-class(as shown in Table2) problem commonly used index and its derivative index to measure the performance of the model.

Table 2Confusion Matrix
In the field of machine learning,several basic indices are usually derived based on the above confusion matrix.The meaning and calculation formula is as follows:
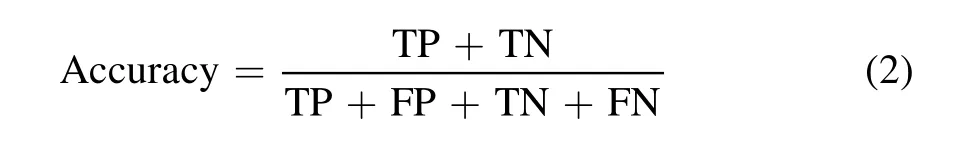
Accuracy: The model correctly detects the accuracy of all samples.When negative samples account for the vast majority of all samples,even if the “positive samples” representing the flare outbreak are misclassified,the accuracy rate is still high:
Recall: How many positive or negative samples were detected by the model? For the flare forecast model,the TP rate should be as high as possible to forecast all flare events as much as possible and prevent space weather disasters in time:

Precision: The confidence level of the positive or negative samples detected by the model.In the actual forecast,it is a contradiction with the recall rate:

F1coefficient: Comprehensive index,the harmonic average of recall rate,and precision rate.In the case of a high recall rate,to ensure that theF1coefficient is high,the accuracy rate is high:

The probability that the false report rate (FAR) model incorrectly predicts a negative sample as a positive sample:

In addition to the above-mentioned commonly used indicators in the field of machine learning,there are two general indicators in the field of space weather forecasting as follows:
Peirce scores: The full name of this indicator is True Skill Statistic,abbreviated as TSS:
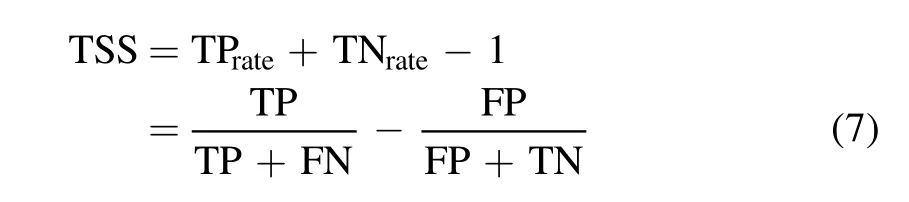
The value interval is [−1,1],which comprehensively evaluates the ability of the model to detect positive and negative samples.−1 means that the extreme cannot predict,and+1 means that the extreme can predict all flare events and non-flare events.Although the value interval of TSS is a closed interval,the TSS value rarely is “−1” or “1” in the complete ideal situation in the actual application process.
Heidke scores:The full name of this indicator is Heidke Skill Score,abbreviated as HSS:

It is not affected by the imbalance problem and measures the gain of the model compared to random forecasting.The value range is[0,1].When the HSS is equal to 0,the model does not have any predictive ability,and the perfect HSS takes the value is 1.
4.2.Test Methods and Results
First,in order to prove that sunspots need to be considered in the training process,we use the basic classifier to conduct a brief test,and the results are shown in Figure10.It can be seen from the figure that before the sunspot numbers are not distinguished,the classifier can hardly distinguish the flare events correctly,and this phenomenon has been significantly improved after distinguishing the sunspot numbers,especially in the Accuracy and Precision.It proves that it is very necessary to train after considering the number of sunspots in the process of flare forecasting.
To fully study the performance of machine learning models in the field of solar flare forecasting,this project uses a data set with a class imbalance ratio of 24:1(as shown in Figure4).To confirm the optimal resampling algorithm,the samples were randomly divided into three groups,denoted as Data A,Data B,and Data C.Based on the same classifier,the “Hybrid sampling”,SMOTE,and SMOTE-ENN algorithms were used for re-sampling.The conclusions of different sampling methods are shown in Figure11.It can be seen from the figure that the SMOTE-ENN method performs more prominently in most scenarios.
After confirming that SMOTE-ENN is the optimal resampling method,it is substituted into different classifiers.As shown in Figure12,using SVM,convolutional network CNN,recurrent network RNN,and its two variants LSTM and GRU,including the fusion model CNN-GRU and CNN-LSTM,it is found that the fusion model performs more prominently on most indicators.
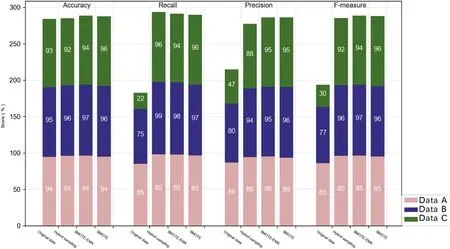
Figure 11.Comparing the performance of different resampling algorithms.

Figure 12.Comparison of performance index of forecast models.
5.Conclusions
This article has carried out research on the solar flare fusion forecasting model based on resampling and the CNN-GRU algorithm,and has drawn the following conclusions:
1.Class imbalance will affect model performances.Comparing the forecasting results of the original data,basic mixed sampling,SMOTE algorithm and DS-SMOTE algorithm,the resampled data show better performance than the unresampled data in the forecasting.In addition,the results show that the difference between SMOTE and DS-SMOTE is uncertain,and further testing is required to prove it.
2.The recurrent network has an important impact on the performance of the forecasting model.It can be seen from the test results that in the performance comparison of a single model,the comprehensive index of LSTM is higher than that of other single models,but after it is integrated with CNN,its performance is significantly reduced.In addition,the performance of the GRU model is not as good as that in a single model.LSTM,but the performance has been significantly improved after fusion.This proves that the optimal single model is not globally optimal after being extended to the fusion model,and the fitness of different forecasting models in different application scenarios is different.
3.The fusion model has more advantages in flare forecasting tasks.Comparing the results of the single algorithm and the fusion algorithm: the TSS and HSS of the fusion algorithm are all good,the classification ability of positive and negative samples is better,and the FAR has a certain degree of decline.Among them,the performance of CNN-GRU is the best,indicating that the addition of CNN improves the ability of GRU to extract features,combining the former’s lower FAR and the latter’s better detection effect of positive and negative samples.Comparing the performance of the two fusion strategies.It also proves that GRU is indeed easier to train and more practical than LSTM.
Considering that deep learning requires high computing hardware,this article does not compare the impact of different optimizers,different depths,different batch sizes,and different predictors on accuracy.
Acknowledgments
This work was funded by the National Natural Science Foundation of China (Grant No.11975086) project “3D Magnetic Reconnection Reconnection Area Structure Experimental and Numerical Simulation Research”.At the same time,we used data provided by the SDO/HMI.The SDO satellite is an operational satellite used for solar activity monitoring and forecasting.The equipped HMI instrument can provide continuous high-spacetime-accurate full-heliospheric photospheric observations.We still want to thank the SOLARSTROM2 data provided by the Space Environment Early Warning and Artificial Intelligence Technology Interdisciplinary Innovation Working Group,which provided us with powerful help in testing the imbalance algorithm.
ORCID iDs
 Research in Astronomy and Astrophysics2022年8期
- Research in Astronomy and Astrophysics的其它文章
- A Baseline Correction Algorithm for FAST
- Ultra-wide Bandwidth Observations of 19 Pulsars with Parkes Telescope
- Correlation between Brightness Variability and Spectral Index Variability for Fermi Blazars
- HI Vertical Structure of Nearby Edge-on Galaxies from CHANG-ES
- Analyzing Dominant 13.5 and 27day Periods of Solar Terrestrial Interaction:A New Insight into Solar Cycle Activities
- Identifying Outliers in Astronomical Images with Unsupervised Machine Learning