
A modified Kozeny-Carman equation for predicting saturated hydraulic conductivity of compacted bentonite in confined condition
2022-08-24 16:58:54KunlinRunXinLeiFu
Kunlin Run, Xin-Lei Fu
a Department of Civil and Environmental Engineering, Waseda University, Tokyo,169-8555, Japan
b Jiangsu Key Laboratory of Urban Underground Engineering and Environmental Safety, Institute of Geotechnical Engineering, Southeast University, Nanjing,210096, China
Keywords:Kozeny-carman (KC) equation Saturated hydraulic conductivity Bentonite Pore size distribution (PSD)Specific surface area
A B S T R A C T
1. Introduction
Deep geological disposal method was chosen by different countries for handling high-level nuclear waste from nuclear power industry(JNC,1999;SKB,2011).In a Japanese project,a multibarrier system consisting of buffer material and natural rock is designed to prevent the leakage of nuclide waste. Bentonite and bentonite-based material are selected as buffer material due to their low hydraulic conductivity and superior swelling capability(Sun et al., 2009, 2013; Fu et al., 2021a,b, 2022).
Pore in compacted bentonite, which has been proved having crucial effect on mechanical properties,has received wide attention and been studied intensively. However, classification standard for pores in bentonite is not uniform. A generally accepted category(see Fig. 1) is: (1) inter-layer pore (micro-level), (2) inter-particle pore (pore in aggregates, meso-level), and (3) inter-aggregate pore (pore between aggregates, macro-level) (Pusch, 2001; Pusch and Yong, 2006; Romero, 2013; Chen et al., 2020). Some researchers (e.g. Sedighi and Thomas, 2014) combined meso-level and macro-level pores into new “macropore” (see Fig.1). In general, mercury intrusion porosimetry (MIP) technology has been widely used to investigate pore size distribution (PSD) in compacted bentonites(Delage et al.,2006;Lloret et al.,2003).However,pores between two individual montmorillonite layers with diameter smaller than 3.7 nm(Xiong et al.,2016)cannot be determined using MIP.Therefore,X-ray diffraction(XRD),as a novel technology,is used to obtain pore characteristics in compacted bentonite for more precise results (Likos and Lu, 2006).
Hydraulic conductivity of compacted bentonite is strongly affected by PSD (Wang et al., 2013; Gao et al., 2021). Kozeny-Carman (KC) equation proposed by Kozeny (1927) and Carman(1937) associates hydraulic conductivity with porosity in porous material.In geotechnical engineering field,there is a consensus that KC equation only performs well with the hydraulic conductivity of sands but not clays.However,this view is just supported by partial demonstration.Chapuis and Aubertin(2003a,b)and Chapuis(2012)summarized experimental results of hydraulic conductivities of some clays, including kaolinite, illite, Boston blue clay, and Champlain clay (Olsen,1960; Tavenas et al.,1983; Al-Tabbaa and Wood,1987). It is apparently seen from Fig. 2a that KC equation can predict saturated hydraulic conductivities of non-expansive soils well.However, KC equation does not perform well for hydraulic conductivity of bentonite (Chen et al., 2020). For example, it can be seen from Fig. 2b that there are errors between predicted values calculated using KC equation and experimental data of different bentonites: MX-80 (Pusch, 2001), GMZ (Wen, 2006), Kunigel-V1(Hasegawa, 2004), FEBEX (Villar, 2002), and Kunibon (Komine,2008). Therefore, it is of paramount importance to improve KC equation for predicting saturated hydraulic conductivity of bentonite better.
In this study, attempts were made to modify KC equation for predicting saturated hydraulic conductivity of compacted bentonite more precisely. KC equation was modified based on a new dual-pore system in compacted bentonite.Basal spacing from changeable specific surface area during saturation was used for obtaining PSD.A comprehensive comparison of predicted saturated hydraulic conductivity for compacted bentonite was conducted according to modified KC equation proposed in this study, conventional KC equation, and prediction method based on diffuse double layer (DDL) theory reported in previous studies.
2. Modifying KC equation based on water flow mechanism
2.1. Microstructure of compacted bentonite and pore classification
Generally, microstructure of compacted bentonite consists of unit layer, particle, and aggregate (Jacinto et al., 2012). The microstructure of compacted bentonite is schematically shown in Fig.1.Montmorillonite, the main composition of bentonite, is generally accepted as a 2:1 unit layer consisting of an alumina octahedral sheet sandwiched between two silica tetrahedral sheets (TOT,approximately 9.6 Å in thickness from Mitchell and Soga, 2005).Several unit layers are often combined in a face-to-face orientation and compose a particle subsequently. Furthermore, aggregates made up by several particles are formed.
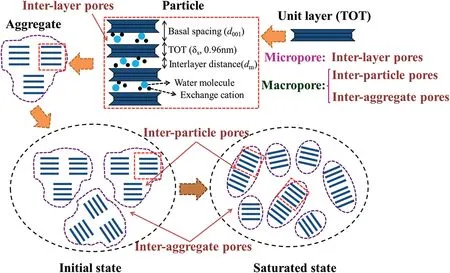
Fig.1. Schematic diagram of fabric units of compacted bentonite and their developments under confined wetting.
MIP technology has been widely used to investigate PSD in the compacted bentonite.This method can retrieve the pore sizes at the range of 3.7 nm-500 μm (Delage et al., 2006; Xiong et al., 2016).However,the distance between unit layers is generally smaller than 3.7 nm in confined condition,which is important to the mechanical characteristics of bentonite. Therefore, XRD technology was adopted to evaluate pore system in compacted bentonite to make up for the deficiency of MIP technology (Holmboe et al., 2012). Basal spacing is transformed from the result of XRD into pore size by different microstructural hypothesizes. For example, Likos and Lu(2006) assumed quasicrystals uniformly distributed in bentonite.XRD can only measure inter-layer distance, but pore properties of aggregate and inter-aggregate are impossible to be obtained.Therefore, a novel pore classification was proposed by some scholars based on XRD (Likos and Lu, 2006; Sedighi and Thomas,2014). They separated pores into micropores (i.e. inter-layer pores) and macropores (i.e. inter-particle pores and interaggregate pores)(see Fig.1).
2.2. Modifying KC equation by water flow mechanism in different pores
Generally,pore properties have a great contribution to the flow characteristics of porous materials. Kozeny (1927) and Carman(1937) related the saturated hydraulic conductivity (ksat) with saturated total porosity (ntotal,s) as the KC equation. This equation was firstly proposed by Kozeny(1927)based on the assumption of a series of capillary tubes of equal length (Chapuis and Aubertin,2003a,b). Carman (1937, 1938a,b, 1939) tried to apply this equation to calculating the hydraulic conductivity of saturated sands,soils, and clays by assuming that water moves around irregular shaped solid particles instead of straight channels.The KC equation is considered to be approximately valid for sand but inadequate for clays,which is because that the KC equation was established as per solid-fluid system (Lambe and Whitman, 1969; Domenico and Schwartz, 1997; Mitchell and Soga, 2005). However, this opinion lacks demonstration. Carman (1939) ascribed that the thin water layer attached at the surface of clayey particle could provide a solidfluid interface for water flow. As shown in Fig. 2a, by comparing experimental results of hydraulic conductivities of kaolinite, illite,and Boston blue clay from Olsen (1960), Champlain clays from Tavenas et al. (1983), kaolinite from Al-Tabbaa and Wood (1987)with KC equation prediction database, Chapuis (2012) concluded that KC equation provided a good prediction for hydraulic conductivities of some clays. Applying this equation to bentonites, KC equation can be expressed as (Chen et al., 2020):
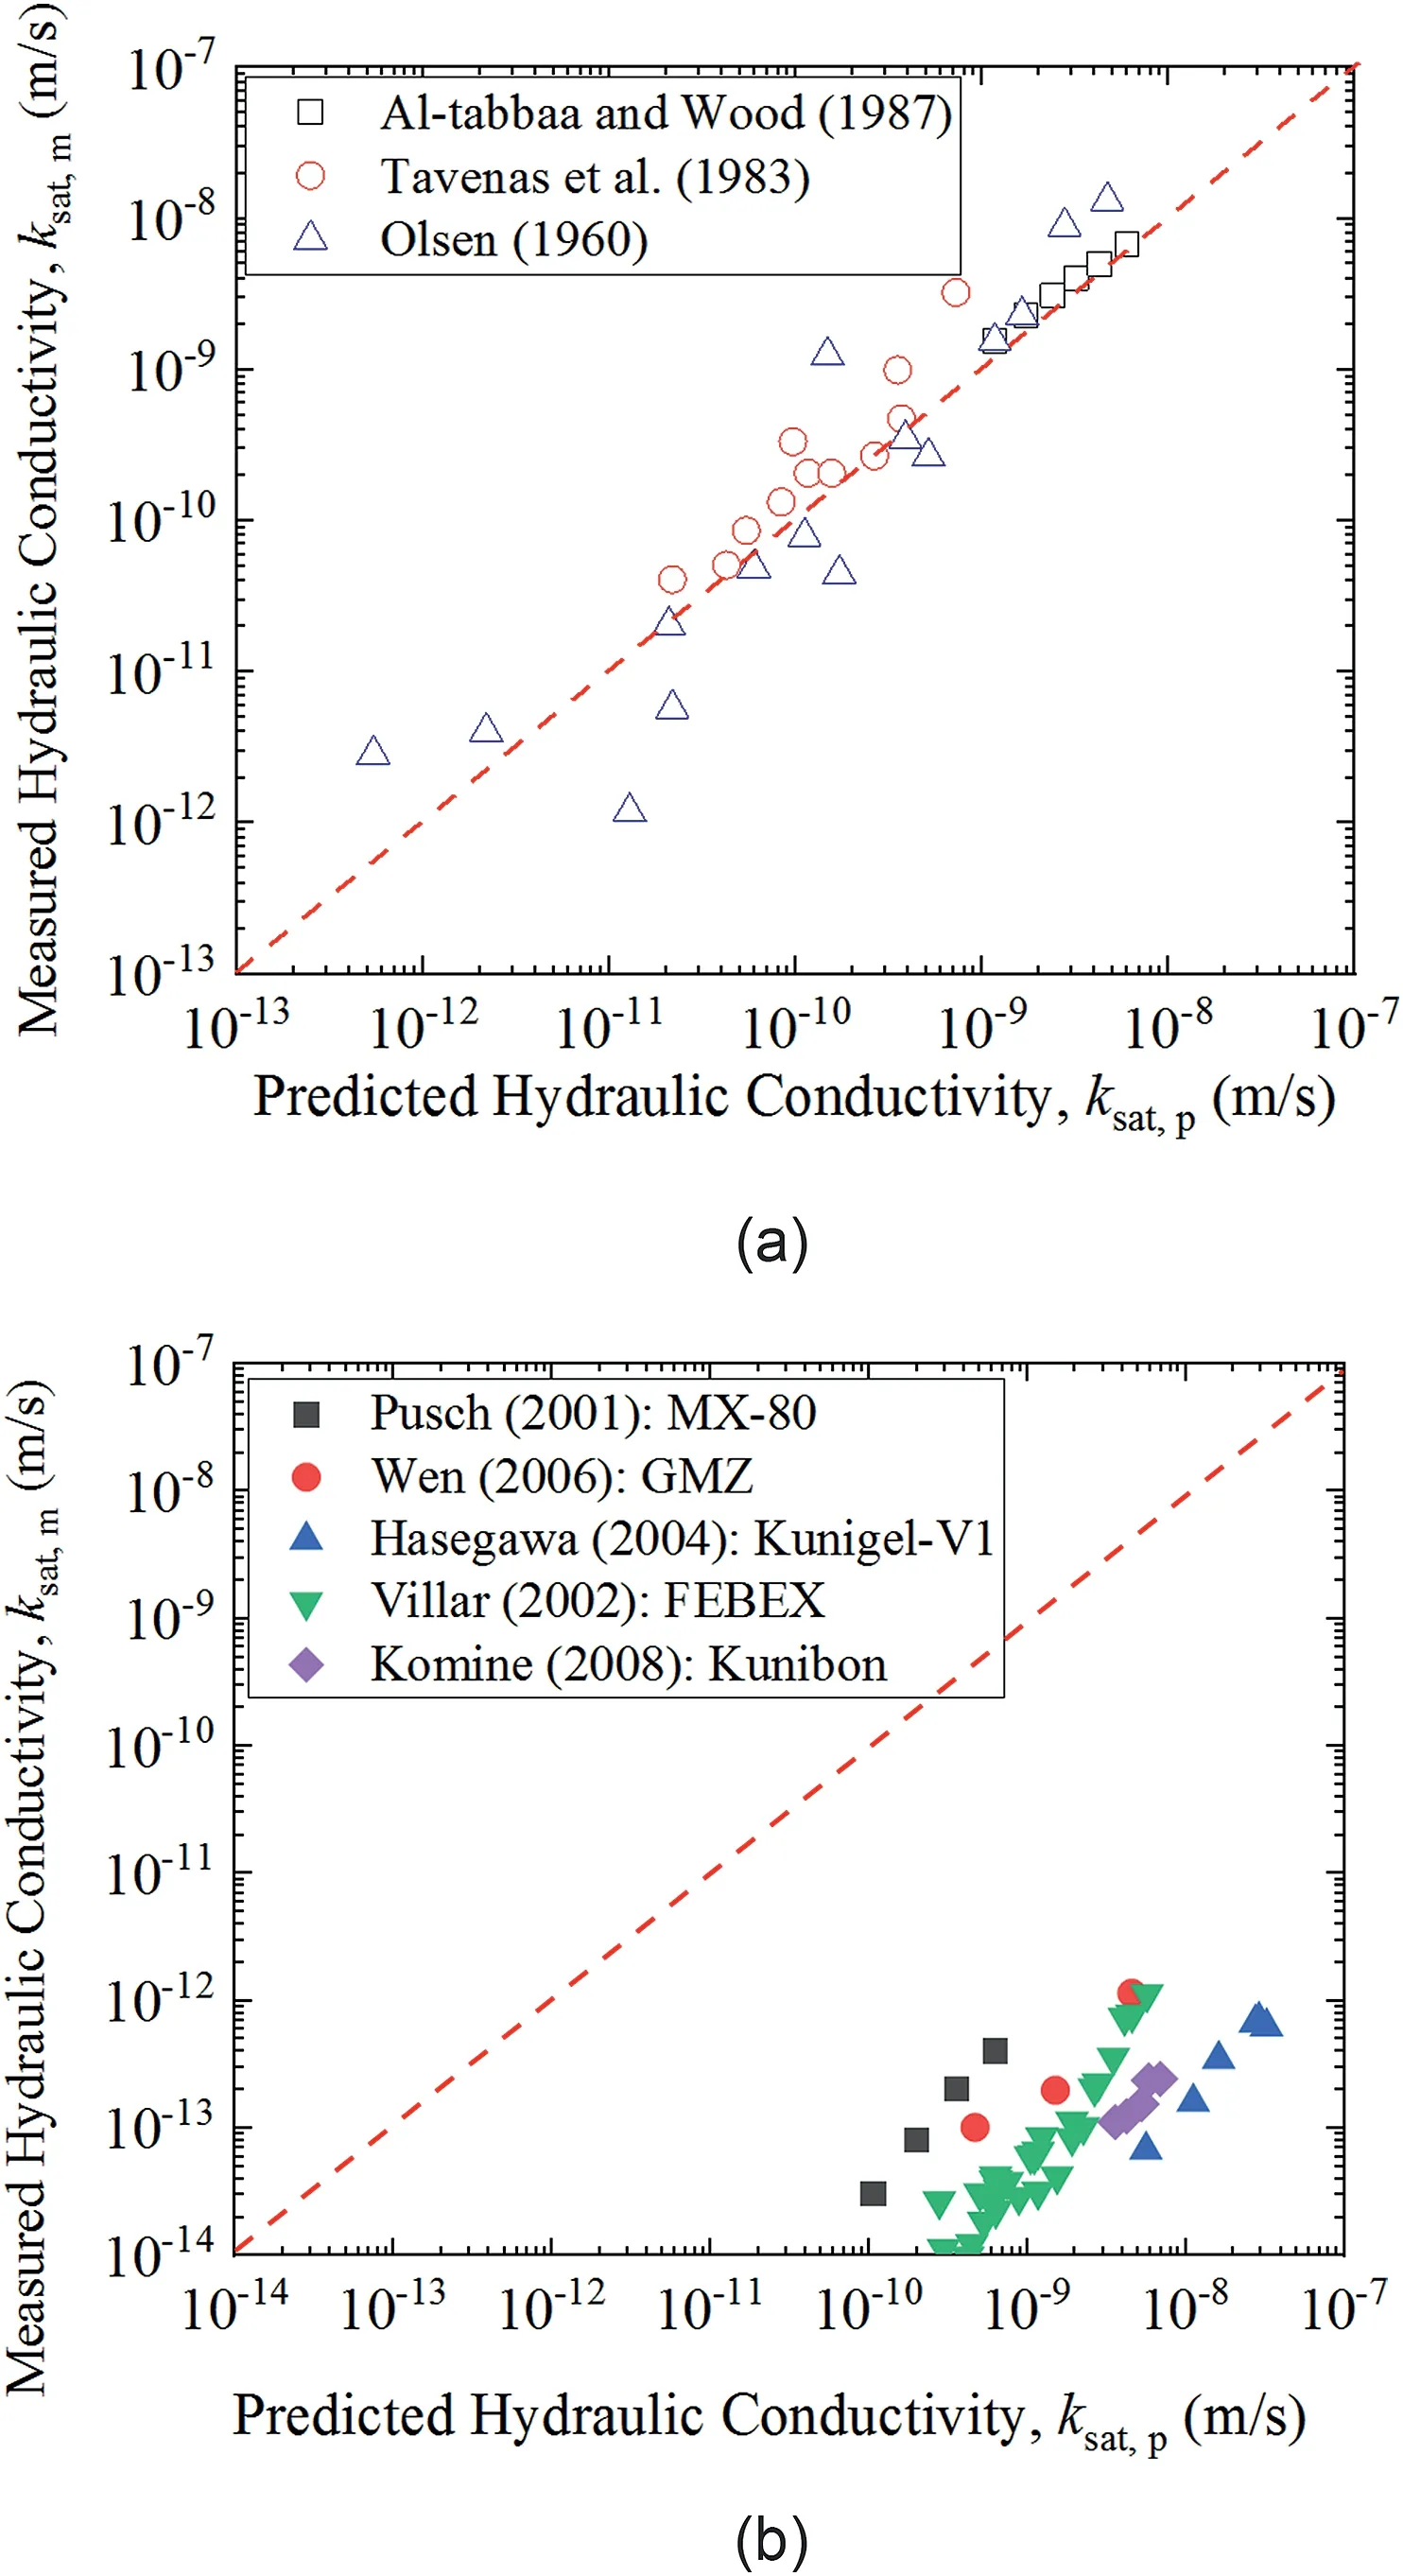
Fig.2. Comparisons between testing results for different soils and prediction using KC equation: (a) non-expansive soils (Olsen, 1960; Tavenas et al., 1983; Al-Tabbaa and Wood, 1987) and (b) bentonites (Push, 2001; Villar, 2002; Hasegawa, 2004; Wen,2006; Komine, 2008).
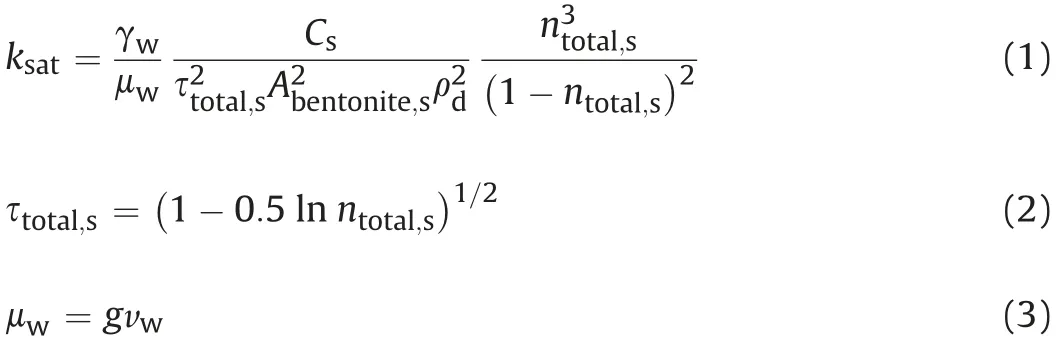
where ρdis the dry density of a specimen(g/cm3),γwrepresents the unit weight of water (N/m3, γw=gρw),gis the gravitational constant(m/s2),vwsignifies the kinematic viscosity of water(m2/s),Csis a dimensionless shape constant recommended as 0.2 for soils(Chapuis and Aubertin,2003b),τtotal,sis the saturated tortuosity of total pores, andAbentoniteis the specific surface area of bentonite.However, for smectite-rich clays, the KC equation is not well applicable(see Fig.2b). Therefore,it is necessary to modify the KC equation to predict hydraulic conductivity of expansive soils (e.g.compacted bentonite) better.
In this study, water categorized by their location in compacted bentonite is known to be:(1)water in inter-layer pore(inter-layer water), (2) water in inter-aggregate pore (inter-aggregate water),and (3) water in intra-aggregate pore (intra-aggregate water). The inter-layer water results from the hydration of exchangeable cations in montmorillonite layers (Cases et al., 1992). Since isomorphous substitutions of divalent cations for aluminum ion (Al3+) in the octahedral sheet and Al3+for silicon ion(Si4+)in the tetrahedral sheet (Liu, 2013), the unit layer is always negative charged. After soil encounters water,the negative surface charge will attract water molecules orderly arranged on the surface of crystal layers(Olphen,1977; Suzuki et al., 2005). The inter-layer water is viewed as immobile due to the attractive force between water molecule and unit layers (Bradbury and Baeyens, 2003; Pusch and Yong, 2006).Thus, inter-layer pore has a negligible contribution to the overall flow of water in compacted bentonite(Pusch and Yong,2006;Chen et al.,2020).Water in inter-aggregate pores can be divided into free water and DDL water(Appelo and Wersin,2007;Tachi et al.,2014).DDL water, which is partially constrained due to the interactions with charged surfaces, has much larger mobility than inter-layer water. Therefore, some researches viewed DDL water as mobile water(e.g.Chen et al.,2020).Intra-aggregate water is considered as moveable because the permeable tunnel between aggregates is considerable.
In this study, pore classification is followed as Likos and Lu(2006) and Sedighi and Thomas (2014) that micropore is defined as the inter-layer pore and macropore is defined as the pores excluding inter-layer pore. Combining the different water types mentioned above, the flow mechanism by pore size in this study can be concluded that macropore is the flow path for moveable water.
Most reports assumed unit layers as parallel coincidence sheets and moveable water flow path, as shown in Fig. 3a. Wang et al.(2021a) investigated the structure of montmorillonite via cryoscanning electron microscopy (cryo-SEM) and atomic force microscope (AFM). They indicated that the montmorillonite could move laterally during saturation process (see Figs. 3b and 4).Similar phenomenon was reported by Tournassat et al.(2003)and Cadene et al. (2005). Montmorillonite surface overlapping occurs due to the horizontal movement of unit layers.Therefore,new flow path for moveable water in compacted bentonite was adopted in this study, as shown in Fig.3b.
Following aforementioned discussion, this study replacedntotal,sin conventional KC equation withnmacro,s(saturated macroporosity),and τtotal,swas replaced by τmacro,s(tortuosity of saturated macropore)as modified KC equation:

3. Micro and macropores with changeable specific surface area
3.1. Evaluation of specific surface areas and surface areas during saturation
Unit montmorillonite layers will interact with each other to form stacked layers, which are referred as crystal particle, due to the repulsion and attraction during hydration(see Fig.4)(Liu,2013;Chen et al., 2020). In the process of forming particles, individual unit layers will be arranged horizontally and parallel to each other,but they may not completely overlap in the vertical direction, as shown in Fig.4(Tournassat et al.,2011;Holmboe et al.,2012;Leao and Tuller,2014;Tachi and Yotsuji,2014;Lu and Zhang,2020).This phenomenon was also observed by other technologies such as cryo-SEM and AFM (Dor et al., 2020; Wang et al.,2021a). As pointed by numerous studies (see Fig. 4), the specific surface areas of montmorillonite can be given as

Fig.3. Schematic diagram showing moveable water flow paths with different specific surface areas:(a)unchangeable specific surface area and(b)changeable specific surface area(adopted in this study).
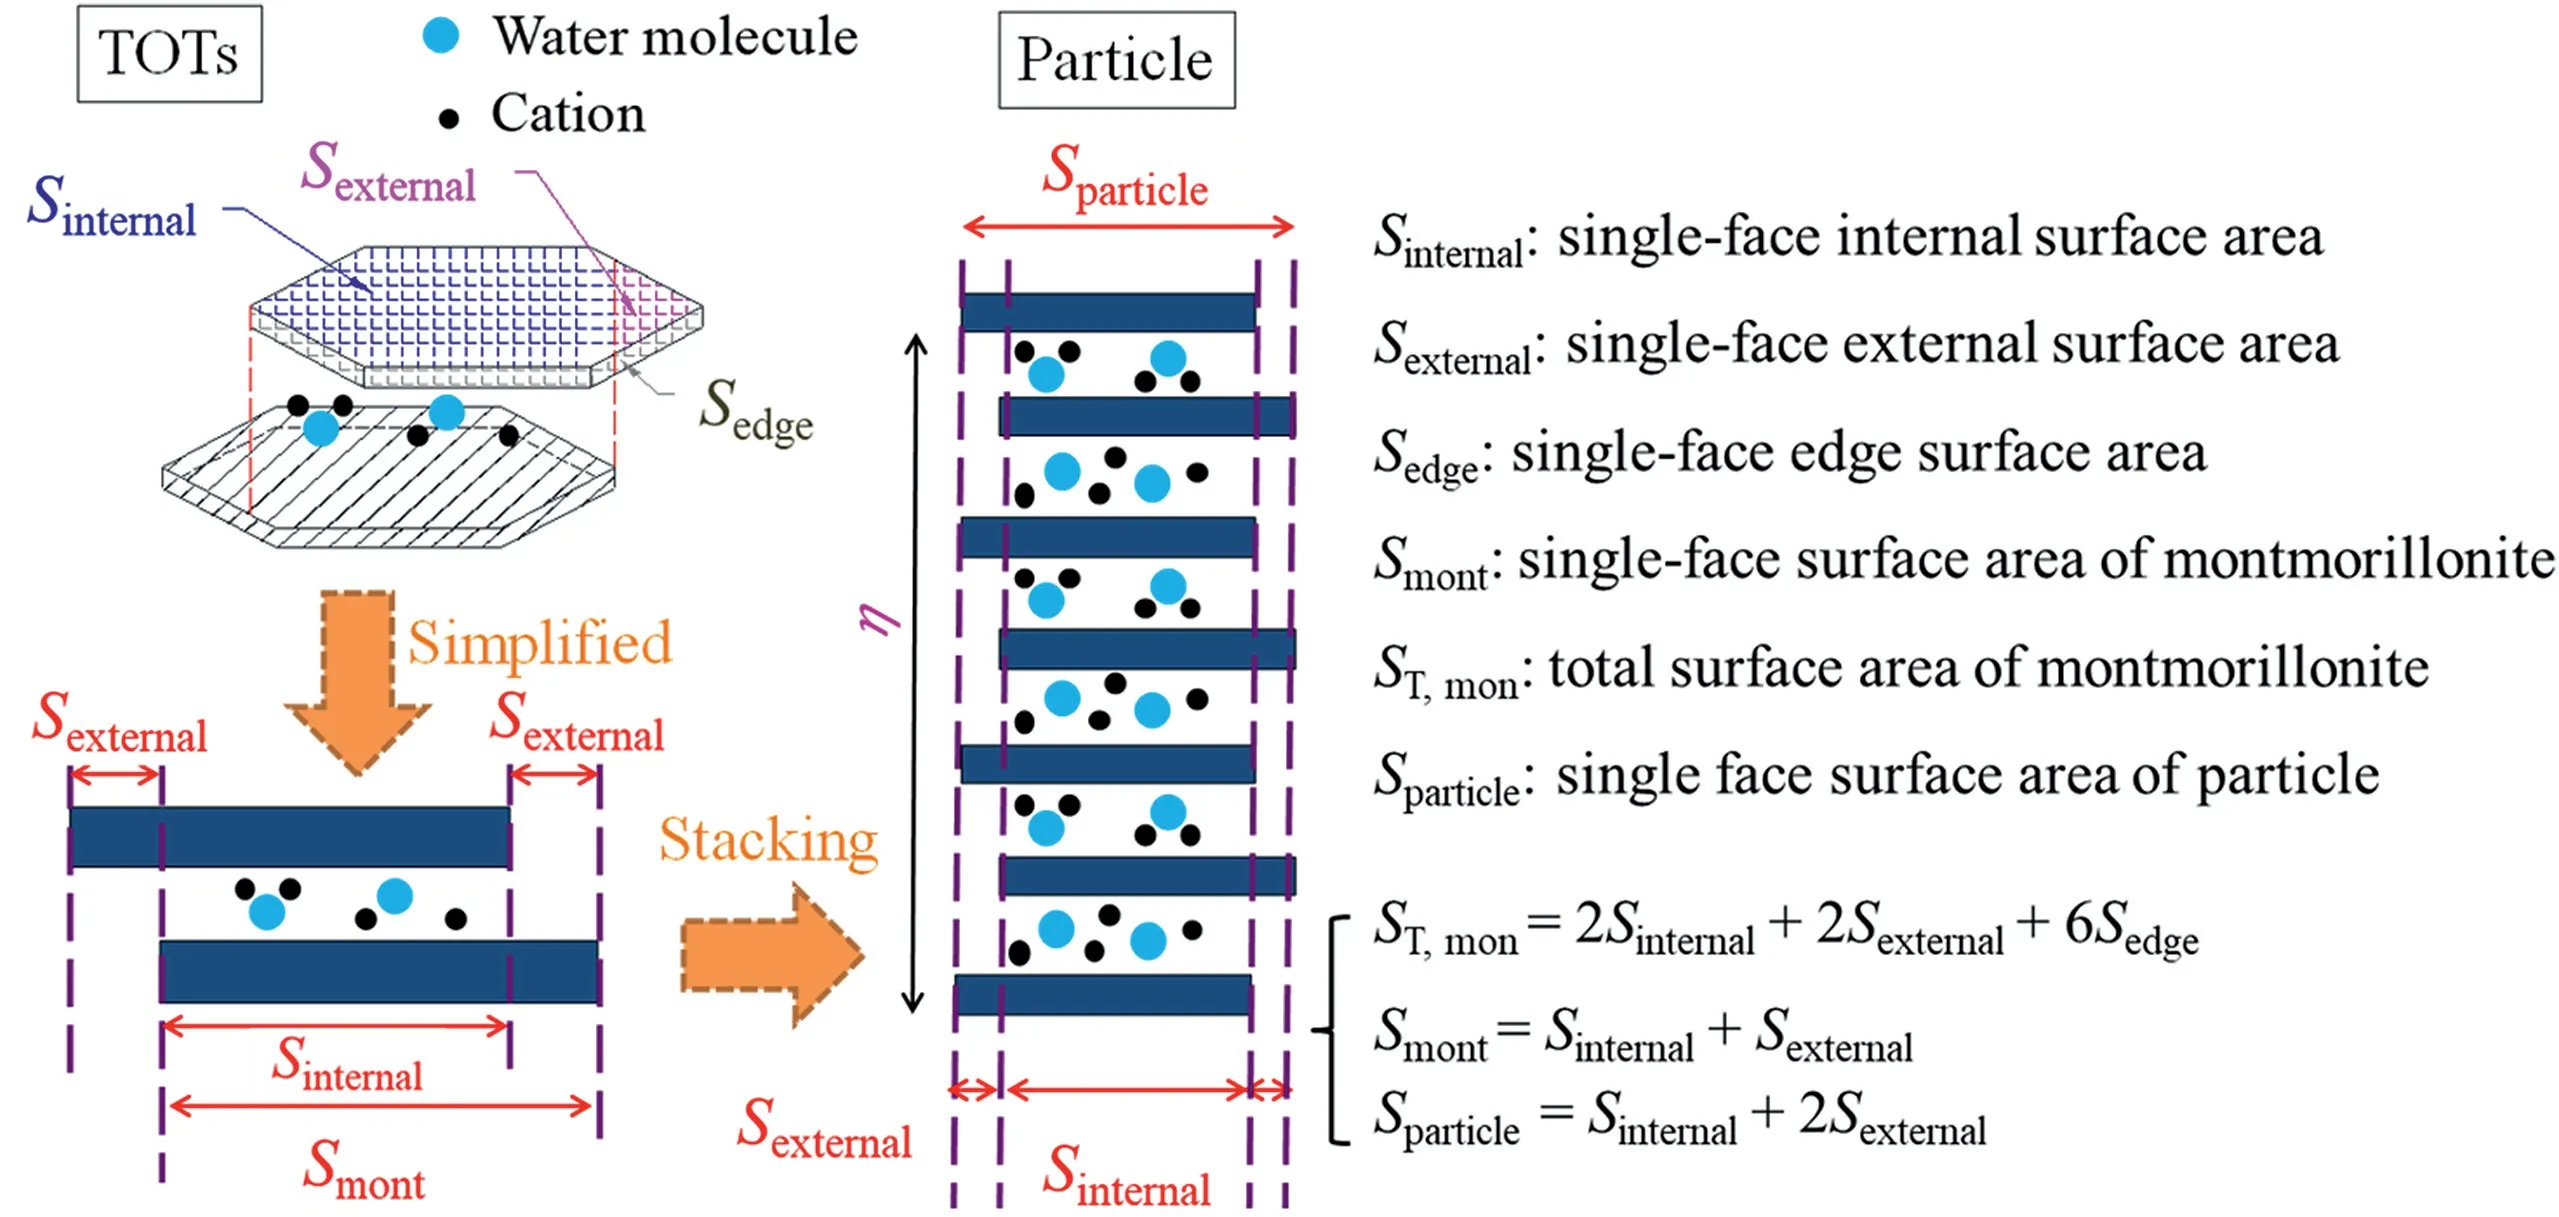
Fig. 4. Schematic diagram showing evaluation of surface area during saturation.
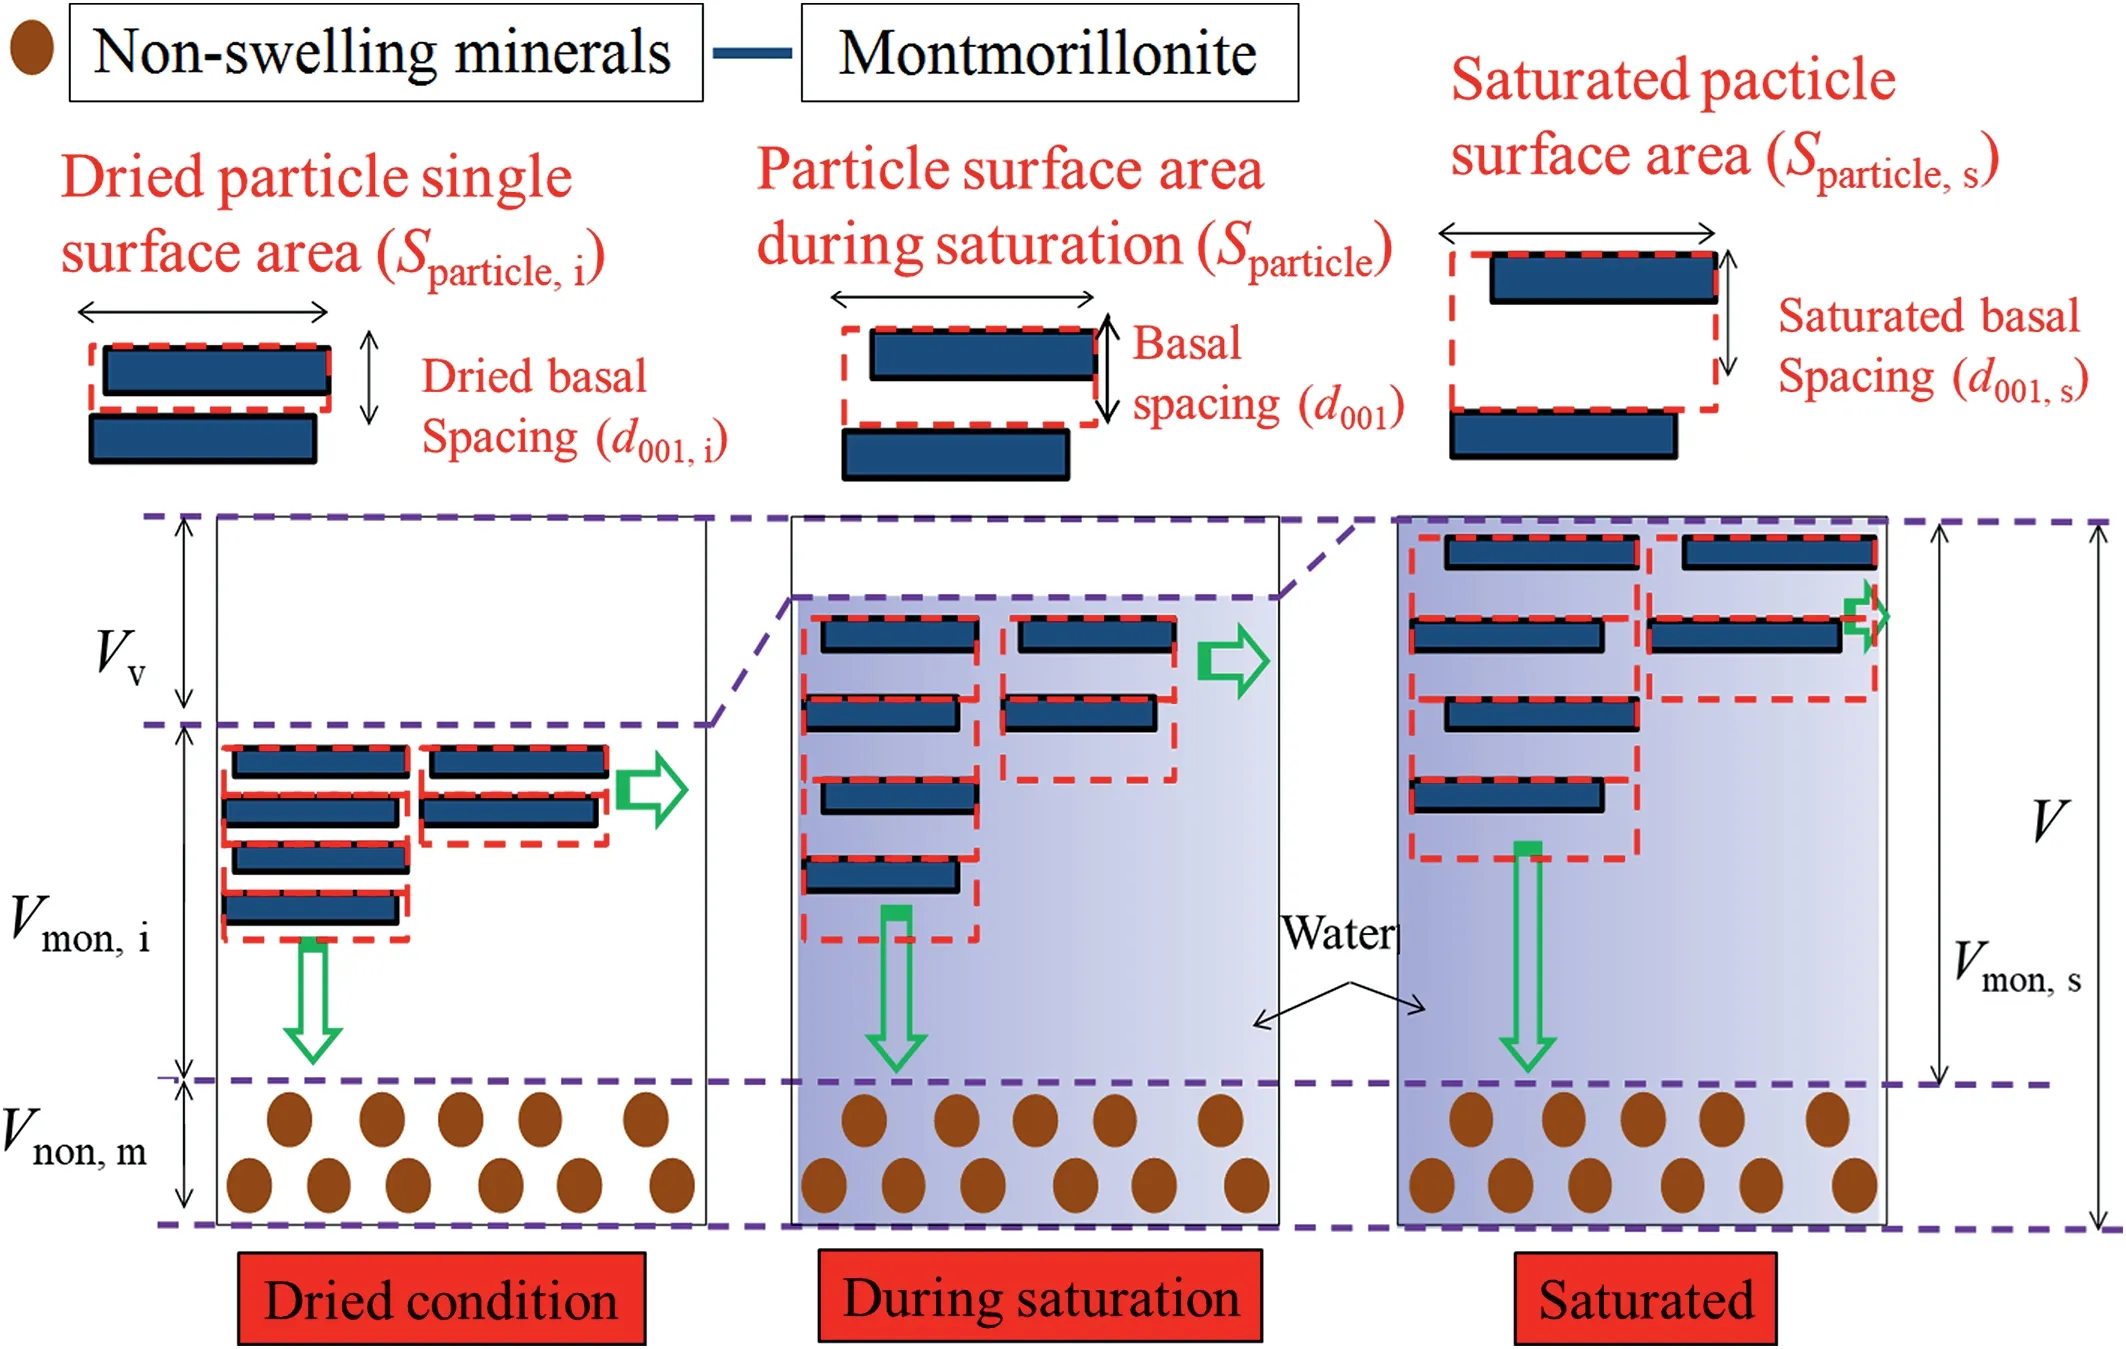
Fig. 5. Schematic diagram of basal spacing evaluation during saturation.

whereAmontis the specific surface area of montmorillonite, which can be obtained using ethylene glycol monoethyl ether technique(EGME);Aexternalis the external specific surface area of montmorillonite, which can be obtained using gas sorption test;Aexternalis the internal specific surface area of montmorillonite; andAedgeis the edge specific surface area of montmorillonite, which can be observed by AFM.Aedgeis usually ignored because it is 1%-5% ofAmont(Tournassat et al.,2003;Cadene et al.,2005).Thus,Eq.(6)can be re-expressed as

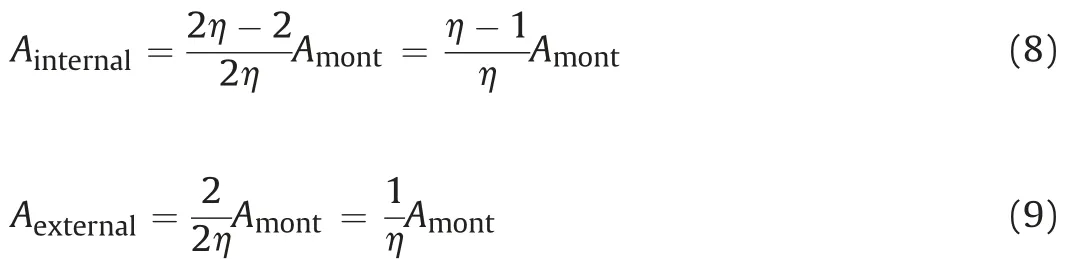
As pointed by some studies(Tournassat et al.,2011;Chen et al.,2020), there are relations between specific areas and stacked unit layer number (η) as Eqs. (8) and (9). The number of stacked unit layers (η) would change with the degree of saturation (Saiyouri et al., 2004).
An S-shape relation was found between total suction (ψ) and stacked numbers(η)for sodium-and calcium-type bentonites(Naand Ca-bentonite)by Chen et al.(2020)based on the experimental results from Saiyouri et al. (2004), and it could be fitted as

where ηmaxand ηminare the stacked numbers of dried and saturated specimens, respectively; andzis the fitting parameter. As reported by Chen et al. (2020), for Na-bentonite, ηmax= 350,ηmin= 10, andz= -0.17; for Ca-bentonite,ηmax= 100,ηmin= 10,andz= -0.14. Moreover, specific surface area of bentonite can be calculated following Komine and Ogata (1996, 2004):

whereAnon,mis the specific surface area of non-montmorillonite(0 m2/g was adopted from Komine and Ogata (2004)), andCmis the montmorillonite content in bentonite. Meanwhile, it can be seen from Fig.4 that the relations between single-face surface areas can be given as Eq.(12)by assuming the unit montmorillonite layer as an octahedron.
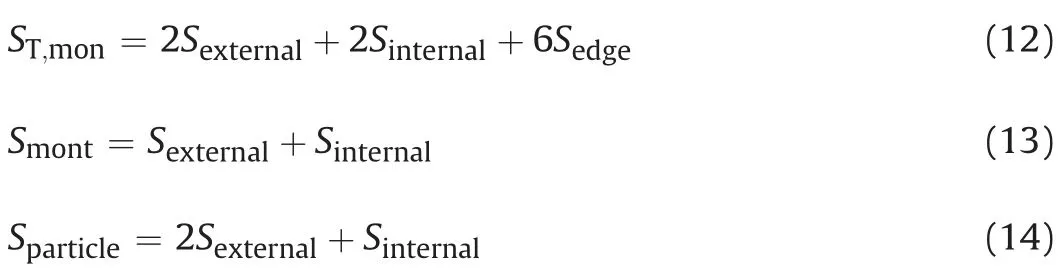
whereSinternal,Sexternal, andSedgeare the single-face internal,external,and edge surface areas of montmorillonite unit layer(m2),respectively;SmontandST,monare the single-face and total surface areas of montmorillonite unit layer(m2),respectively;andSparticleis the single-face surface area of particle (m2). Single-face edge surface area is ignored in this study following the discussion about the edge specific surface area as mentioned above.Thus,Eq.(12)can be re-given as

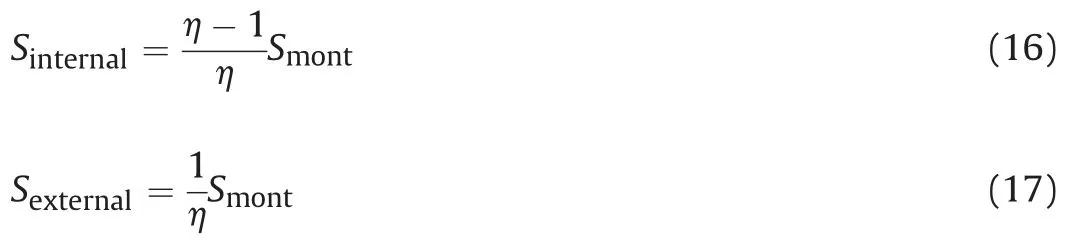
Additionally, as per the relations betweenAexternal,Ainternal, andAmontin Eqs. (8) and (9), the relations between single-face surface areas and stacked number can be expressed as
3.2. Determination of basal spacing in saturated state based on changeable specific surface area
For calculating the saturated basal spacing,it was assumed that the change of pore volume during saturation in confined condition is dominated by the volume change between unit layers(see Fig.5).Thus, a relationship between saturated montmorillonite volume(Vmon,s) and initial montmorillonite volume in dried condition(Vmon,i) can be expressed as

whereSparticle,sis the saturated single-face surface area of particle,Sparticle,iis the initial single-face surface area of particle in dried condition,d001,sis the saturated basal spacing,d001,iis the initial basal spacing in dried condition(9.8 Å for this study),andmis the total number of unit layer in bentonite. The relationship betweenVmon,sand initialVmon,ican also be formed as
whereVnon,mandVare the non-montmorillonite and total volumes in compacted bentonite, respectively;msis the total dry mass of bentonite; and ρmonand ρnon,mare the dry densities of montmorillonite and non-montmorillonite,respectively(ρmon=ρnon,m=2.8 g/cm3for this study,from Holmboe et al.(2012)).Combining Eqs.(18)and(19),a new relation can be obtained as
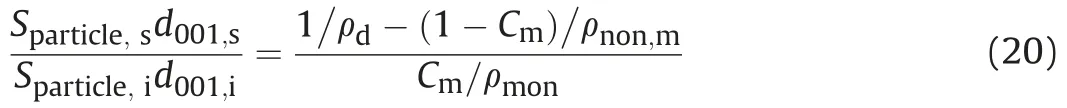
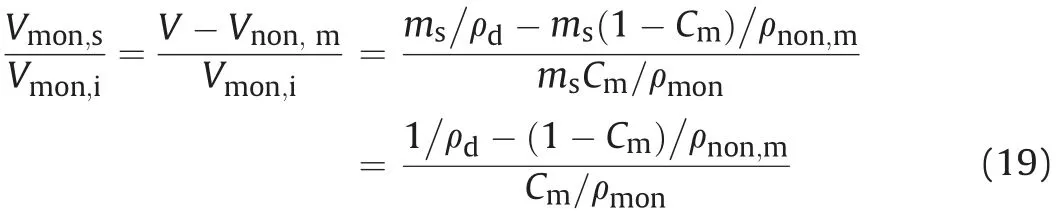
Therefore,saturated basal spacing(d001,s)can be easily formed:
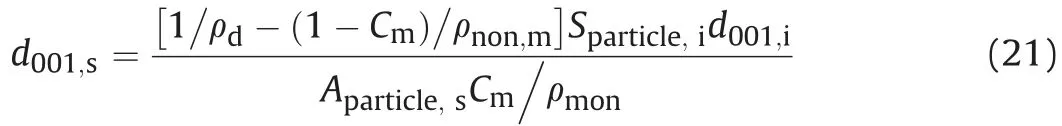
Fig.6 shows calculated saturated basal spacings of MX-80,GMZ,Kunigel-V1,Kunibon,and FEBEX bentonites as per Eq.(21).Detailed physical properties of these five bentonites in the literature are summarized in Table 1. MX-80, GMZ, and Kunigel-V1 are Nabentonites; Kunibon is Ca-bentonite; and FEBEX is considered as Ca-Mg-bentonite(Villar,2002;Villar et al.,2012).However,FEBEX was viewed as Ca-bentonite in this study because its Ca exchangeable capacity was higher than that of Mg(see Table 1).As shown in Fig.6,saturated basal spacing decreased with increasing dry density of bentonite.This phenomenon was consistent with the results obtained by Villar et al.(2012)and Pusch and Yong(2006).The comparison between saturated MX-80 basal spacings calculated using Eq.(21)and experimental results obtained by Holmboe et al.(2012)is indicated in Fig.7.It can be seen that Eq.(21)fits well with experimental results in high dry density(>1.5 g/cm3).For low dry density, the prediction is somewhat higher, which may be attributed to osmotic swelling between particles that leads to the pore volume change in compacted specimen.
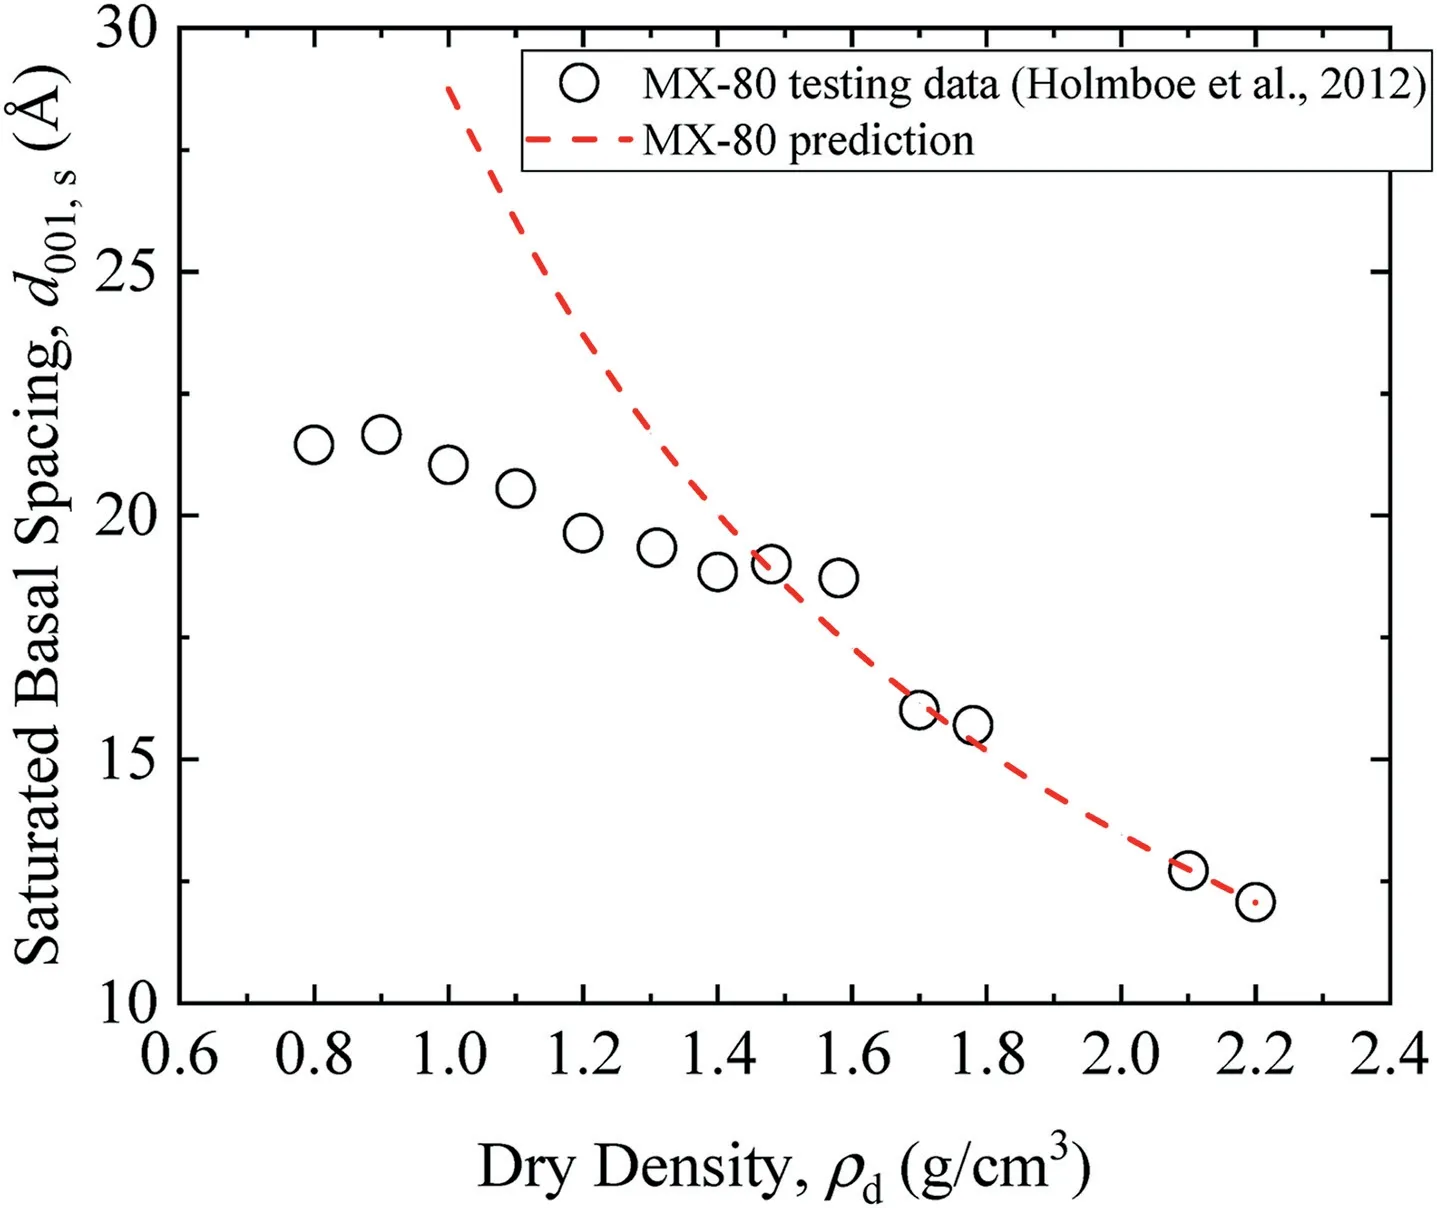
Fig. 7. Predicted basal spacings of MX-80 in saturated state in this study versus experimental results (Holmboe et al., 2012).
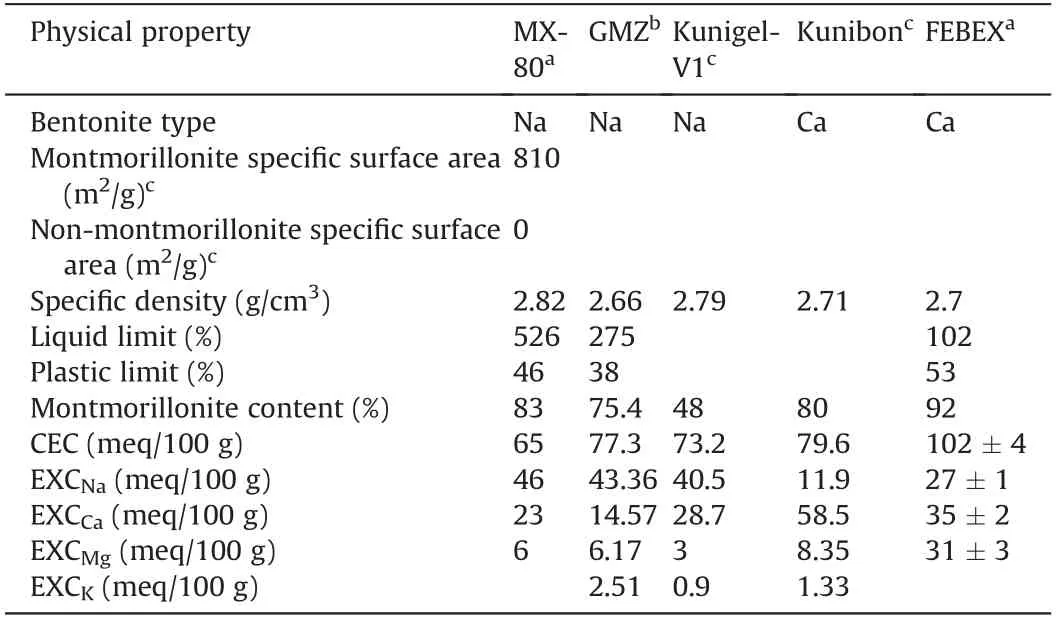
Table 1 Physical properties of bentonites.
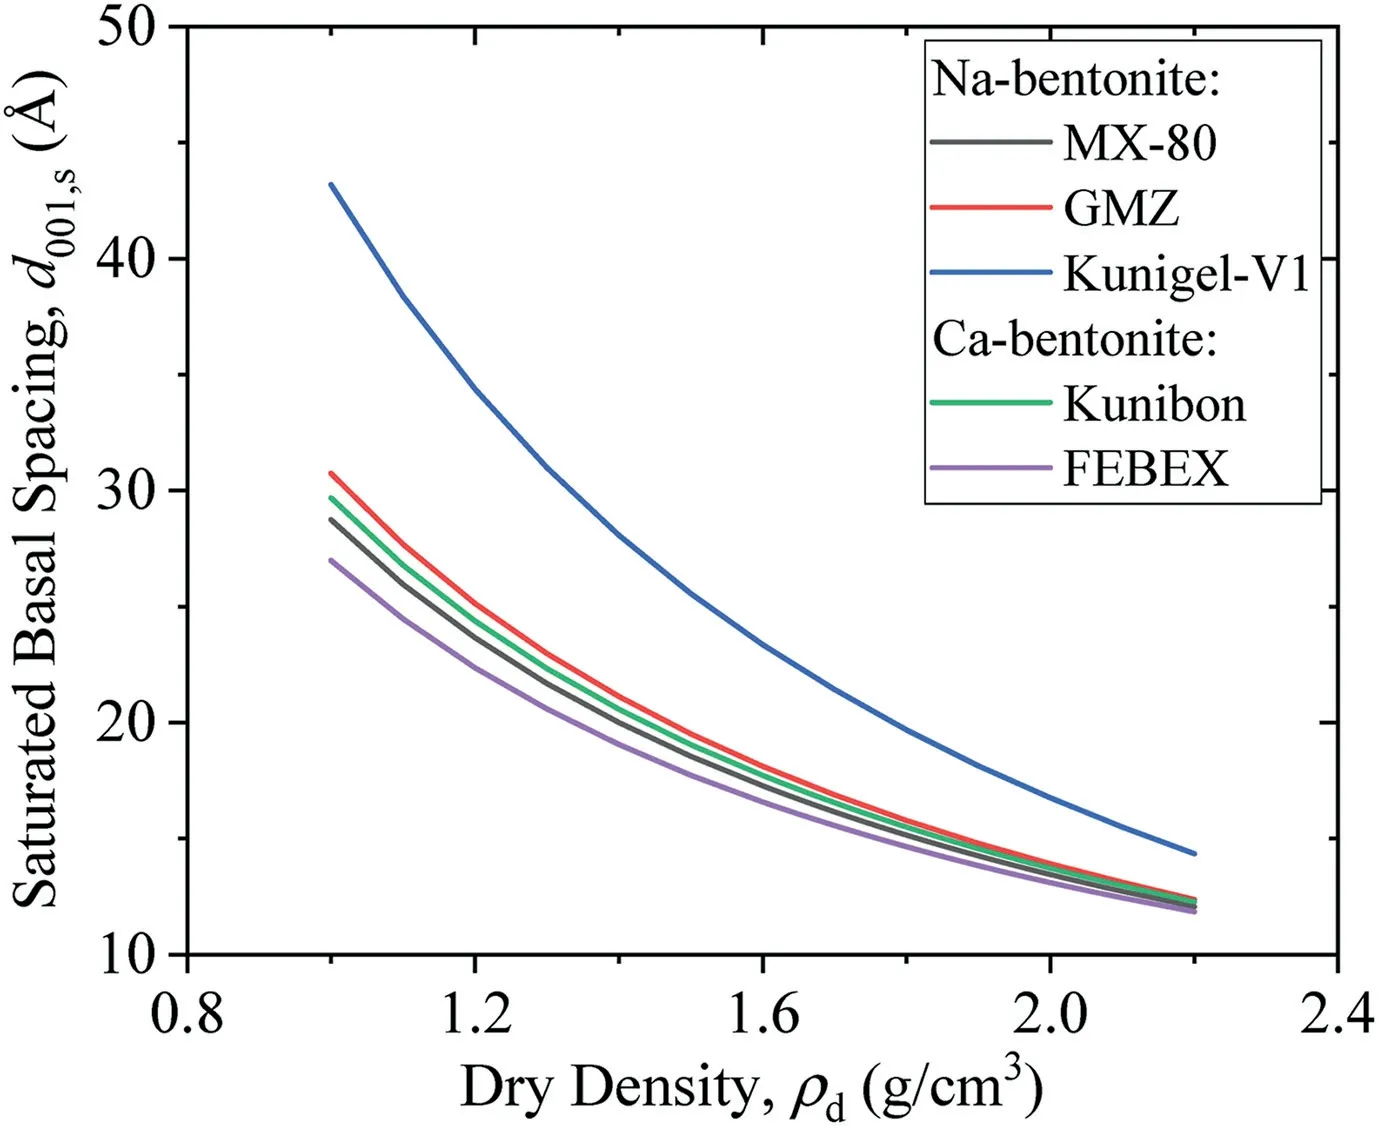
Fig. 6. Predicted basal spacings of bentonites in saturated state in this study.
3.3. Calculation for microporosity and macroporosity
Montmorillonite microporosity (nmonmicro) can be expressed as

whereVilandVmonare the inter-layer and montmorillonite volumes, respectively.
Saturated montmorillonite microporosity (nmonmicro,s) can be expressed as
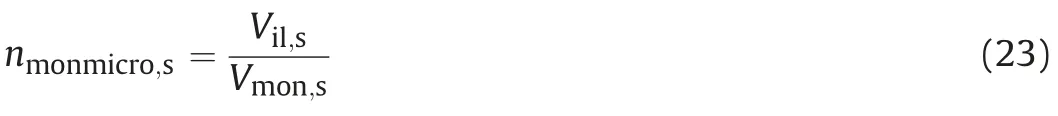
whereVil,sandVmon,sare the saturated inter-layer and montmorillonite volumes, respectively.
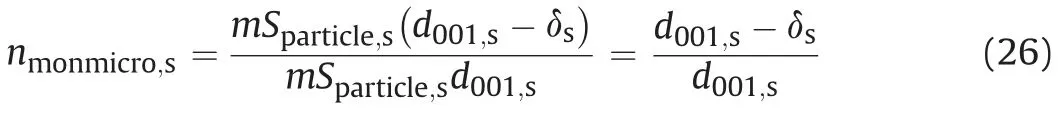
As shown in Fig.8,saturated inter-layer volume can be given as

where δsis the thickness of unit layer (9.6 Å for this study from Komine and Ogata(2004)).Saturated montmorillonite volume can be presented by

Combining Eqs. 22-25, saturated montmorillonite microporosity (nmonmicro,s) can be formed:
The equation for calculating saturated bentonite microporosity can be inspired by Eq. (11) as

wherennonmicro,sis the saturated non-montmorillonite microporosity (nnonmicro,s= 0 for this study). Saturated bentonite macroporosity (nmacro,s) can be calculated from total saturated porosity(ntotal,s):
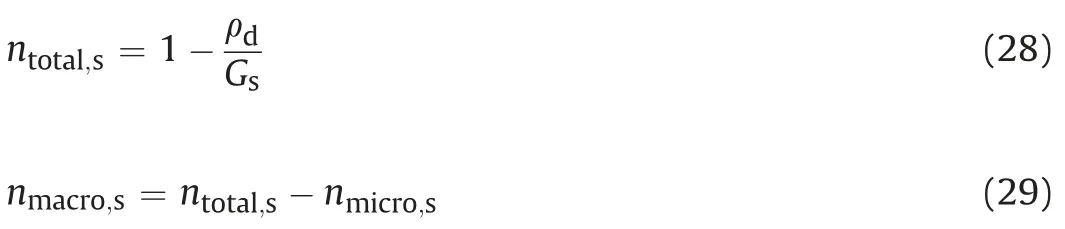
whereGsis the specific gravity.
Saturated bentonite microporosity and macropososity changing with dry density are presented in Fig. 9. It can be seen that the saturated microporosity and macropososity decrease with increasing dry density.
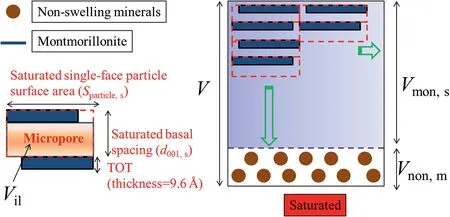
Fig. 8. Schematic diagram showing the calculation of microporosity in saturated state.
4. Verification of modified KC equation
Fig. 10 indicates saturated hydraulic conductivity of MX-80(Pusch, 2001; Karnland et al., 2008; Komine, 2021), GMZ (Wen,2006; Zhu et al., 2013; Wang et al., 2021b), Kunigel-V1(Hasegawa, 2004; Komine, 2008; Satamatsu, 2021), FEBEX (Villar,2002), and Kunibon (Komine, 2008) bentonites. Among the results in the literature, the hydraulic conductivities of most bentonites were measured based on falling head method with different apparatus,expect for Komine(2008,2021)who obtained hydraulic conductivities as per Terzaghi one-dimensional consolidation theory. Predicted saturated hydraulic conductivity calculated using conventional KC equation and modified KC equation are presented in Fig. 10. As shown in Fig. 10, predicted values using modified KC equation fit much better with experimental results compared with those of conventional KC equation, especially for MX-80, GMZ, and FEBEX bentonites.
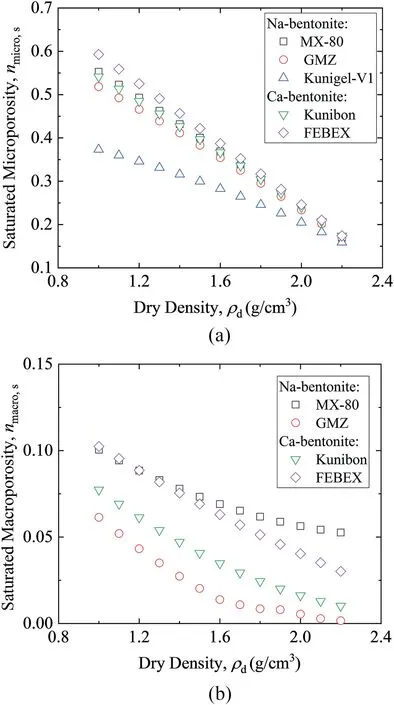
Fig. 9. Saturated (a) microporosity and (b) macropososity for different bentonites.
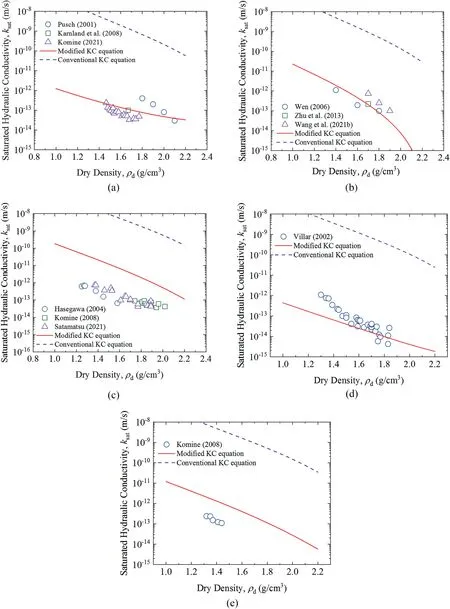
Fig.10. Predicted saturated hydraulic conductivities of(a)MX-80,(b)GMZ,(c)Kunigel-V1,(d)FEBEX,and(e)Kunibon using conventional KC and modified KC equations changing with dry density from the literature (Push, 2001; Villar, 2002; Hasegawa, 2004; Wen, 2006; Karnland et al., 2008; Komine, 2008, 2021; Zhu et al., 2013; Wang et al., 2021b;Satamatsu, 2021).
Based on modified DDL theory, Komine (2008) proposed a prediction method for saturated hydraulic conductivity of bentonite, which inferred water paths through the distance between two parallel plants by assuming that flow velocity of water between montmorillonite controls the flow velocity of water in bentonite. Meanwhile, it was supposed that water flow is twodimensional and water is incompressible. The equation by Komine (2008) can be given as
whereksat,iis the hydraulic conductivity of exchangeable cationi,EXCiis the exchange capacity of the exchangeable cationi,and CEC is the cation exchange capacity of bentonite.
Fig.11 reveals the predicted saturated hydraulic conductivity using the modified KC equation and prediction method based on DDL theory from Komine(2008).As we can see from Fig.11a,for MX-80 bentonite,DDL theory performs better for the results from Komine (2021).Modified KC equation in this study fits better with the results from Pusch(2001)and Karnland et al.(2008).For GMZ bentonite,it can be easilyconcludedfromFig.11bthatmodifiedKCpredictionisclosertoall testing data than DDL theory.For FEBEX bentonite in Fig.11c,in the case of low dry density, modified KC equation performs better than DDL theory.For thehighdrydensity(>1.5g/cm3),bothtwomethodspredict the hydraulic conductivity well.
5. Conclusions
Conventional KC equation cannot predict saturated hydraulic conductivity of bentonite well.A double pore system(i.e.micro and macropores)was raised after discussing water flow mechanisms in bentonite. It was assumed that macropore is the flow path for moveable water. Macroporosity and tortuosity of macropore were introduced into conventional KC equation to propose a modified KC equation.Basal spacing was estimated by assuming that the change of pore volume during saturation in confined condition is only controlled by the volume change between unit layers.Macroporosity and microporosity were obtained from basal spacing and changeable specific surface.
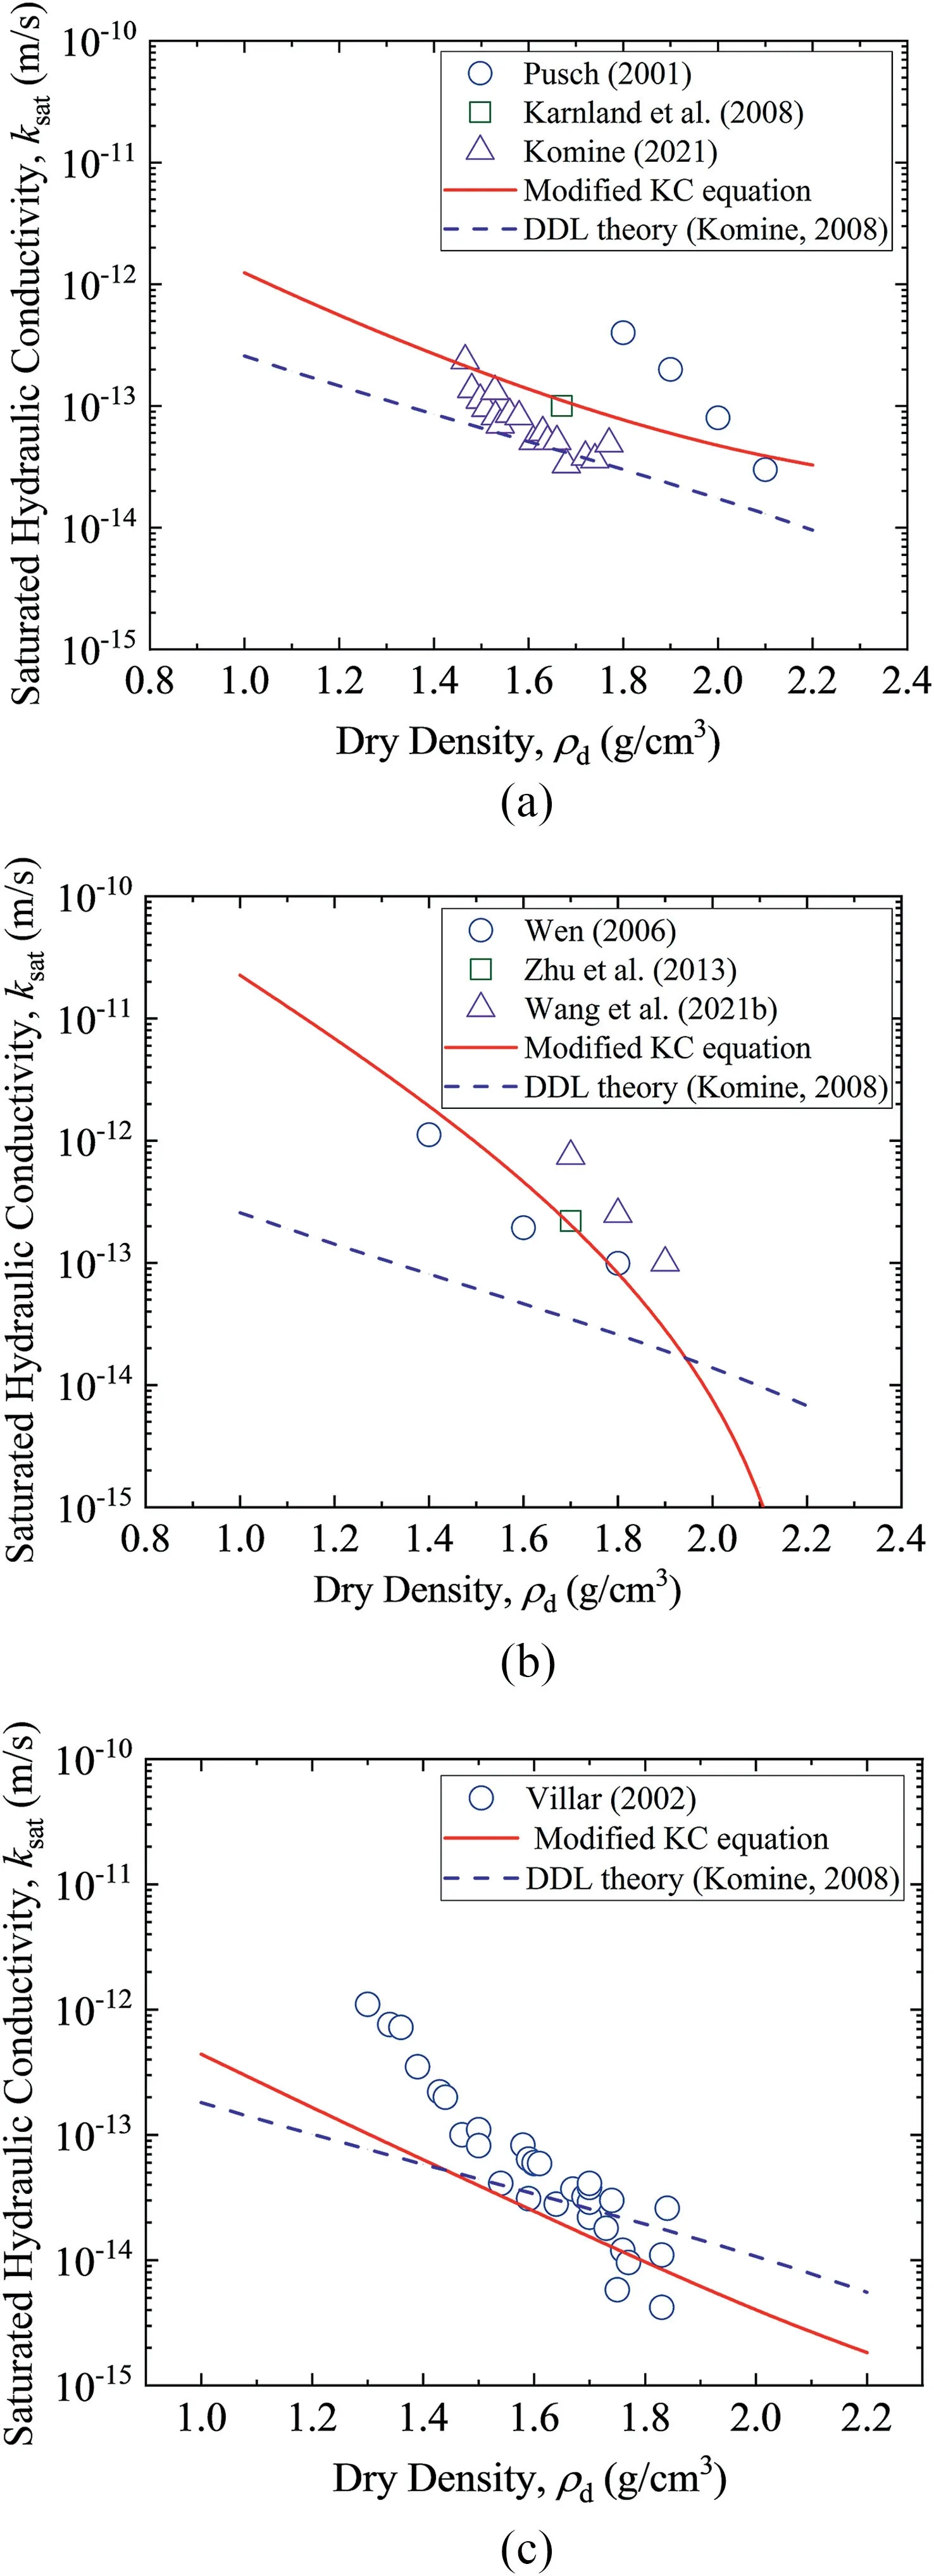
Fig.11. Predicted saturated hydraulic conductivities by the modified KC equation and DDL theory for (a) MX-80, (b) GMZ, and (c) FEBEX (Push, 2001; Villar, 2002; Wen,2006;Karnland et al.,2008;Komine,2008,2021;Zhu et al.,2013;Wang et al.,2021b).
Saturated hydraulic conductivities of five bentonites (Na-type:MX-80, GMZ and Kunigel-V1; Ca-type: Kunibon and FEBEX)reported in previous studies were used to verify the accuracy of modified KC equation.Results showed that the predicted saturated hydraulic conductivities of bentonites calculated using modified KC equation fitted the experimental data better than those calculated using conventional KC equation and prediction method based on DDL theory to a certain extent.
Declaration of competing interest
The authors declare that they have no known competing financial interests or personal relationships that could have appeared to influence the work reported in this paper.
Acknowledgments
We acknowledge the support from the Ministry of Economy,Trade, and Industry (METI) of Japan and funding support from Postgraduate Research & Practice Innovation Program of Jiangsu Province, China (Grant No.KYCX21_0122).
List of symbols
Anon,mSpecific surface area of non-montmorillonite
AmontSpecific surface area of montmorillonite
AexternalExternal specific surface area of montmorillonite
AinternalInternal specific surface area of montmorillonite
AedgeEdge specific surface area of montmorillonite
SinternalSingle-face internal surface area of montmorillonite unit layer
SexternalSingle-face external surface area of montmorillonite unit layer
SedgeSingle-face edge surface area of montmorillonite unit layer
SmontSingle-face surface area of montmorillonite unit layer
ST,monTotal surface area of montmorillonite unit layer
SparticleSingle-face surface area of particle
d001,sBasal spacing of saturated specimen
d001,iBasal spacing of dried specimen
CmMontmorillonite content in bentonite
ksatSaturated hydraulic conductivity
ksat,mMeasured saturated hydraulic conductivity
ksat,pPredicted saturated hydraulic conductivity
mTotal number of unit layer in bentonite
ntotal,sBentonite saturated total porosity
nmacro,sSaturated bentonite macroporosity
nmicro,sSaturated bentonite microporosity
nnonmicro,sSaturated non-montmorillonite microporosity
nmonmicroMontmorillonite microporosity
nmonmicro,sSaturated montmorillonite microporosity
VTotal volume of bentonite
VmMontmorillonite volume
Vnon,mNon-montmorillonite volume
Vmon,iMontmorillonite volume in dry condition
Vmon,sSaturated montmorillonite volume
VilInter-layer volume
Vil,sSaturated inter-layer volume
ρdDry densities of bentonite
ρmonDry densities of montmorillonite
ρnon,mDry densities of non-montmorillonite
δsThickness of unit layer
η Number of stacked unit layers
τtotal,sTortuosity of saturated total pores
τmacro,sTortuosity of saturated macropore
vwKinematic viscosity of water
 Journal of Rock Mechanics and Geotechnical Engineering2022年3期
- Journal of Rock Mechanics and Geotechnical Engineering的其它文章
- Editorial for Advances and applications of deep learning and soft computing in geotechnical underground engineering
- A review of methods, applications and limitations for incorporating fluid flow in the discrete element method
- Numerical modeling of contaminant advection impact on hydrodynamic diffusion in a deformable medium
- Geotechnical particle finite element method for modeling of soilstructure interaction under large deformation conditions
- Structural,volumetric and water retention behaviors of a compacted clay upon saline intrusion and freeze-thaw cycles
- Optimization of inter-helix spacing for helical piles in sand