
Optimization of inter-helix spacing for helical piles in sand
2022-08-24 16:58:30KngShoQinSuJunweiLiuKiwenLiuZhipengXiongTengfeiWng
Kng Sho, Qin Su, Junwei Liu, Kiwen Liu,c,*, Zhipeng Xiong, Tengfei Wng
a Key Laboratory of High-Speed Railway Engineering Ministry of Education, School of Civil Engineering, Southwest Jiaotong University, Chengdu, 610031, China
b School of Civil Engineering, Qingdao University of Technology, Qingdao, 266033, China
c Guangxi Communications Investment Group Co.Ltd, Nanning, 530022, China
Keywords:Helical pile Sand Analytical solution Cavity expansion theory Optimal inter-helix spacing
A B S T R A C T
1. Introduction
Piles are used to support various structures and have been widely used in geotechnical engineering. Many scholars have discussed the installation process (e.g. Yang et al., 2014; Liu et al.,2019a; Li et al., 2021a; Shao et al., 2021), load transfer (e.g. Ni et al., 2017; Liu et al., 2019b; Zhang et al., 2021a), and dynamic responses(e.g.Wu et al.,2020;Li et al.,2021b;Zhang et al.,2021b)of existing straight-shafted piles (SSP). In order to bear the load effectively, various special-shaped piles, such as tapered piles (e.g.El Naggar and Sakr, 2000; El Naggar and Wei, 2000; Bak et al.,2021), branch piles (e.g. Gao et al., 2007; Zhang et al., 2018), Xtype piles(e.g.Zhou et al.,2017;Ding et al.,2020),and Y-type piles(e.g. Lv et al., 2016), have been developed.
Helical piles,one kind of the special-shaped piles,have shown a rapid growth trend in the field of pile foundations in recent years.Helical piles are installed by rotating and pressing, which are composed of a central shaft(i.e.steel tube or solid rod)and one or more helices (i.e. steel tube or solid rod). Helical piles have been widely used in various industries(Clemence and Lutenegger,2015).The bearing capacity of helical piles is also an important research direction (e.g. Byrne and Houlsby, 2015; Houlsby, 2016; Schiavon et al., 2019). When the axial bearing capacity increases linearly with the increase of the helix number, the helices present an individual bearing mode (IBM) under the ultimate load. When the axial bearing capacity does not vary with the helix number, the helical pile exhibits a cylindrical shear mode (CSM) under the ultimate load (Fig. 1) (e.g. Perko, 2009; Elsherbiny and El Naggar,2013; Elkasabgy and El Naggar, 2015; Mohajeranin et al., 2016;Lanyi-Bennett and Deng, 2019). The critical parameter that determines its load-bearing mode is the inter-helix spacing (S) (e.g.Narasimha Rao et al.,1991;Narasimha Rao and Prasad,1993;Zhang,1999). The IBM considers that if the helix spacing is large enough,the bearing zones of the helices do not affect each other,and each helix works independently when the axial load of the pile top changes from small to large(Fig.1a).In the CSM,the helix spacing is small, the soil at the edge of the adjacent helix forms a cylindrical shear zone, and the pile top load increases gradually. A cylindrical shear soil column is formed between the top helix and the bottom helix (Fig.1b). In order to maximize the bearing capacity of each helix, the optimal inter-helix spacing is a challenging issue.
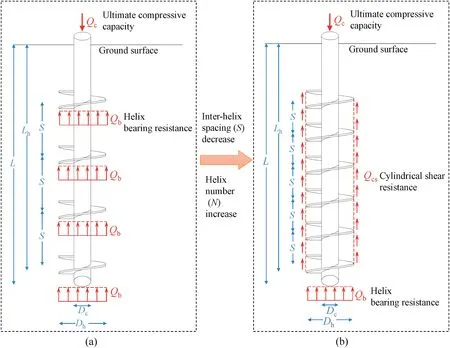
Fig.1. Failure modes of helical piles:(a)IBM and(b)CSM(modified from Lanyi-Bennett and Deng,2019)(Dc:central shaft diameter;Dh:helix diameter;L:Installation depth of pile;Lh: Installation depth of lower helix (≈L)).
The optimal inter-helix spacing (Sop) is essentially the basis to distinguish the IBM and the CSM. The optimal inter-helix spacing allows the helical pile to have the greatest bearing capacity and the lowest number of helices.Moreover,the optimal inter-helix spacing ratio (Sop/Dh) varies with soil properties (e.g. relative density,stress-related stiffness, and strength of sand) and pile depth (e.g.the installation depth of lower helix)(Lutenegger,2009).Generally,the optimal inter-helix spacing (Sop) is determined through laboratory tests (e.g. Bassett, 1978; Narasimha Rao and Prasad, 1993;Narasimha Rao et al.,1993),field tests(e.g.Zhang,1999;Tappenden,2007; Elkasabgy and El Naggar, 2015; Lanyi-Bennett and Deng,2019), and numerical simulations (e.g. Knappett et al., 2014;Rawat and Gupta,2017;Rawat et al.,2017;Al-Baghdadi,2018).It is reported that the optimal inter-helix spacing ratio (Sop/Dh) ranges from 1.5 to 5 (Perko, 2009).
The influence zone of the pile tip under axial compression load varies with the surrounding soil properties and stress state (Yang,2006). In the process of axial compression, the bearing characteristics of helix are similar to those of end-bearing piles, and the influence zone of the helix is also related to the sand type and surrounding soil stress level. Therefore, the optimal inter-helix spacing ratio obtained under different soil conditions and pile geometric parameters varies. Existing codes and manuals recommend that the optimal inter-helix spacing ratio is 3 (e.g. Seider,2004; CFEM, 2006), which does not consider the factors such as soil type,strength,and stress level surrounding the helical pile.For wide applications in practical cases, the optimal spacing and the bearing capacity of helical piles should be evaluated. For this, a practical evaluation method to determine the optimal inter-helix spacing is needed.
The Meyerhof pile foundation theory considers the sand strength,while the cavity expansion method considers the physicomechanical properties of sand.In this paper,based on the Meyerhof pile foundation theory and cavity expansion method,the upper and lower influence zones,and the optimal spacing between the spiral plates were evaluated. The variation of the upper and lower influence zones and the optimal spacing with sand strength, stiffness,fine content of sand and pile depth were analyzed. Furthermore,the applicability of abovementioned two methods for evaluation of the influence zone of the inter-helix under axial compressive load were compared and discussed. The evaluation method for the optimal inter-helix spacing based on the cavity expansion, was proposed and verified using the results of centrifugal model tests in Congleton HST95 sand (e.g. Lauder, 2010). In addition, the finite element model (FEM), with different relative densities (Dr= 30%,55%, and 80%) of Congleton HST95 sand and different pile depths(Lh=15 m, 30 m,and 50 m), was used to analyze the relationship between the bearing capacity of helical piles and helix spacing ratio(S/Dh).Finally,the FEM results are compared with the results of the proposed method in this paper.
2. Optimal inter-helix spacing
2.1. Meyerhof pile foundation theory
Meyerhof(1956,1976)believed that the influence zone of a pile tip is within ten times the pile diameter and mainly exists above the pile tip through experimental analysis. Similar conclusions were also verified by De Beer (1963).
Meyerhof (1951), DeBeer (1963), and Eslami and Fellenius(1997) suggested that in isotropic soils, a logarithmic spiral is assumed at the pile tip to define the failure zone,as shown in Fig.2.The soil in the wedge-shaped area below the pile tip is considered to be rigid,and the angle(α)between the wedge-shaped body and the plane of the pile tip is calculated by
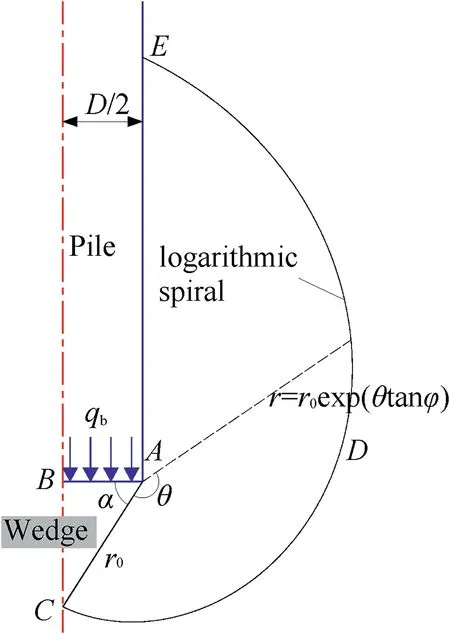
Fig. 2. Logarithmic spiral failure surface for pile tip (modified from Meyerhof,1951).

where φ is the friction angle of soil.
PointAat the pile end is the center of the logarithmic spiral line(Fig.2).The side length AC of the wedge is the initial radius(r0)of the logarithmic spiral failure surface,which extends to the distance AE above the pile end(Fig.2).The logarithmic spiral failure surfaceCDEis expressed as follows:

whereris the radius of the logarithmic spiral, and θ is the angle betweenrandr0(Fig. 2).
According to the Meyerhof pile foundation theory,it is assumed that a logarithmic spiral failure zone is formed below the helix of a helical pile subjected to the axial compression load. In order to analyze the size of influence zone between helices, a double-helix pile is used as an example (Fig. 3). Under axial compression load,a rigid wedgeA1B1C1(orA2B2C2) is formed below the upper (or lower) helix (Fig. 3). The failure surface extends from the wedge bottomC1(orC2) to the upper (or lower) helixE1(orE2), forming logarithmic spiral failure surfacesC1D1E1(orC2D2E2) (Fig. 3). It is noted that the installation depth of the helices is assumed to be large enough that the logarithmic spiral failure surface will not extend to the ground.
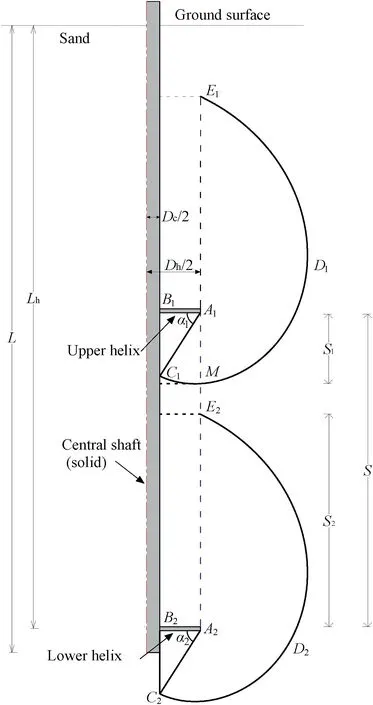
Fig. 3. The influencing zone of inter-helix for logarithmic spiral failure surface (e.g. a double-helix pile).
The influence zone below(or above)the upper(or lower)helix is defined as the upper(or lower)influence zoneS1(orS2)(Fig.3).The upper and lower influence zones jointly determine the appropriate spacing between helices. The intersection of the influence zonesS1andS2represents the mutual influence between the helices.The spacing between the helices is the optimal spacingSop:

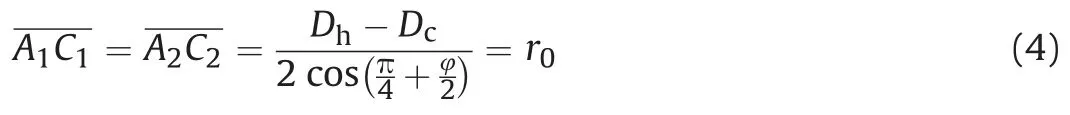
The angles between the rigid wedgeA1B1C1(orA2B2C2)and the upper (or lower) helix is α1(or α2) (see Eq. (1)). According to the geometric relationship, the wedge sideA1C1(orA2C2) for singlelayer soil (Fig. 3) is determined by
The mathematical expression of the logarithmic spiral failure lineC1D1E1(orC2D2E2)is described by Eq.(2)(see Fig.3).The upper and lower influence zones(i.e.S1andS2)are calculated by(Fig.3).


According to Eqs. (3)-(6), the optimal inter-helix spacing ratioSop/Dhcan be obtained:

TheSop/Dhis related to the friction angle(φ)and the wing ratio(Dh/Dc).
2.2. Cavity expansion theory
Under an axial compression load, the soil compression deformation at the pile end is similar to the cavity expansion process in an infinite medium (Vesi′c, 1972; Randolph et al., 1994; Yasufuku and Hyde, 1995). Yang et al. (2005) compared various failure modes of pile tip and suggested a local failure mode, which can better predict the bearing capacity of the pile tip in sand(Fig.4)and is then used to estimate the influence zone of the pile tip (Yang,2006).
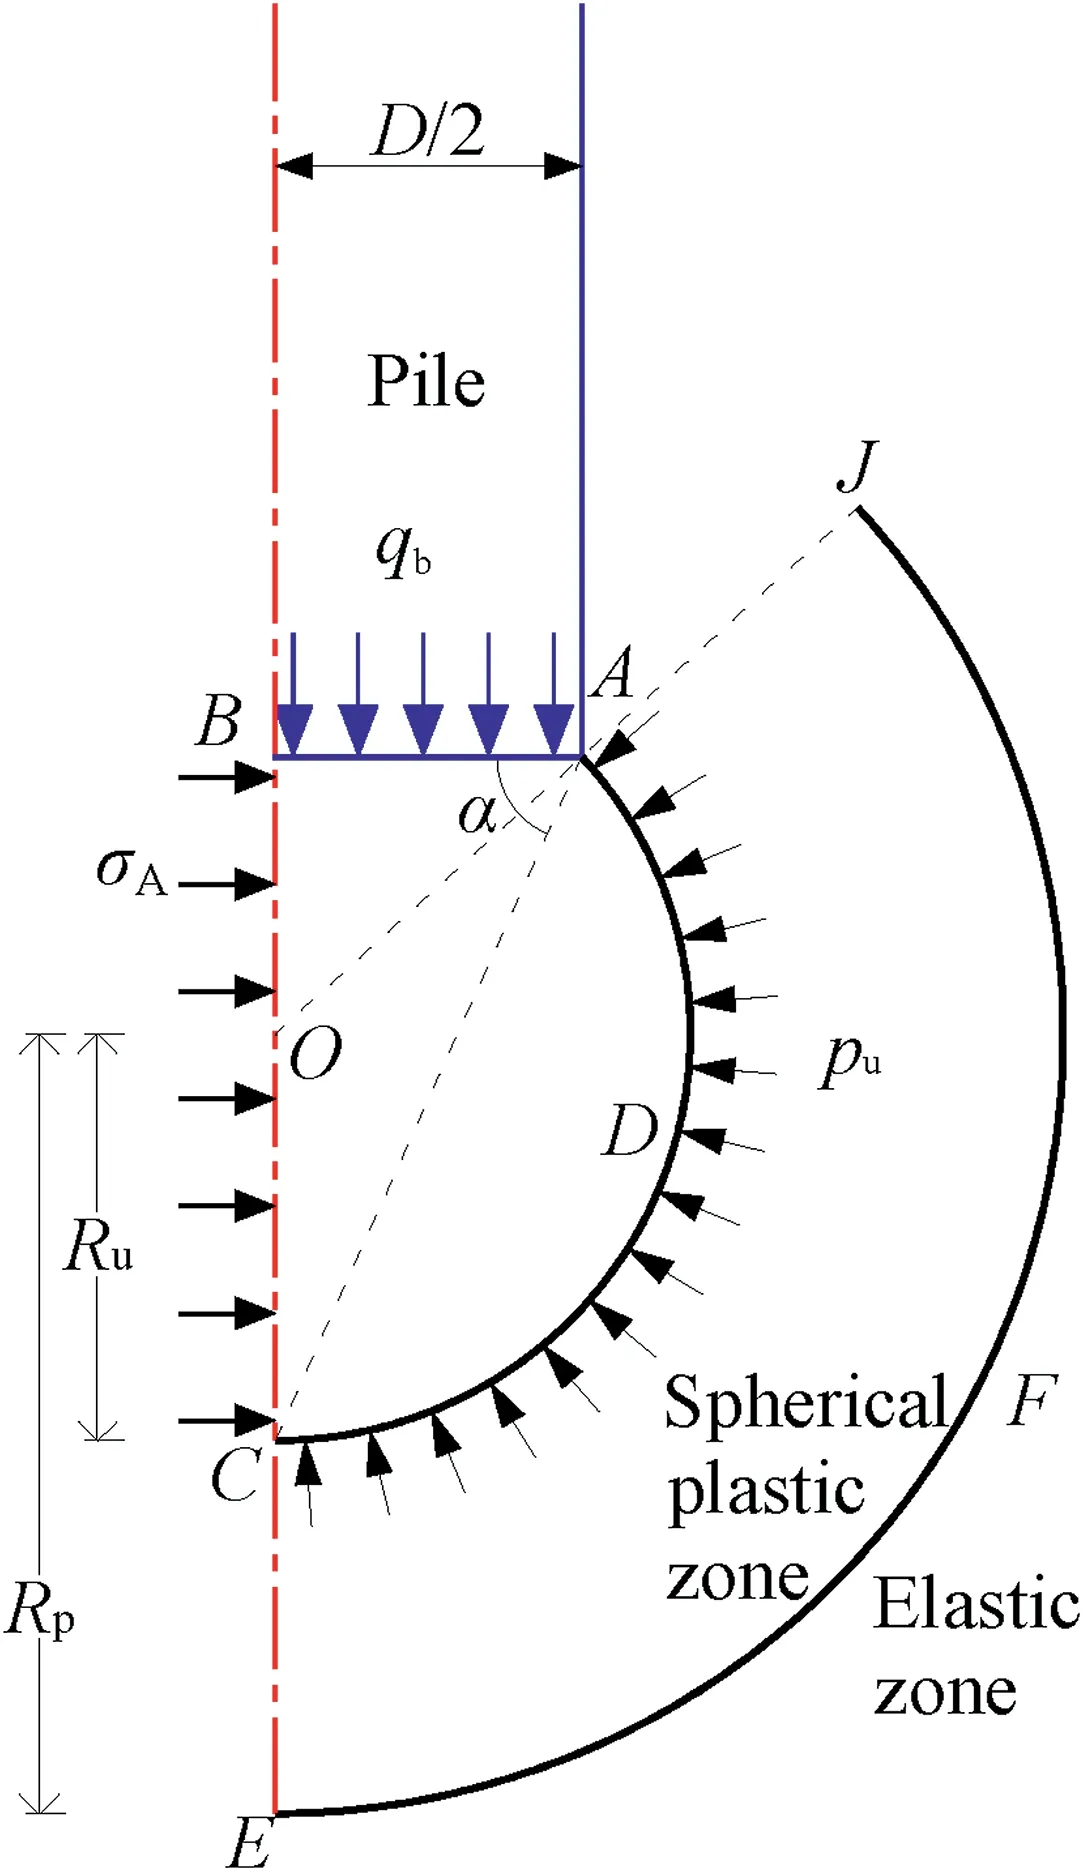
Fig. 4. Cavity expansion method (modified from Yasufuku and Hyde,1995).
The cavity ultimate pressure (pu) acts on the spherical surfaceADC, and the active earth pressure σAacts on the edgeBC(Fig. 4).The wedgeABCis below the pile end, and the angle between the wedge and pile tip is α(Fig.4).The relationship between the cavity ultimate pressure (pu) and the bearing capacity (qb) of pile tip can be determined using (Yasufuku and Hyde,1995):

As shown in Fig.4,in the limit state,the cavity radius isRu,the area for the radius ofRpis the plastic zone,and the soil outside the plastic zone is the elastic zone.The influence zone of the pile tip is within the boundaryEFJ,which is the boundary between the plastic and the elastic zone.
Similarly,in order to analyze the size of influence zone between helices,a double-helix pile was used as an example(see Fig.5).The helix failure under the axial compression load is the cavity expansion process. When the helix thickness exceeds the critical thickness, the effect of the helix bending on the load settlement behavior for the helical pile may not be considered (Malik et al.,2019). When the cavity expansion method is used to analyze the optimal inter-helix spacing of the helical pile, it is considered that the helix is a rigid plate,which will not bend during the axial loadbearing process.
The upper(or lower)helix shows the limit state zoneA1B1C1D1(orA2B2C2D2) below the helix under axial compression load. The soil outside the limit state zone can be divided into the plastic and elastic zones.The boundary between the plastic and elastic zones isE1F1J1(orE2F2J2). When the upper and lower influence zones overlap under the axial load,the inter-helix spacing is the optimal inter-helix spacingSop.
As shown in Fig. 5, The angle α between the wedgeA1B1C1(orA2B2C2) and the upper (or lower) helix is calculated using (e.g.Randolph et al., 1994; Yasufuku et al., 2001; Manandhar and Yasufuku, 2013):

where φcvis the critical state friction angle of the soil.
For the cavity expansion method, the radius of the limit state zone(i.e.O1C1orO2C2)isRu,and the radius of the plastic zone(i.e.O1E1orO2E2) isRpin the single-layer soil:

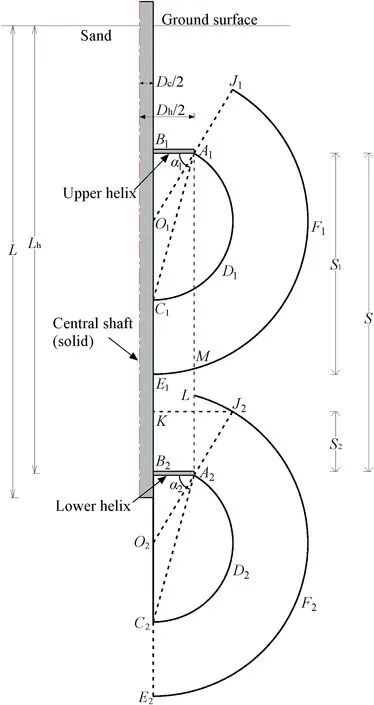
Fig.5. The influence zone of inter-helix for cavity expansion(e.g.a double-helix pile).
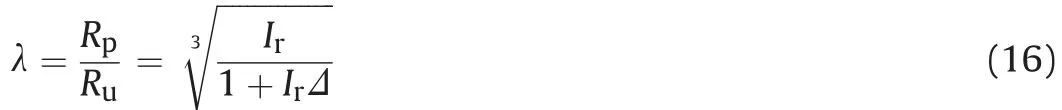
The parameter λ is defined as the relative plastic zone (i.e. the ratio ofRp/Ru).The upper and lower influence zones(i.e.S1andS2)between helices can be evaluated using
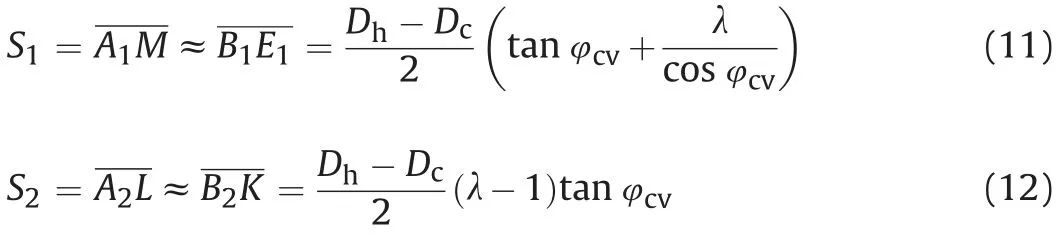
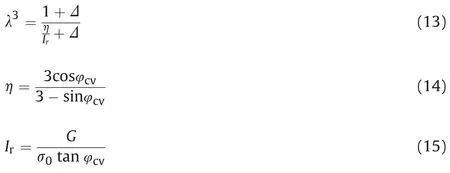
where ⊿is the average volumetric strain,Iris the stiffness index,Gis the soil shear modulus, and σ0is the axial stress.
It is noted that for most cases where ⊿<0.1 and 0°<φcv<45°,η ≈1 and≈1,the expression in Eq.(13)can be simplified as
According to Eqs.(1),(11),(12),(15)and(16),theSop/Dhcan be determined as follows:
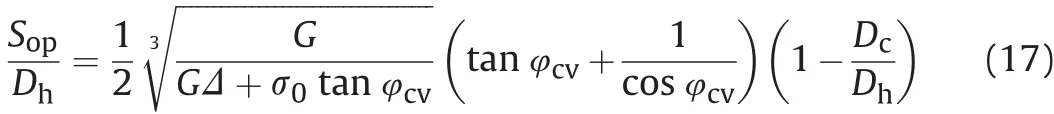
It is found that the optimal inter-helix spacing ratio is related to the critical state friction angle, shear modulus, volumetric strain,effective axial stress,and the wing ratio.
2.2.1. Shear modulus
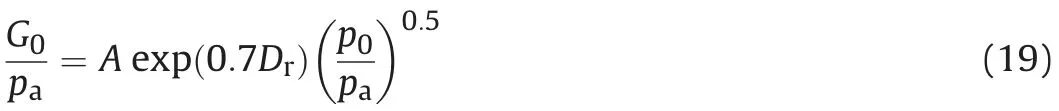
The shear modulus of sand was significantly affected by the stress state and void ratio (or relative density) of sand (Lo Presti,1987). The initial shear modulusG0of sand is evaluated by (Lo Presti,1987):

whereAis a coefficient reflecting the effect of fine content;p0is the confining pressure(isotropic medium);pais the reference pressure(100 kPa);Dris the relative density of sand; and χ andBare the characteristic parameters with typical values of 0.7 and 0.5,respectively.
Considering the suggestion of Randolph et al. (1994), the following relationship is used to approximate the shear modulus of sand with different fine contents:
The recommended value ofAvaries with the fine content of sand, which can be selected in Table 1.
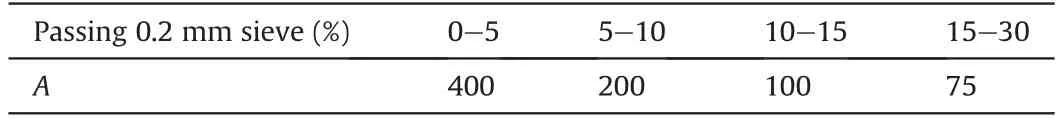
Table 1Suggested value of A with fine content of sand (Randolph et al.,1994).
The initial shear modulus can be determined by the small-strain test (i.e.test shear strain of 10-6-10-5). In fact, as the shear strain(γ) increases (i.e. from small-to large-shear strain), the shear modulus of the soil presents a non-linear decreasing trend(Clayton, 2011). According to the empirical formula proposed by Ishibashi and Zhang (1993), the trend of shear modulus degradation with shear strain is evaluated by
whereIpis the soil plasticity index, andCandFare the characteristic parameters.
The shear strain range of the soil during elastoplastic deformation was 10-4-10-2(Ishihara, 1996). For the cavity expansion method, a shear modulus corresponding to a shear strain of 10-3was recommended (e.g. Yasufuku et al., 2001; Manandhar and Yasufuku, 2011).
2.2.2. The average volumetric strain
The average volumetric strain plays a key role in estimating the radius of the relative plastic zone.The average volumetric strain ofsand is generally tested by triaxial compression experiments. In order to avoid the workload in the test process, the empirical relationship (i.e. Eq. (24)) suggested by Yasufuku et al. (2001) is adopted. Eq. (24) was applied and verified in the analysis of the ultimate bearing capacity of the pile tip using the cavity expansion theory (e.g. Manandhar and Yasufuku, 2013; Gharsallaoui et al.,2020; Singh and Patra,2020).

2.2.3. Other parameters
The peak friction angle and the dry unit weight(γd)of sand are closely related to the relative density.The relationship between the peak friction angle and the dry weight varies with the relative density, as summarized by Brinkgreve et al. (2010):
The lateral earth pressure coefficientKhis closely related to the pile construction method (i.e. rotary press-in installation).Accordingly, the lateral earth pressure coefficient (i.e. Eq. (27)) of the rotating pressed pile adopts the research results of Al-Baghdadi(2018). Further, the confining pressurep0of the helical pile in the sand is estimated by Eq. (28).
The following is the parametric analysis of the influence zone of the helix, considering the pile depth, relative density, and sand type. Only the sand strength is considered in Meyerhof pile foundation theory.Two typical sands,i.e.clean silica sand(fine content is within 5%) and silty sand (fine content is 15%-30%), are considered in cavity expansion method.Fleming et al.(2009)pointed out that the critical state friction angles of most sands do not exceed 30°in practical applications.In this paper,the critical state friction angle of sand is taken as 30°. TheDh/Dcratio is generally 1.5-3(Spagnoli and Tsuha, 2020). For analysis pirpose purpose, a helix diameter of 2.5 times the central shaft diameter(i.e.wing ratioDh/Dc= 2.5) is discussed.

Fig.6. The variation of S1/Dh,S2/Dh,and Sop/Dh with φp in sand based on the Meyerhof pile foundation theory.
3. Results and discussion
3.1. Meyerhof pile foundation theory
As mentioned above(i.e.Eq.(7)),the optimal inter-helix spacing ratio is affected by the sand strength. Therefore, the sands with different strengths were adopted to analyze the influence zone and the optimal inter-helix spacing.
As shown in Fig. 6, based on the Meyerhof pile foundation theory,the optimal inter-helix spacing ratio is related to soil friction angle for the lower part of the pile tip. The optimal inter-helix spacing ratio increases with increase of the soil friction angle. The sand friction angle varies generally from 30°to 45°,and the optimal inter-helix spacing ratio(Sop/Dh)varies from 5.72 to 28.The spacing ratio of the upper influence zone(S1/Dh)is in the range of 0.78-1.2,and the spacing ratio of the lower influence zone (S2/Dh) is in the range of 4.94-26.8. The lower influence zone accounts for 86%-96% of the optimal inter-helix spacing, which is the main component of the optimal spacing.
3.2. Cavity expansion method
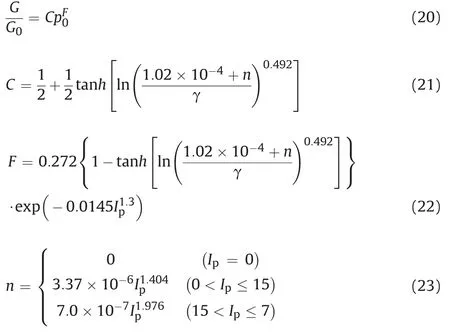
As mentioned above (i.e. Eq. (17)), the optimal inter-helix spacing ratio (Sop/Dh) is affected by the axial stress, sand strength and sand type. Therefore, the two types of sands (i.e. clean silica sand and silty sand) with different relative densities(i.e.from 25%to 85%) and different pile depths (i.e.Lh= 5 m, 15 m, 30 m, and 50 m)were adopted to analyze the influence zone and the optimal inter-helix spacing(Figs.7 and 8).In terms of the clean silica sand,when the installation depths of the lower helix for the helical pile are 5 m,15 m,30 m,and 50 m,respectively,the inter-helix spacing ratio (S/Dh) varies with the relative density (Fig. 7). The optimal inter-helix spacing ratio (Sop/Dh), the spacing ratio of the upper influence zone (S1/Dh), and the spacing ratio of lower influence zone(S2/Dh)increase with increase of the relative density.It shows that theS1/Dhvalue is larger than that ofS2/Dh.For example,when the relative density of the clean silica sand is 50%, and the installation depth of the lower helix is 15 m,Sop/Dhis 3.6,S1/DhandS2/Dhare 2.6 and 1,respectively(see Fig.7b).In this example,theS1/Dhis about 2.6 times the value ofS2/Dh.Correspondingly,the upper and lower influence zones are 72% and 28% of the optimal spacing,respectively.
For silty sand,when the installation depths of the lower helix for the helical pile are 5 m,15 m, 30 m, and 50 m, the optimal interhelix spacing ratio and the spacing ratio of the upper (or lower)influence zone vary with the relative density,as shown in Fig.8.TheSop/Dhincreases with increase of the relative density, andS1/Dhis larger thanS2/Dh.The regulation ofS/DhversusDrin the silty sand is almost the same as that of the clean silica sand,but the relative size of the upper or lower influence zone is different.For instance,when the installation depth of the lower helix is 15 m (Fig. 8b), the optimal inter-helix spacing ratio in the silty sand is 1.5-2, while that in the clean silica sand is 3.2-4.4. The optimal inter-helix spacing ratio in silty sand is smaller than that in clean silica sand.
In the same example (Fig. 8b), the relative density of the silty sand is 50%, and the installation depth of lower helix is 15 m. Results indicate that the optimal inter-helix spacing ratio (Sop/Dh) is 1.7,the spacing ratio of the upper influence zone(S1/Dh)is 1.3,and the spacing ratio of lower influence zone(S2/Dh)is 0.4.TheS1/Dhis approximately 3.25 times larger thanS2/Dh. The upper influence zone and the lower influence zone account for 76% and 24%of the optimal inter-helix spacing, respectively. The upper (or lower) influence zone accounts for a higher (or lower) proportion of the optimal inter-helix spacing in the silty sand than that in clean silica sand.
Fig. 7. The variation of S1/Dh, S2/Dh, and Sop/Dh with Dr of the clean silica sand at Lh of (a) 5 m, (b) 15 m, (c) 30 m, and (d) 50 m.
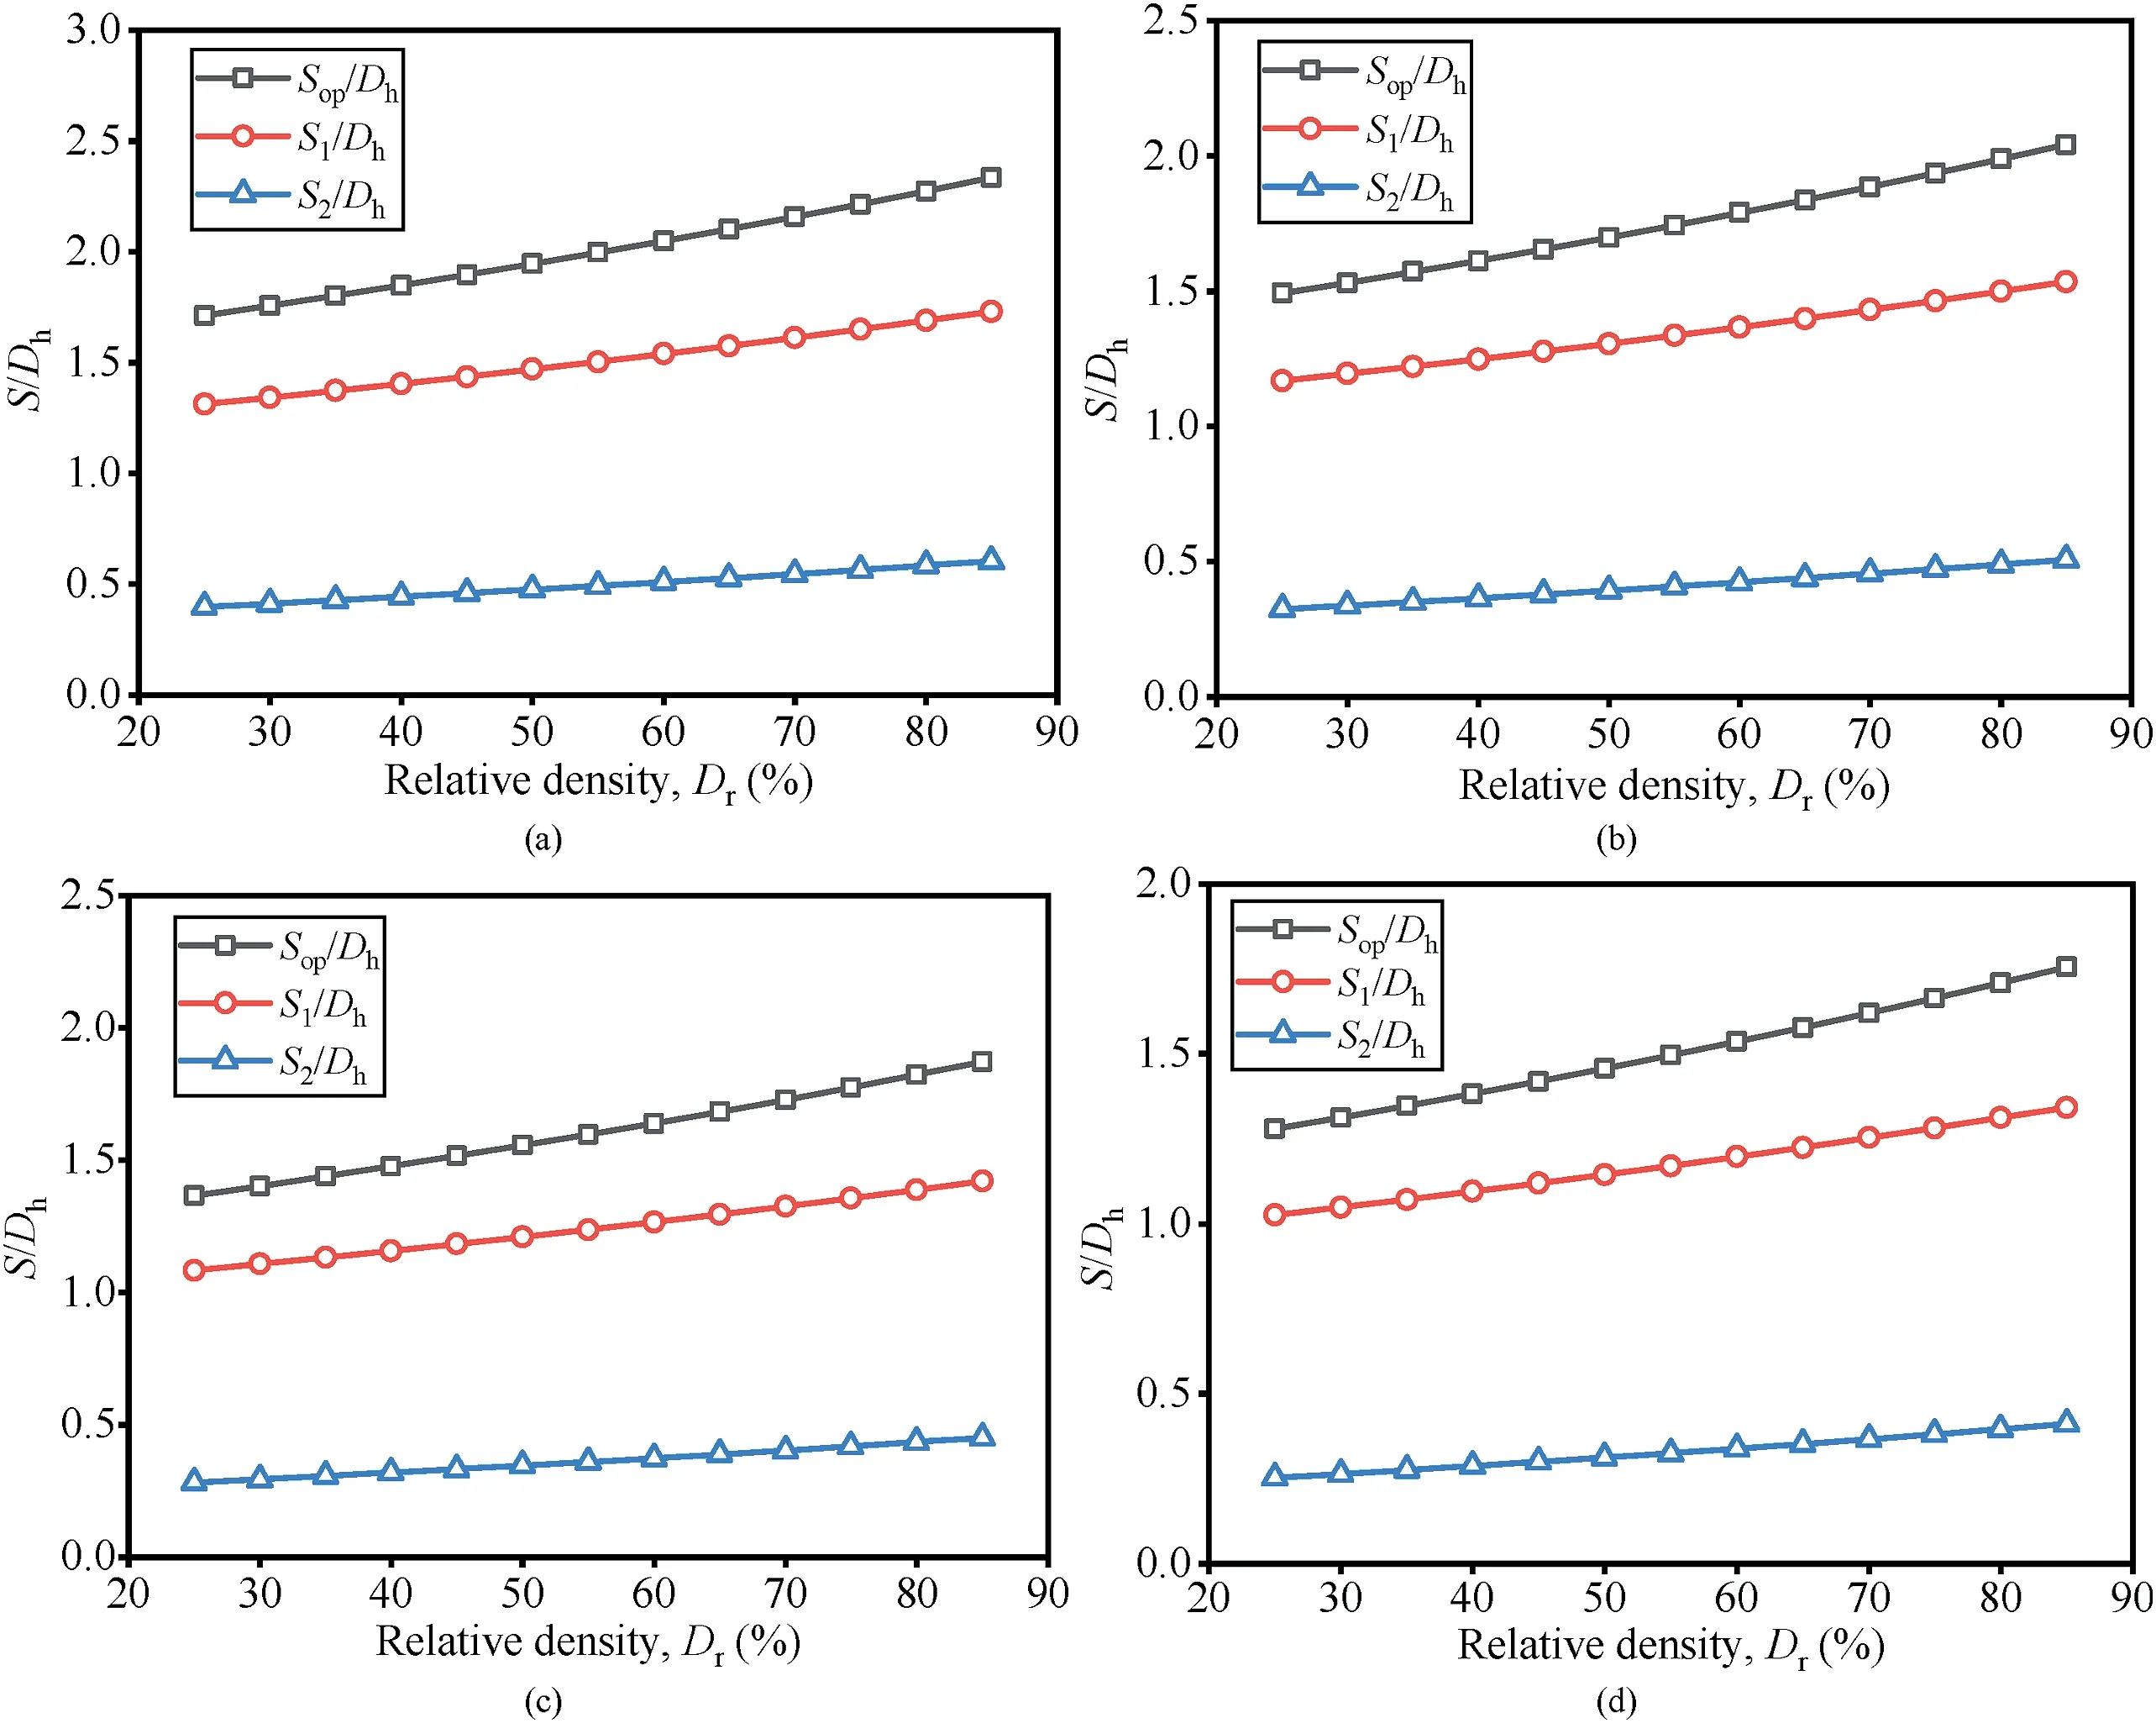
Fig. 8. The variation of S1/Dh, S2/Dh, and Sop/Dh with Dr of the silty sand at Lh of (a) 5 m, (b) 15 m, (c) 30 m, and (d) 50 m.
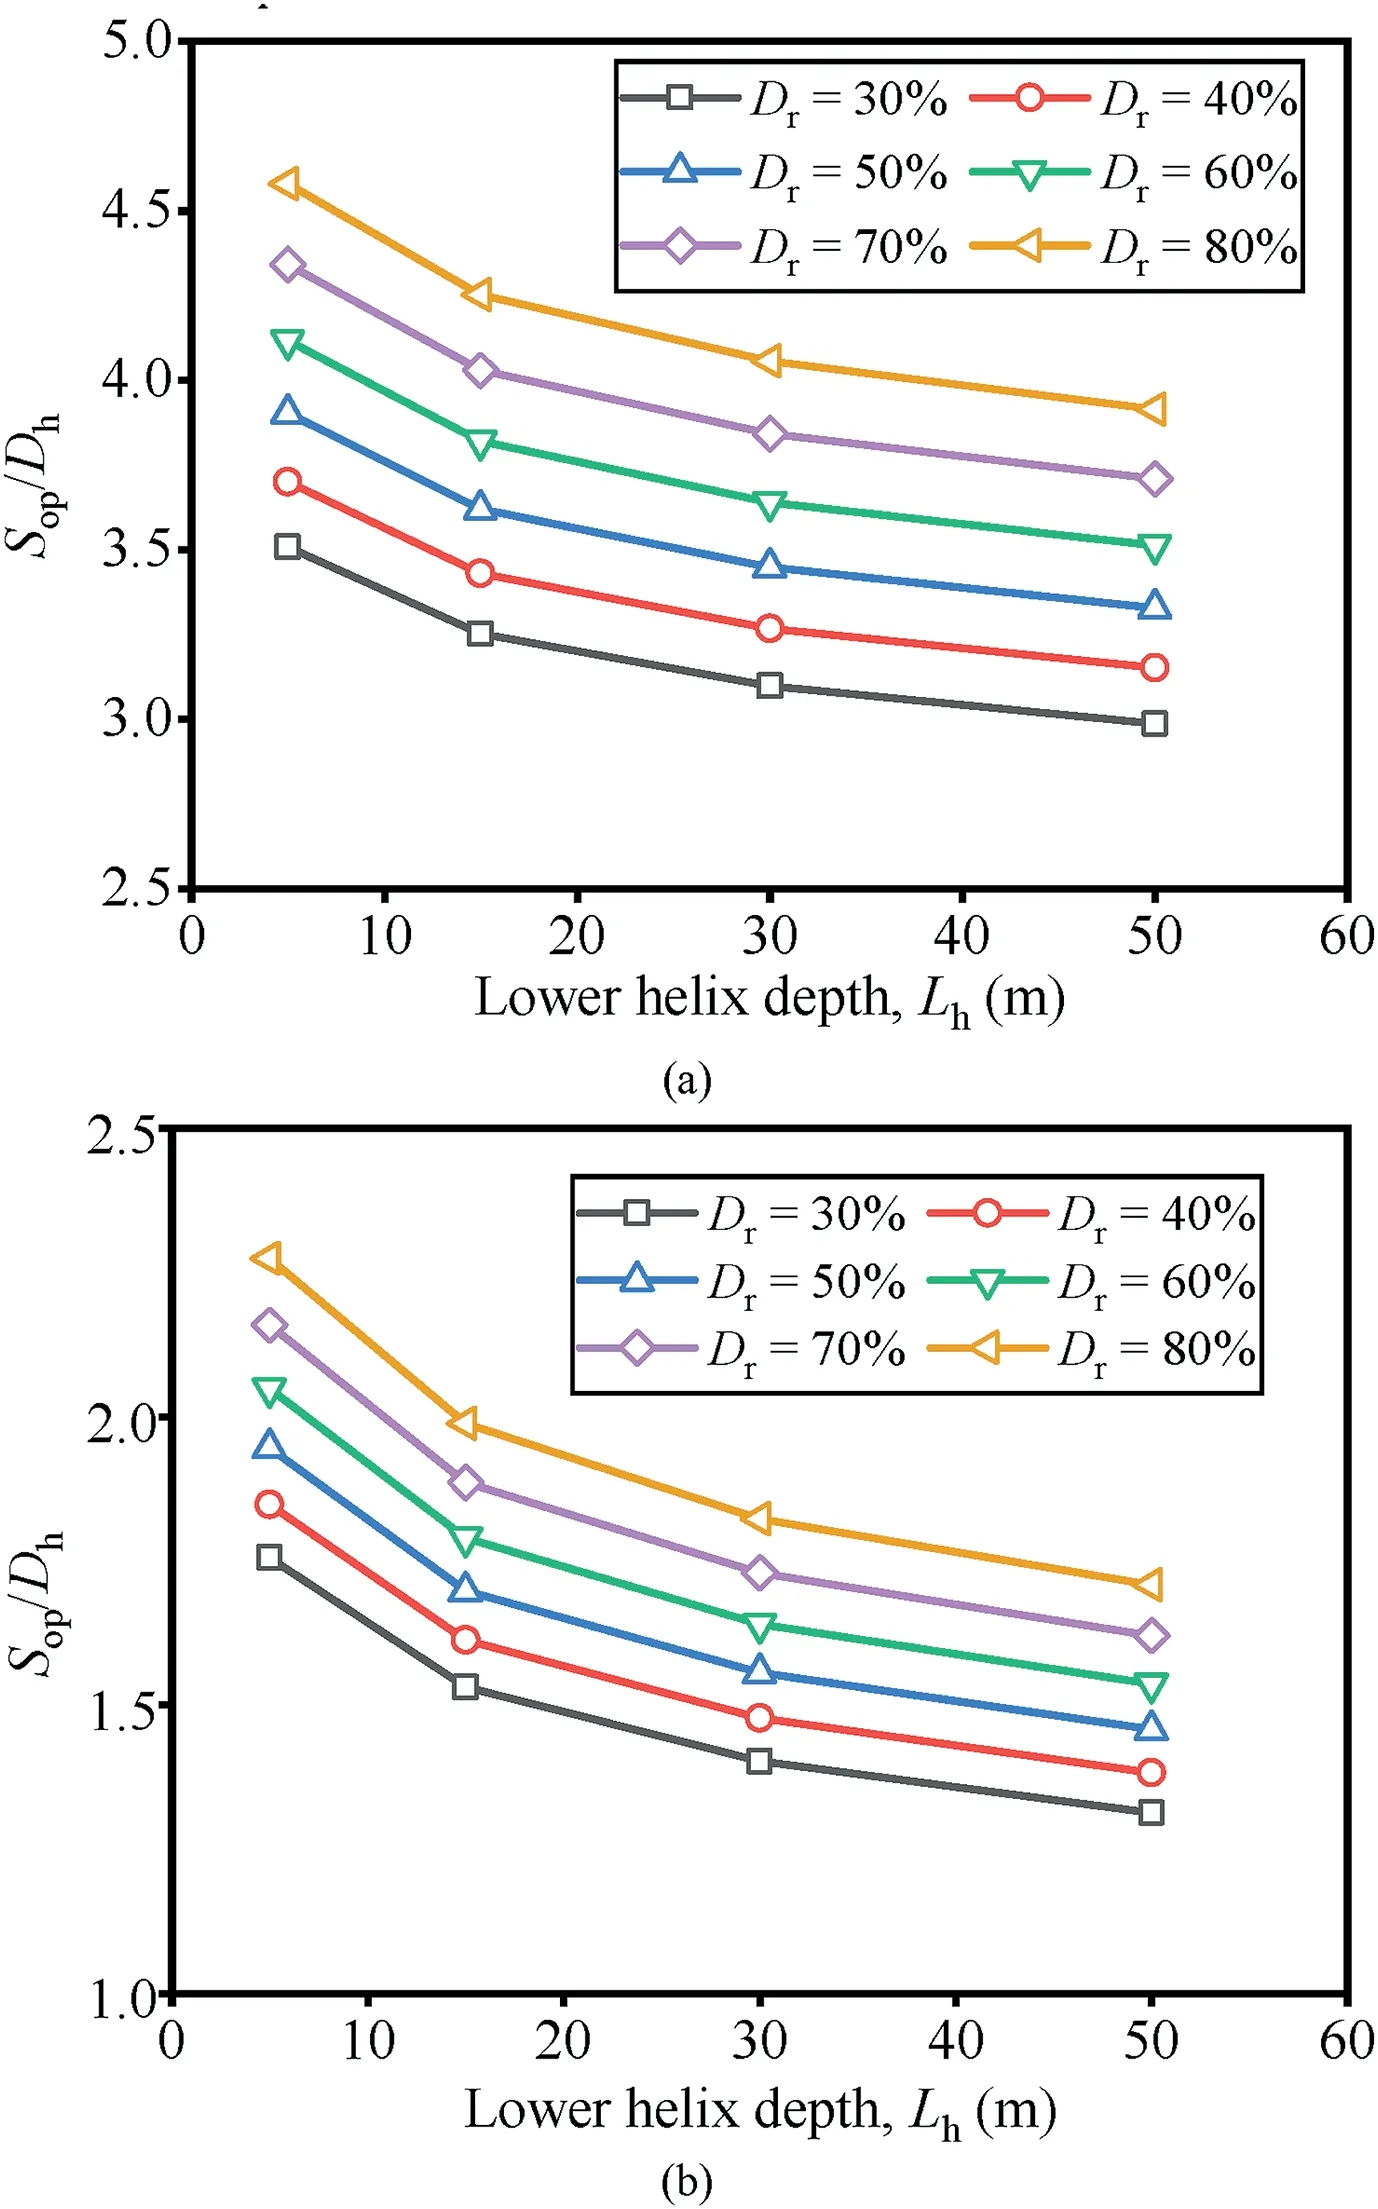
Fig.9. The varition of Sop/Dh with Lh under different relative densities for(a)the clean silica sand and (b) the silty sand.
Under different relative densities of clean silica sand and silty sand, the optimal inter-helix spacing ratioSop/Dhvaries with installation depth of the lower helix(Lh)(Fig.9).In the case of the same density of the two sands,the greater the installation depth of the lower helix, the smaller theSop/Dh(Fig. 9). However,Sop/Dhgradually tends to maintain a constant value as the installation depth gradually increases. The constant value increases as the increase of relative density.
When the two sands have the same relative density,the optimal inter-helix spacing ratio (Sop/Dh) in the silty sand decreases with increase of the installation depth of the lower helix,which is more obvious than that in clean silica sand (Fig. 9). The sand with a relative density of 50%is used as an example.In this example,when the installation depths of the lower helix in clean silica sand are 5 m,15 m, 30 m, and 50 m, the optimal inter-helix spacing ratios(Sop/Dh) are 3.9, 3.6, 3.4, and 3.3, respectively.Sop/Dhat the lower helix depths of 15 m, 30 m, and 50 m are reduced by 8%,13%, and 15% compared to that at the lower helix depth of 5 m. Similarly,when the installation depths of the lower helix in the silty sand are 5 m,15 m, 30 m and 50 m, the optimal inter-helix spacing ratios(Sop/Dh) are 1.9, 1.7, 1.6, and 1.5, respectively.Sop/Dhat the lower helix depths of 15 m,30 m,and 50 m are reduced by 11%,16%,and 21% compared to that at the lower helix depth of 5 m.
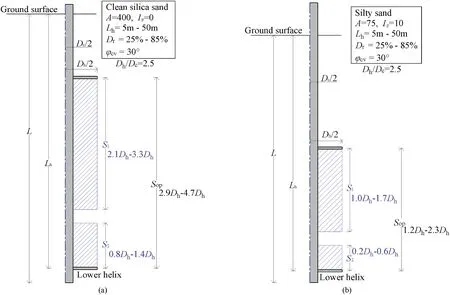
Fig.10. The S1, S2, and Sop for inter-helix in (a) the clean silica sand and (b) the silty sand.
3.3. Discussion
Meyerhof(1956,1976)suggested that the classical failure mode for pile tip is based on the conclusions of the bearing capacity theory for shallow foundation and small-scale model tests.Meyerhof (1951), DeBeer (1963), Eslami and Fellenius (1997)believed that the classical failure zone of pile tip is mainly limited in the range above the pile tip.However,the bearing capacity test of the pile under real stress level shows that the assumption of sliding upward extension in the classical failure mode is not applicable to the pile (White and Bolton, 2005). The evaluation of the optimal inter-helix spacing by the Meryerhof pile foundation theory is also far from the field measurement. In this paper, according to the Meyerhof pile foundation theory, the optimal inter-helix spacing range is determined to be 5.8Dh-28Dh, with an average value of 16.9Dh, which is far from the actual situation. The Meyerhof pile foundation theory is not applicable to estimate the influence zone of the inter-helix.
The upper and lower influence zones of the inter-helix are shown in Fig. 10 according to the cavity expansion method. The optimal inter-helix spacing in the clean silica sand ranges from 2.9Dhto 4.7Dh,with an average value of 3.8Dh.The upper(or lower)influence zone varies from 2.1Dhto 3.3Dh(or 0.8Dhto 1.4Dh),with an average value of 2.7Dh(or 1.1Dh).The influence zone of the silty sand is smaller than that of the clean silica sand.The optimal interhelix spacing in the silty sand ranges from 1.2Dhto 2.3Dh, with an average value of 1.8Dh. The upper (or lower) influence zone varies fromDhto 1.7Dh(or 0.2Dhto 0.6Dh),with an average value of 1.4Dh(or 0.4Dh). The influence zone of the inter-helix in two sands decreases with the increase of pile installation depth and increases with the increase of the relative density.The upper influence zone is larger than the lower influence zone.The upper influence zone in clean silica sand (or silty sand) is about 2.5 times (or 3.3 times) as large as that of the lower influence zone.In this paper,based on the cavity expansion method,the estimated range of the optimal interhelix spacing from 1.2Dhto 4.7Dhin clean silica and silty sand is basically consistent with the field test results (e.g. Zhang, 1999;Tappenden, 2007; Perko, 2009; Elkasabgy and El Naggar, 2015;Lanyi-Bennett and Deng, 2019). It is reasonable to use the cavity expansion method to explain the optimal inter-helix spacing.
In this paper, it is assumed that the upper and lower helix diameters for the helical pile are the same,and the difference in the axial stress field can be ignored.The results in this context provide some guidance for the practical application of helical piles. When the helix is set in the bearing layer, it needs to be deeper in the clean silica sand than in the silty sand. The reasonable inter-helix spacing varies with different properties of sand (e.g. fine content,friction angle and relative density)and pile installation depths.The optimal inter-helix spacing ratio in sands with high fine content is smaller than sands with low fine content.
When predicting the bearing capacity of piles based on cone penetration test (CPT), the laboratoire central des Ponts et Chaussees (LCPC) method (Bustamante and Gianeselli, 1982) is a commonly used method.This method selects the CPT results within the range of 1.5Dabove the pile tip and 1.5Dbelow the pile tip to evaluate the resistance of pile tip, whereDis SSP diameter. When the LCPC method is applied to helical piles,similarly,the CPT results within the range of 1.5Dhabove the helix and 1.5Dhbelow the helix are evaluated for helix resistance.The evaluated bearing capacity is consistent with the actual measurement in a global sense(Tappenden, 2007; Perko, 2009; Fateh et al., 2017; Al-Baghdadi,2018). The influence zone of the inter-helix based on the cavity expansion method is basically consistent with the evaluation range of bearing capacity of the pile tip considered by the LCPC method.This further shows that the cavity expansion method is suitable for evaluating the influence zone of the inter-helix. To accurately analyze and predict the bearing capacity of helical piles, it is necessary to classify and discuss different sands and pile lengths.
4. Verification
4.1. Centrifuge model test
Helical piles with different helix numbers (N) present different bearing modes under the axial compression load. The bearing mode can be estimated by varying the bearing capacity with different helix numbers (i.e. helix spacing ratio) (e.g. Narasimha Rao and Prasad, 1993; Narasimha Rao et al., 1993). The ultimate bearing capacity of the pile does not vary with the helix number for the CSM (e.g. Knappett et al., 2014; Al-Baghdadi, 2018). The pile bearing capacity increases significantly with the increase of the helix number for the IBM (e.g., Knappett et al., 2014; Al-Baghdadi,2018). The transition point (i.e. certain helix spacing ratio) of the two load-bearing modes (i.e. CSM and IBM) for the helical pile is used to estimate the optimal inter-helix spacing.
In this paper, the axial compression centrifuge test of multihelix pile (MHP) conducted by Al-Baghdadi (2018) was used to verify the evaluation of the optimal inter-helix spacing based on the cavity expansion method. The sand used in the centrifuge test is Congleton HST95 sand.The particle size distribution curve is shown in Fig.11, and sand properties are shown in Table 2.
According to the particle size distribution of the Congleton HST95 sand,the fine content and the parameterAin Eq.(19)can be determined.The soil plasticity index(Ip)is taken as 10.The relative density of the sand in the centrifuge test is 73%. The peak friction angle is 43.6°according to Al-Defae et al.(2013).The details of the centrifuge test apparatus and process for the helical pile can refer to previous studies (Al-Baghdadi et al., 2016; Al-Baghdadi, 2018;Davidson et al.,2018).The structural configuration of the test pile in centrifuge tests is shown in Table 3.Typically,for model centrifuge tests in sand,the ratio of the pile diameter to the mean particle size(D50) is used to discuss the influence of the scale effect. Ovesen(1981) found that for models with anchor slab diameters/average grain size ratios greater than 25,no scale inaccuracy was seen.Also,Garnier et al.(2007)emphasized the importance of a pile diameter greater than 50D50to minimize grain size impacts on frictional contacts. Furthermore, Tsuha et al. (2007) defined the minimumDh/D50ratio to provide a satisfactory simulation of helical plate bearing resistance and reported that when the ratio of the helix diameter to the average grain size is between 33 and 67,there is no scale influence on the findings of uplift capabilities for helical piles in centrifuge model tests.
In the centrifuge tests,the pile models have a shaft diameter(Dc)of 10 mm and helix diameter (Dh) of 20 mm (Table 3), which are more than 67 times the mean particle size of the Congleton HST95 sand (D50= 0.13 mm in Fig.11). Therefore, for the range of model sizes investigated,the influence of scale effects on tests results can be considered negligible.
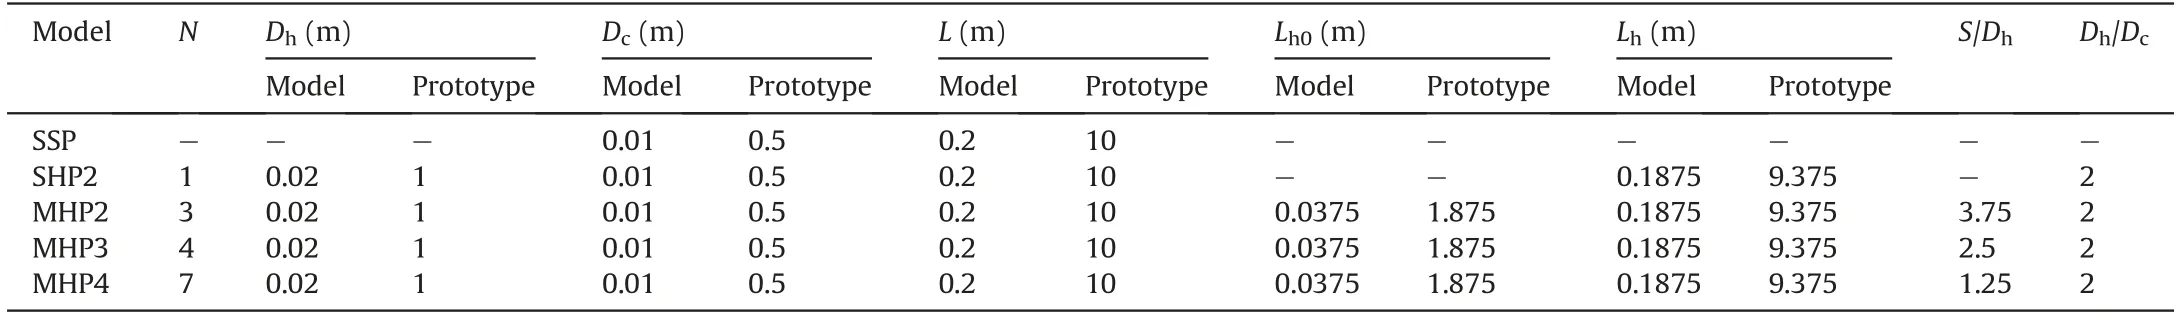
Table 3 Prototype dimensions of helical and SSP in centrifugal model tests(Al-Baghdadi, 2018).
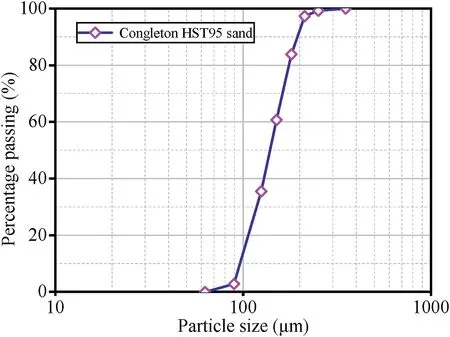
Fig.11. Particle size distribution for Congleton HST95 sand (Lauder, 2010).
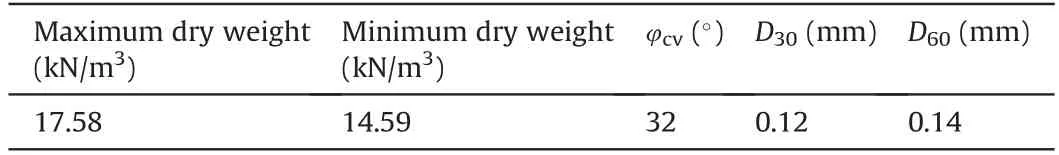
Table 2 Material properties of Congleton HST95 sand(Lauder, 2010; Lauder et al., 2013).
The load-settlement curves of four helical piles and a straight pile are obtained by centrifuge test (Al-Baghdadi, 2018). The loads corresponding to the pile top settlement of 0.05Dhand 0.1Dhare regarded as the ultimate bearing capacity of the helical pile(Fig.12).It is worth noting that for the axial compressive capacity of SSP, the pile top settlement corresponding to 0.05Dcor 0.1Dcis adopted (Fig.12).
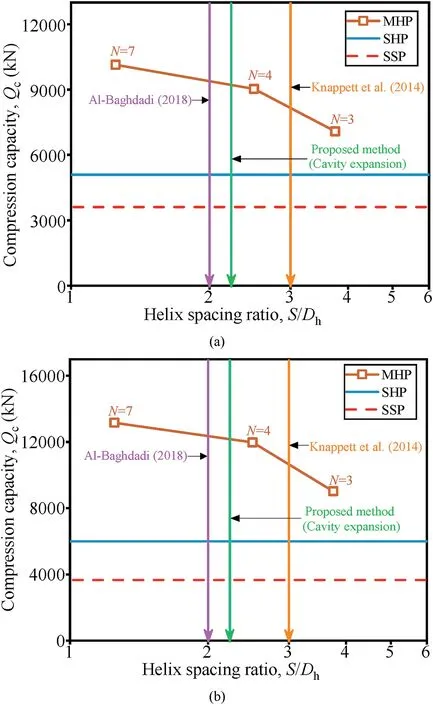
Fig.12. The effects of S/Dh on Qc corresponding settlement of(a)0.05Dh and(b) 0.1Dh for SHP, MHP and SSP.
The bearing capacity of the helical piles at the two pile top settlements (i.e.sp= 0.05Dhandsp= 0.1Dh) varies with the helix spacing ratio(Fig.12).The compressive capacities of MHP4(N=7,S/Dh= 1.25,Dh= 1 m in Table 3) are 12% (sp= 0.05Dh) and 10%(sp=0.1Dh)higher than those of MHP3(N=4,S/Dh=2.5,Dh=1 m in Table 3)(Fig.12).Meanwhile,the compressive bearing capacities of MHP3 are 27% (sp= 0.05Dh) and 32% (sp= 0.1Dh) higher than those of MHP2(N=3,S/Dh=3.75,Dh=1 m in Table 3)(Fig.12).The compression bearing capacities of MHP2 are 39%(sp=0.05Dh)and 50% (sp= 0.1Dh) higher than those of single-helix pile (SHP)(Fig.12).It can be concluded that the bearing capacity of the pile is improved significantly with increase of the helix number for MHP2 and MHP3.The bearing capacity for a multi-helix pile with adding a helix basically increases by 20%compared to the SHP.The field test of helical piles also shows that the bearing capacity of double-helix piles is 27% higher than that of the SHP (Elkasabgy and El Naggar,2015). In this paper, the compression capacities for MHP2 and MHP3 in the centrifuge test increase significantly with increase of the helix number. The bearing modes for MHP2 and MHP3 should be the IBM.However,the compressive bearing capacity of MHP4 is only 10% higher than that of MHP3, indicating that the helix number in MHP4 has less contribution to the bearing capacity.The load-bearing mode of MHP4 is transformed into a CSM. Therefore,it can be inferred that the optimal inter-helix spacing ratio is between 1.25 (MHP4) and 2.5 (MHP3).
Table 4 Parameters of Congleton HST95 sand for the constitutive model (stiffness is at a reference pressure of 100 kPa) (Al-Defae et al., 2013).

Table 5Configuration parameters of pile for FEM.
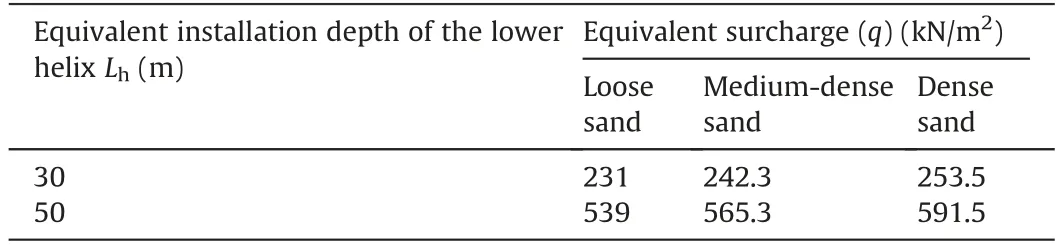
Table 6 The different installation depths of the lower helix using the equivalent surcharge(q) at the top boundary for three relative densities sand.
Previous research on optimal inter-helix spacing in Congleton HTS95 sand was reported as follows. Using the FEM, Al-Baghdadi(2018) inferred that the optimal spacing ratio is 2 based on the bearing capacity of the helical pile varying with the helix spacing ratio when the pile installation depth is 20 m. This result is applicable to dense sand and medium dense sand.Knappett et al.(2014)used the FEM to verify the load-settlement curve of helical piles in dense sand on model tests. The compression bearing capacity for helical piles with different helix numbers was analyzed at an installation depth of 0.435 m using the verified FEM. The optimal inter-helix spacing is determined to be 3 based on the compression bearing capacity of the helix pile, which varies with the helix spacing ratio.According to the above cavity expansion method(see Fig.9),it indicates that the optimal inter-helix spacing decreases as the pile depth increases under the same relative density. It can be inferred that the smaller optimal spacing ratio obtained by Al-Baghdadi (2018) than that of Knappett et al. (2014) may be due to the inconsistent stress level in sand. Based on the above literature analysis, the optimal inter-helix spacing ratio in dense Congleton HST95 sand varies from 2 to 3 when the pile depth ranges from 0.435 m to 20 m.
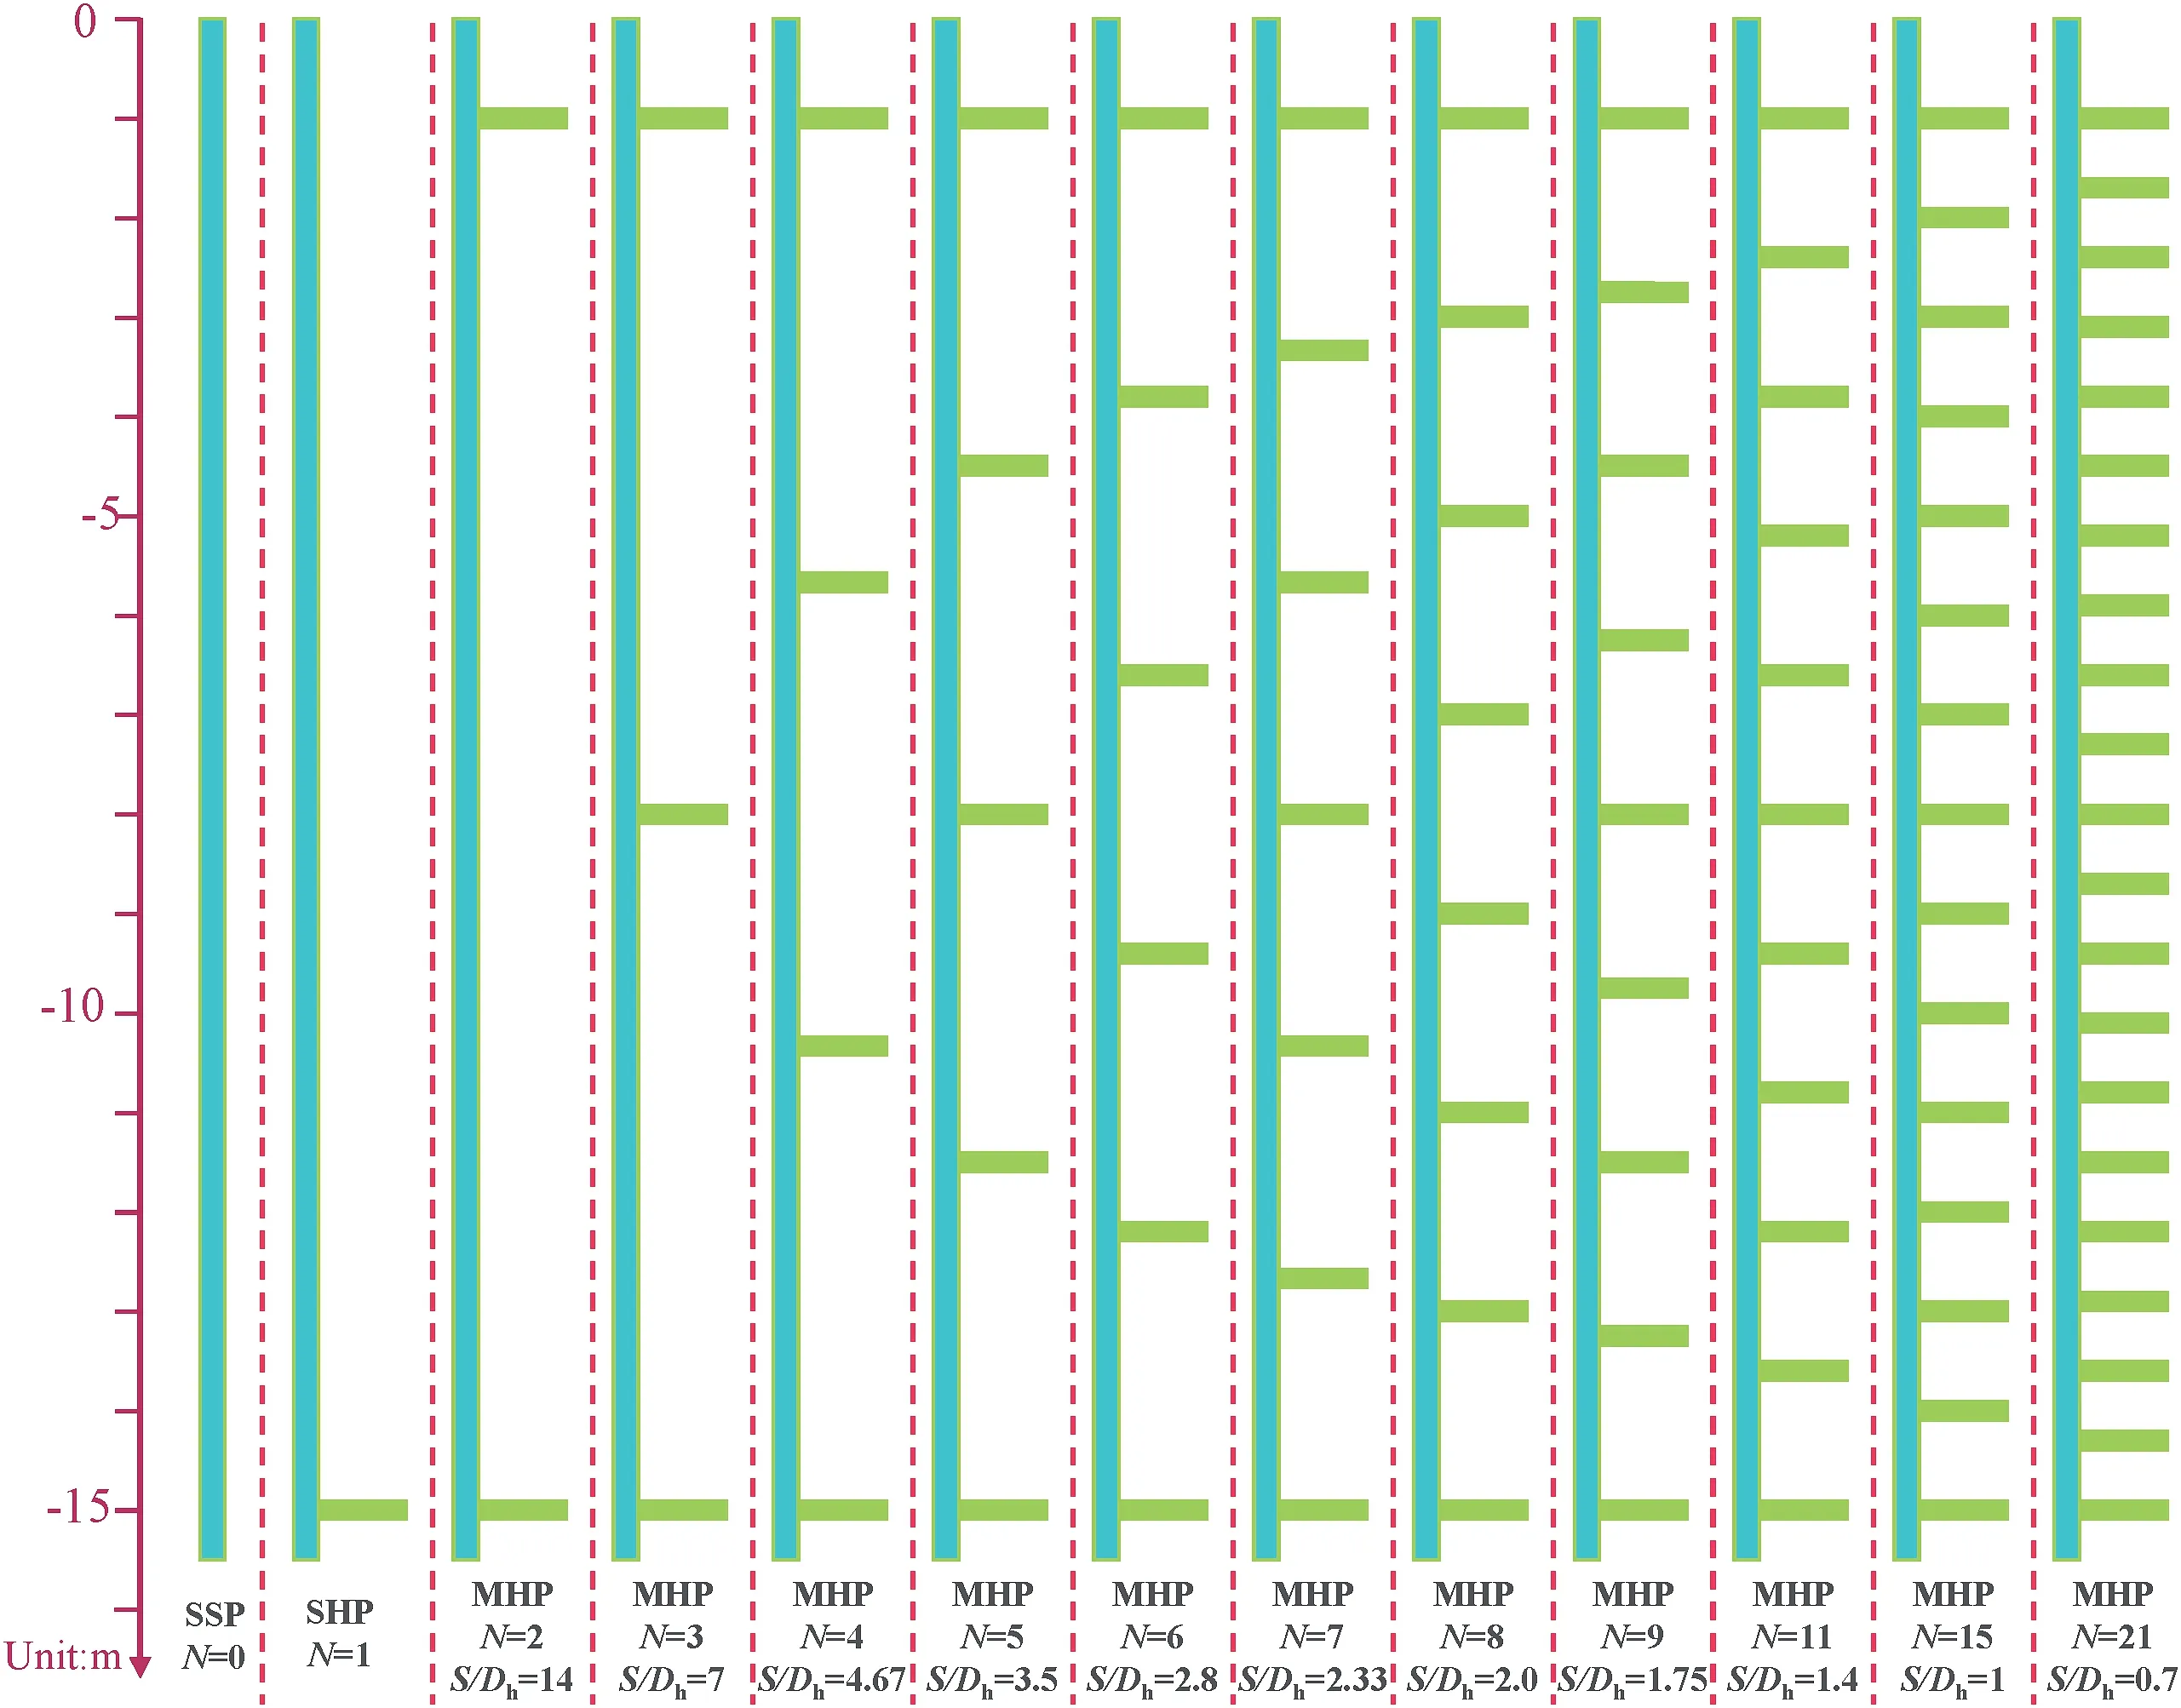
Fig.13. Variations of the helix spacing ratio for helical piles in 2D FEM (Dc = 0.4 m, Dh = 1 m).
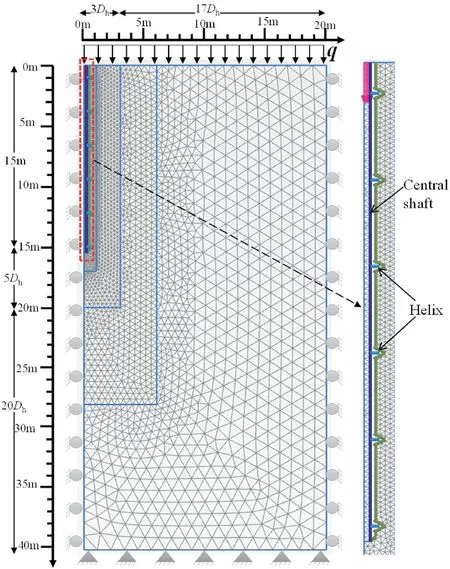
Fig.14. Typical geometry and boundary for helical piles in 2D FEM model (e.g. MHP,N = 6, S/Dh = 2.8) subjected to axial compression load.
In the centrifuge test, the installation depth for helical pile in dense Congleton HST95 sand is 10 m,and it can be concluded that the optimal inter-helix spacing ratio is between 1.25 and 2.5(Fig.12).On the basis of previous studies(Knappett et al.,2014;Al-Baghdadi, 2018) (Fig.12), it is inferred that the optimal inter-helix spacing ratio of helical piles in the centrifuge test (pile depth of 10 m)ranges from 2 to 2.5.When the pile is installed at a depth of 10 m in the dense Congleton HST95 sand, the optimal inter-helix spacing ratio is 2.2, which is calculated using the suggested cavity expansion method(Fig.12).According to the centrifuge model test,the proposed method using the cavity expansion method in this paper is reasonable and feasible.
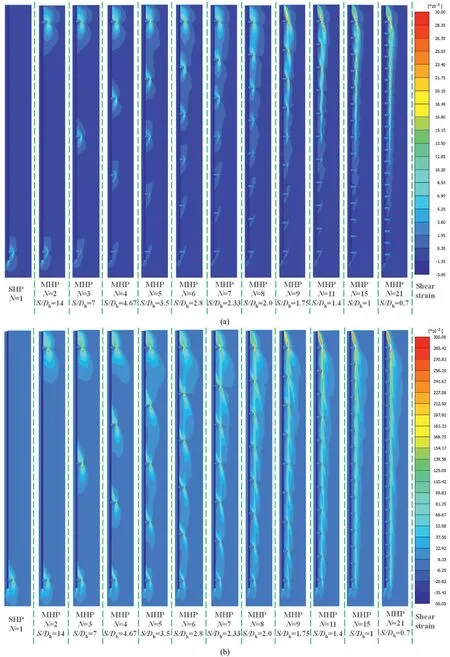
Fig.15. Shear strains induced around compressively-loaded helical piles (or SSP) at the settlement of(a) 0.005Dh (i.e. 5 mm), and (b) 0.05Dh (i.e. 50 mm) in medium-dense sand.
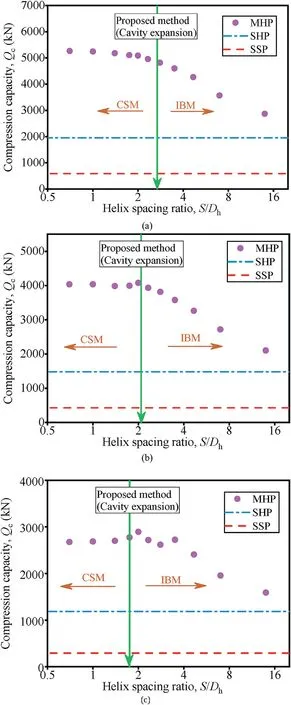
Fig. 16. The compression capacity (at the settlement of 0.05Dh) of helical piles vary with helix spacing ratio in (a) dense, (b) medium dense, and (c) loose sand (the compression capacity of SSP at the settlement of 0.05Dc) at the lower helix depth(Lh)of 15 m.
4.2. Finite element model (FEM)
The centrifuge model test can only infer the range of the optimal inter-helix spacing. The FEM can determine the accurate optimal spacing by analyzing the variation of the compression bearing capacity for helical piles. The following is a two-dimensional (2D)FEM to further verify the optimal inter-helix spacing based on cavity expansion theory.
In terms of helical pile geometry, it is common to idealize the helices as horizontal plates connected to the central shaft at a depth representative of the mid pitch of the true helix (Livneh and El Naggar 2008; Al-Baghdadi 2018; Pérez et al., 2018). This hypothesis has been verified through centrifuge experiments on wish-inplace (WIP) screw anchors by Hao et al. (2019), who showed that the uplift capacities of flat and helical plates were almost identical.A similar numerical result was found for WIP anchors by Al-Baghdadi (2018). This simplification allows helical piles to be modeled under axisymmetric conditions due to the symmetry of the geometry and loading (i.e. tension or compression)(Cerfontaine et al., 2021).
With respect to helical geometry, the helices are usually simplified as horizontal plates attached to the central shaft(Livneh and El Naggar, 2008; Al-Baghdadi, 2018; Pérez et al., 2018). Hao et al. (2019) demonstrated that the differences in uplift capabilities between the flat and helical plates could be ignored based on the centrifuge experiments with WIP screw anchors, which is consistent with the finding of numerical analysis of WIP anchors by Al-Baghdadi (2018). In view of the symmetry of the geometry and loads(tension or compression),helical piles can be simulated under axisymmetric circumstances (Cerfontaine et al., 2021). Also, the Plaxis 2D manual(Brinkgreve et al.,2012)emphasizes the concept of axisymmetric condition for simulation of cylindrical elements such as soil anchors and piles. Thus, the 2D axisymmetric model was reasonably and practically simplified as did by many recent studies about helical pile/anchor (e.g. Rawat and Gupta, 2017; Al-Baghdadi, 2018; Alwalan and El Naggar, 2020; Cerfontaine et al.,2021).
4.2.1. Model and parameters
A hardening model with small-strain stiffness adopted in this study has been verified by analyzing the axial performance of helical piles in Congleton HST95 sand (Knappett et al., 2014; Al-Baghdadi et al., 2017; Cerfontaine et al., 2019). This model is an elastoplastic model, in which the stiffness increases with the increase of confining pressure and decreases with increase of strain.Compared with the initial loading,the stiffness after unloading and reloading increases. The model is the combination of nonlinear elasticity and hardening plasticity,where the yield surface hardens with volumetric strain and deviatoric strain.
The parameters of Congleton HST95 sand with three different relative densities(i.e.Dr=30%for loose sand,Dr=55%for medium dense sand,andDr=80%for dense sand)for the constitutive model are shown in Table 4 (Al-Defae et al., 2013). Moreover, the soil element is a 15-node triangular plane axisymmetric element.
The pitch for the helix pile in 2D FEM is ignored,and the helix is simplified as a flat plate(Livneh and El Naggar,2008;Al-Baghdadi et al.,2017,2018;Pérez et al.,2018).The central shaft of the helical pile is equivalent to a solid pile(Knappett et al.,2014;Al-Baghdadi et al., 2017), and the axial stiffness of the solid pile is equal to the actual central shaft (Eq. (29)). The length and section size of the solid pile remain the same. The solid piles are linear elastic and non-porous materials in 2D FEM.

whereEpis the Young modulus of steel,Apis the cross-sectional area of the central shaft,Eeqis the equivalent Young modulus of the solid pile, andAeqis the cross-sectional area of the solid pile.
The edge of the solid pile is provided with a small axial rigidity(e.g. 0.025 kN/m) plate element for attachment of the helices. The helix is modeled using plate element with linear elastic behavior.The configuration parameters of helical pile are shown in Table 5.The 5-node plate element used for the helix is assumed. The mechanical behaviors of the interface elements were defined using the same method of Coulomb criterion as did by many previous researchers (e.g. Rawat and Gupta, 2017; Al-Baghdadi, 2018;Cerfontaine et al., 2021) with PLAXIS 2D software. Generally, for real soil-structure interaction, the interface is weaker and more flexible than the surrounding soil,which means that an associated strength reduction factor(Rinter) should be less than 1 (Brinkgreve et al., 2012).
The strength reduction factor(Rinter)for the pile-soil interface is approximately 0.7 according to the direct shear test of Congleton HST95 sand and steel (Lauder et al., 2013). The interface strength parameters are determined by
where δ is the interface friction angle,cis the effective soil cohesion, andciis the effective interface cohesion.
In the FEM, in addition to single spiral piles and straight piles,there are 11 MHP with the helix number(N)of 2(S/Dh=14),3(S/Dh= 7), 4 (S/Dh= 4.67), 5 (S/Dh= 3.5), 6 (S/Dh= 2.8), 7 (S/Dh=2.33),8(S/Dh=2),9(S/Dh=1.75),11(S/Dh=1.4),15(S/Dh=1),and 21 (S/Dh= 0.7) (Fig.13).
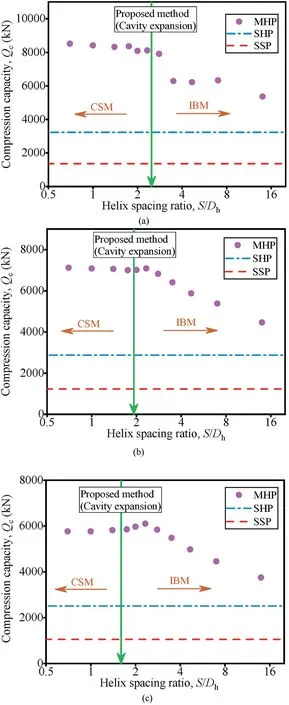
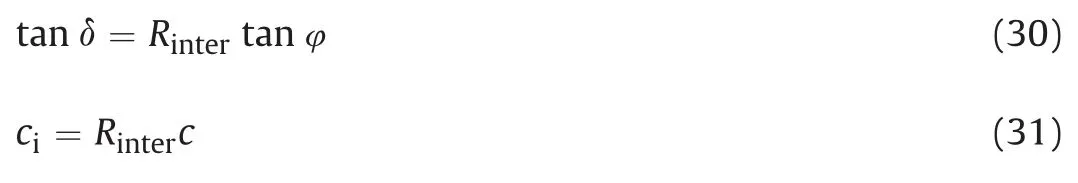
Fig. 17. The compression capacity (at the settlement of 0.05Dh) of helical piles vary with helix spacing ratio in (a) dense, (b) medium dense, and (c) loose sand (the compression capacity of SSP at the settlement of 0.05Dc) at the lower helix depth (Lh)of 30 m.
The FEM calculation is carried out in two stages. Following the first step of in situ geostatic stress generated, the pile model is activated, and the specified linear displacement is applied to the pile top at the same time to obtain the load-displacement curve.The ultimate bearing capacity of helical piles(or SSP)is defined as 5%of the helix(or shaft)diameter(Sakr,2009,2011;Elsherbiny and El Naggar, 2013).
Two cases,in which the installation depths of the lower helix are 30 m and 50 m,were used to simulate the axial compression of the pile under different axial stress fields.Increasing the surcharge(q)at the top boundary simulates the increase of pile installation depth, and the pile geometry remains the same (Table 6).
To better capture pile-soil interaction behavior,the refined mesh is adopted for the pile and adjacent soil.Around the pile,a 3Dhwide and(L+5)Dhdeep zone is formed(Fig.14).The generated mesh for a typical helical pile with a helix diameter of 1 m and a helix spacing ratio of 2.8 is shown in 2D FEM (Fig.14).
The horizontal displacements are limited for lateral boundaries of the 2D FEM model.The top border is free in both directions,but the bottom boundary is completely fixed in both directions(Fig.14).
Fig. 18. The compression capacity (at the settlement of 0.05Dh) of helical piles vary with helix spacing ratio in (a) dense, (b) medium dense, and (c) loose sand (the compression capacity of SSP at the settlement of 0.05Dc) at the lower helix depth(Lh)of 50 m.
4.2.2. Results and verification
The FEM results of the helical pile with a depth of 15.5 m in medium-dense sand were selected as an example (Fig.15). Shear strains induced around the pile (i.e. a SSP, a SHP, and 11 MHP) are displayed when the pile top displacement is equal to 5 mm(Figs. 15a) and 50 mm (Fig. 15b). With the increase of the helix number, the bearing mode under the axial compression load gradually changes from the IBM to the CSM for the MHP.Once the CSM is formed,increasing the helix number will have little effect on the bearing capacity of helical piles.The soil at the edge of the helix forms an axial shear zone, and the bearing capacity of the pile depends on the length of the shear zone(the distance between the lower and the top helix) and the strength of the soil for CSM.
Under different pile depths(i.e.15 m,30 m,and 50 m)and the relative densities, the ultimate bearing capacities of helical piles all present the trend. When the helix spacing ratio is relatively small,the bearing capacity is basically the same(Figs.16-18).But when the helix spacing ratio exceeds a certain value, the bearing capacity decreases as the helix spacing ratio increases (Figs.16-18). The bearing capacity of helical piles does not vary with the helix spacing ratio,and the bearing mode of helical piles is a CSM(Figs. 16-18). When the bearing capacity of the helical pile decreases significantly with increase of the helix spacing ratio, the helical piles present an IBM under the compression load(Figs. 16-18). The bearing capacity of the helical pile remains basically the same after the helix number increases to a certain value and the bearing capacity of the helical pile reaches the maximum. In order to maximize the bearing capacity of the helical pile and to avoid too many helices, there is an optimal value for the helix spacing ratio. The maximum helix spacing ratio (i.e.minimum of helix number) that helical piles can achieve maximum bearing capacity is the optimal helix spacing ratio.The optimal inter-helix spacing varies with the depth of helical pile and the strength and stiffness of sand around the pile in FEM results.
The optimal inter-helix spacing ratio under different pile depths and relative densities obtained by the FEM is compared with the proposed method using the cavity expansion (Figs.16-18).
The proposed method based on the cavity expansion can distinguish the CSM and the ISM. This method is particularly suitable for dense and medium-dense sand(Figs.16-18).In loose sand,the results of using cavity expansion method are smaller than those of the finite element results (Figs. 16-18). The proposed method should be used with caution in the case of the loose sand.The cavity expansion method was developed based on the local shear failure mode of the pile tip (Yang et al., 2005). This method involves the compressibility of sand, variation of shear modulus with strain,confining pressure, and stress level, which is in line with the real mechanical conditions of the pile.
5. Conclusions
Based on the Meyerhof pile foundation and cavity expansion theory, the optimal inter-helix spacing for helical piles was evaluated in this study. Two theoretical methods were compared with the available data in previous studies, and the applicability of the two methods was discussed. The centrifuge test and the FEM of helical piles in Congleton HST95 sand were used to verify the proposed method. The following conclusions are drawn:
(1) The Meyerhof pile foundation theory only considers the effect of sand strength (or sand relative density) on the optimal inter-helix spacing.The upper influence zone of the inter-helix is obviously smaller than the lower influence zone, and the optimal inter-helix spacing ratio is significantly larger than that of available data in literature. The Meyerhof pile foundation theory is not suitable for evaluating the influence zone and the optimal spacing of the inter-helix.
(2) The proposed method based on the cavity expansion theory considers the physico-mechanical properties of sand (i.e.fines content, strength, compressibility, and stress related small strain stiffness of sand) and installation depth of pile.The evaluated optimal spacing ratio increases with increase of sand strength and decreases with increase of pile depth and fines content,which is consistent with the available data in literature. The evaluation of the influence zone of the inter-helix is consistent with the influence range adopted by the LCPC method, which provides theoretical basis for evaluating the bearing capacity of helical piles.(3) The analytical solution to the optimal inter-helix spacing ratio obtained from the proposed method based on the cavity expansion theory is 2.2 for helical piles in dense Congleton HST95 sand (i.e.Dr= 73%), which is very close to the medium value in the range of 2-2.5 inferred from centrifuge tests. Moreover, the optimal inter-helix spacing ratios determined by the proposed method are consistent with the deductions from the finite element simulations of helical piles in three relative densities of Congleton HST95 sand (i.e.Dr= 30%, 55%, and 80%) and at three pile depths(i.e.Lh= 15 m, 30 m, and 50 m) performed to analyze the relationship between the compression bearing capacity of piles and the helix spacing ratio.
Declaration of competing interest
The authors declare that they have no known competing financial interests or personal relationships that could have appeared to influence the work reported in this paper.
Acknowledgements
Financial support from the National Natural Science Foundation of China(Grant Nos.52078427,51978588 and 41901073)is greatly acknowledged.
List of symbols
AParameter reflecting the effect of the fine content in sand
AeqCross-sectional area of the solid pile
ApThe cross-sectional area of the central shaft
BCharacteristic parameters in Eq. (18)
CCharacteristic parameters in Eqs. (20) and (21)
cSoil effective cohesion
ciInterface effective cohesion
DStraight-shafted pile diameter
DcCentral shaft diameter
DhHelix diameter
DrSand relative density
E50Secant stiffness
EeqEquivalent Young modulus of the solid pile
EoedOedometer stiffness
EpYoung’s modulus of central shaft material
EurUnloading/reloading stiffness
FCharacteristic parameters in Eqs. (20) and (22)
GShear modulus
G0Shear modulus with small strain
HeffEffective length of the central shaft
IrRigidity index
KhLateral earth pressure coefficient
LInstallation depth of pile
LhInstallation depth of lower helix (≈L)
mMaterial parameter
nParameters related to the plasticity index in Eq. (23)
p0Confining pressure
paReference pressure
IpSoil plasticity index
puUltimate pressure of cavity expansion
Qcultimate compression capacity of piles
qSurcharge of top boundary in numerical simulation
QbSum of pile tip and helix bearing resistance (or helix bearing resistance)
qbPile tip bearing capacity
QcsCylindrical shear resistance
QsSide friction of central shaft
RinterStrength reduction factor of the interface
RpRadius of the plastic zone in cavity expansion method
RuRadius of the limiting state region in the cavity expansion method
SInter-helix spacing
S1Upper influence zone
S2Lower influence zone
SopOptimal inter-helix spacing
tcCentral shaft wall thickness
thHelix thickness
vPoisson’s ratio
α Angle between the wedge and the helix
γ Shear strain
γ0.7Reference shear strain
γdTotal unit dry weight
γsteelSteel unit weight
δ Interface friction angle
Δ Average volumetric strain
η Function of φcvin cavity expansion method
λ Relative plastic zone radius (Rp/Ru)
σ0Axial pressure
φ Soil friction angle
φcvCritical state friction angle
φpPeak friction angle
χ Characteristic parameters in Eq. (18)
ψ Dilatancy angle
CPT Cone penetration test
CSM Cylindrical shear mode
IBM Individual bearing mode
MHP Multi-helix pile
SHP Single-helix pile
SSP Straight-shafted pile
FEM Finite element method
 Journal of Rock Mechanics and Geotechnical Engineering2022年3期
- Journal of Rock Mechanics and Geotechnical Engineering的其它文章
- Editorial for Advances and applications of deep learning and soft computing in geotechnical underground engineering
- A review of methods, applications and limitations for incorporating fluid flow in the discrete element method
- Numerical modeling of contaminant advection impact on hydrodynamic diffusion in a deformable medium
- A modified Kozeny-Carman equation for predicting saturated hydraulic conductivity of compacted bentonite in confined condition
- Geotechnical particle finite element method for modeling of soilstructure interaction under large deformation conditions
- Structural,volumetric and water retention behaviors of a compacted clay upon saline intrusion and freeze-thaw cycles