
Serological profiling of Crohn’s disease and ulcerative colitis patients reveals anti-microbial antibody signatures
2022-08-13 07:04:40MahasishShomeLushengSongStacyWilliamsYunroChungVelMuruganJinParkWilliamFaubionShabanaPashaJonathanLeightonJoshuaLaBaerJiQiu
World Journal of Gastroenterology 2022年30期
Mahasish Shome, Lusheng Song, Stacy Williams, Yunro Chung, Vel Murugan, Jin G Park, William Faubion,Shabana F Pasha, Jonathan Leighton,Joshua LaBaer, Ji Qiu
Abstract
Key Words: Inflammatory bowel disease; Anti-microbial antibody; Protein microarray; Crohn’s disease;Ulcerative colitis; Gut microbiome
lNTRODUCTlON
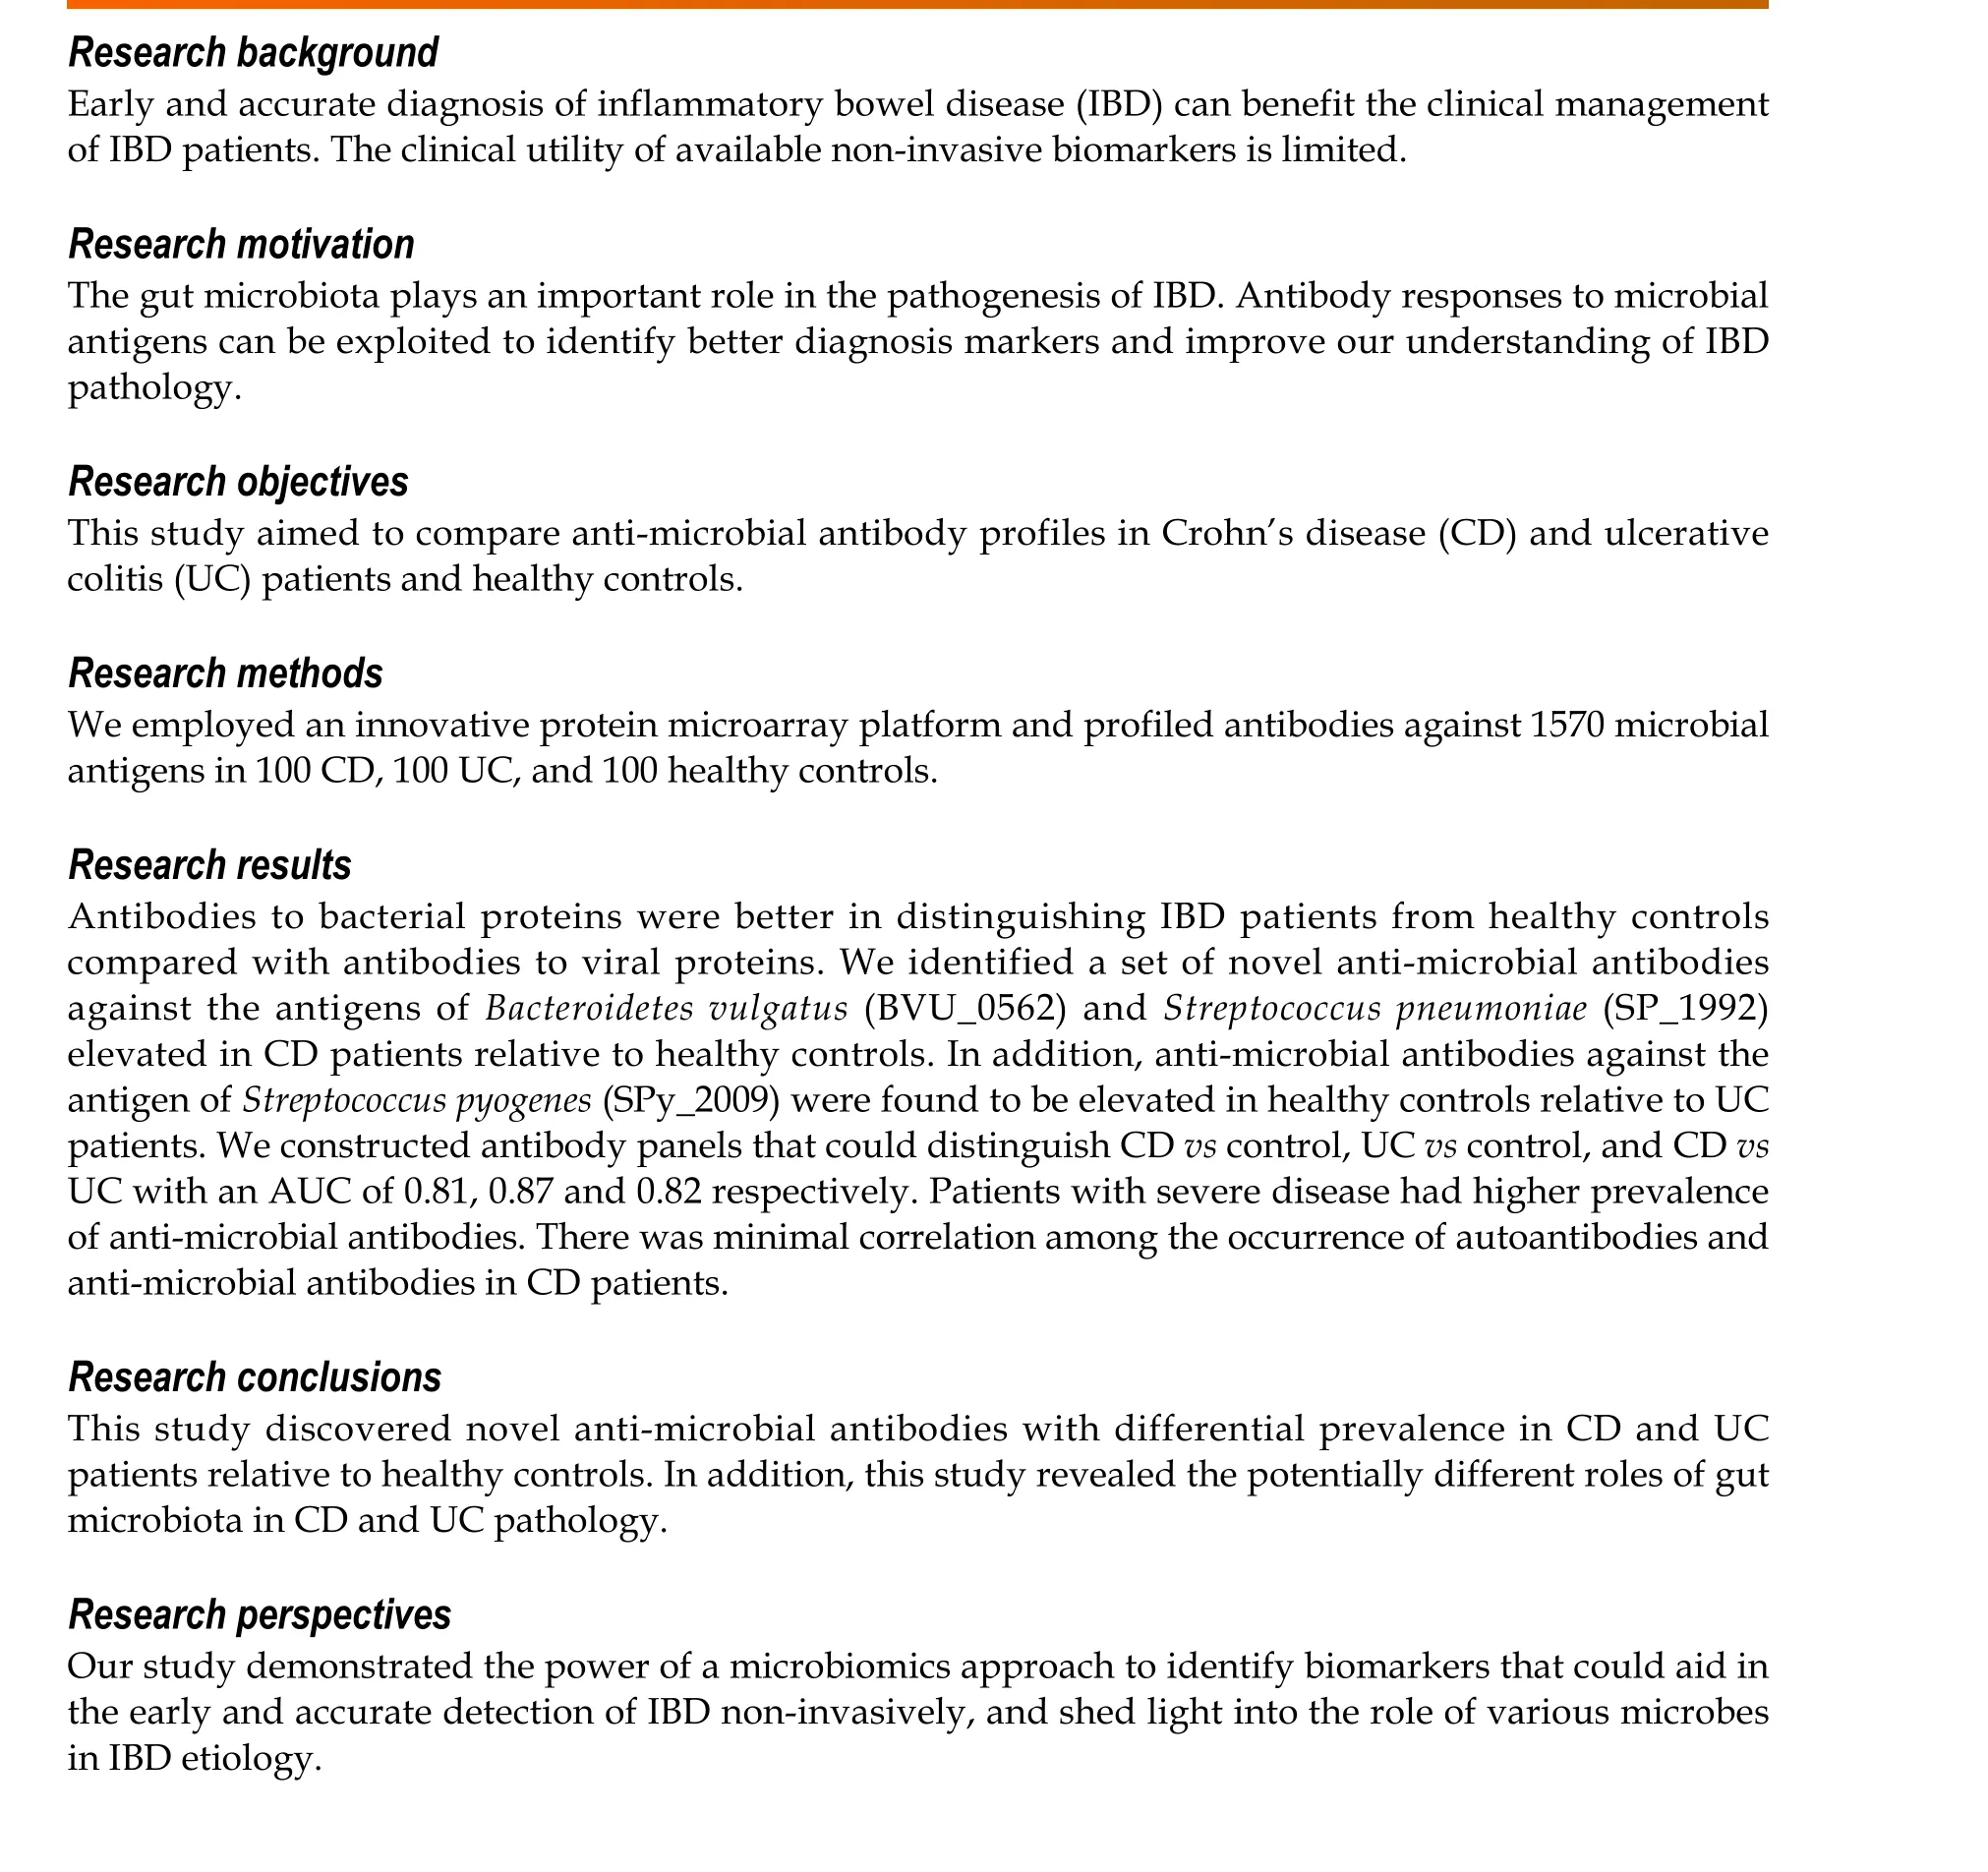
Inflammatory bowel disease (IBD) represents a group of intestinal disorders that causes chronic inflammation in the digestive tract. The two main clinical phenotypes are ulcerative colitis (UC) and Crohn’s disease (CD). The public health burden of IBD is rising globally[1]. Early and accurate diagnosis is key to reducing this burden. Gastroenterologists often use a combination of relatively invasive procedures,like ileocolonoscopy with biopsy for diagnosis, and to determine the disease extent and activity. There is a need for serological biomarkers that can reveal the disease state non-invasively. Herein, our objectives were to discover anti-microbial antibody signatures in IBD patients and understand the association of microbial infection with IBD pathogenesis.
IBD is caused by a combination of genetic predisposition, faulty immune responses, and environmental factors[2]. The interaction of microbes with the gut mucosa in a genetically susceptible individual and the corresponding immune response play a pivotal role in the initiation and progression of IBD[3]. After birth, a limited diversity microbial community develops into a complex community due to the influence of diet and environmental factors[4]. During the second or third decade of life, a dysbiosis is observed in IBD patients which leads to an imbalance between commensal and potentially pathogenic microorganisms[5]. The healthy gut microbiota predominately comprises Firmicutes and Bacteroidetes, and to a lesser extent, Actinobacteria and Proteobacteria[6,7]. In IBD, dysbiosis is observed with reduced abundance of Firmicutes and either higher or similar abundance of Proteobacteria. Besides compositional changes, genetic alterations also contribute to gut dysbiosis that leads to disease initiation and progression. For example, NOD2 variants were found in 20%-40% of European and American CD patients[8,9]. NOD2 encodes an intracellular receptor for the bacterial peptidoglycan muramyl dipeptide, which helps maintain the balance of commensal bacterial flora[10].
Immune response to microbes results in the production of antibodies to microbial antigens[11]. Anti-Saccharomyces cerevisiaeantibodies (ASCA) are associated with CD patients, with sensitivities and specificities ranging between 55% to 65% and 80% to 95%, respectively[12]. Perinuclear antineutrophil cytoplasmic antibodies (pANCA) are associated with UC patients, with sensitivities and specificities ranging between 50% to 71% and 75% to 98%, respectively[13]. Outer membrane protein ofEscherichia coli(OmpC) and flagellin (CBir1) antibodies are prevalent in CD patients, with prevalence ranging between 24%-55% and 50%-56%[13]. The number and response magnitude of anti-microbial antibodies have previously been shown to indicate the presence of IBD, its severity and its clinical course; however,the clinical utility of available antibodies in diagnosis and clinical management of IBD patients has been limited. The techniques used to discover the known anti-microbial antibodies associated with IBD are of low throughput, and have only been applied to test on small number of candidate microorganisms or microbial antigens[14]. We have performed a large-scale comparative profiling of anti-microbial antibodies in CD and UC patients and healthy controls using an innovative protein microarray technology, namely Nucleic Acid Programmable Protein Array. We selected 1570 microbial proteins from our microbial protein collection (DNASU.org) from 50 bacteria and 33 viruses based on preliminary studies in our laboratory and a review of the literature, displayed them on microarrays and probed them against 100 CD, 100 UC and 100 healthy control serum samples.
MATERlALS AND METHODS
Patients and samples
All the serum samples were acquired from Serum Biobank at Mayo clinic with approval from institutional review board. CD patients were randomly selected, followed by age and gender matched healthy controls and UC patients. The samples (100 CD, 100 UC and 100 controls) were divided evenly into two non-overlapping discovery and validation sets randomly (Table 1). Disease status for study participants was assessed by clinicians at Mayo clinic.
Microbial protein array fabrication
We analyzed 1570 microbial proteins, of which 1173 proteins were from 50 different species of bacteria,397 proteins were from 33 different species of viruses and the remaining proteins were autoantigens.These proteins were selected from our large collection of microbial antigens (DNASU.org) with reference to our anti-microbial antibody studies on other diseases (unpublished data). Microbial protein arrays were fabricated as described earlier[15,16]. Briefly, plasmids with genes of interest cloned in the pANT7_cGST expression vector were obtained from the DNASU plasmid repository, prepared, and printed into silicon nanowells using a piezoelectric dispensing system to produce microbial protein arrays. On the day of experiment, proteins were freshly expressed from printed plasmids using aninvitrotranscription and translation protein expression kit (Fisher Scientific) and captured by anti-GST antibody co-printed in each nanowell. After expression, microarrays were incubated with 1:100 diluted serum samples. We randomized the case and control serum samples while profiling on microarray to reduce bias. IgG and IgA anti-microbial protein antibodies were detected by Alexa-647 goat anti-human IgG (H+L) and Cy3 goat anti-human IgA (Jackson ImmunoResearch). After washing and drying, the microarrays were scanned in a Tecan PowerScanner and the raw fluorescence intensity data were extracted using the ArrayPro Analyzer Software. Raw fluorescence intensity of each protein on the microarray was divided by the median intensity of all the proteins on the microarray for normalization.The normalized value was termed as Median Normalized Intensity (MNI) and used for all analysis.Seropositivity of antibody for a particular antigen was defined as MNI ≥ 2 as we have done for our other studies[17,18].
Statistical analysis
Pairwise comparisons of numbers of IgG or IgA antibodies for each bacterial species among the 3 subject groups were performed using Chi-squared tests to assess statistical significance (Supplementary Figure 1). For each pairwise comparison, the Chi-squaredPvalues were adjusted using the FDR (false discovery rate) method to reduce the likelihood of false positives. In addition to the multiple comparison adjustment at the antibody level, we performed adjustment at the species level.
For univariate analysis between two comparison groups, we calculated sensitivity for one group at the 96th percentile of the other group or the MNI of 2, whichever was larger. Antibodies with ≥ 14%sensitivity in the discovery set were selected as candidates for further validation. If an antibody had ≥14% sensitivity at 96% specificity in both discovery and validation sets, then it was considered as a“validated marker”. Venn diagram for the overlap of microbial antigen targets were plotted using Venny[19].
We used a three-stage approach to build our multi-antibody panels. In the first stage, we selected all candidate biomarkers that passed the criteria above,i.e., sensitivity was greater or equal than 14% at 96% specificity. Next, we applied the minimum redundancy maximum relevance algorithm to further select biomarkers that were possibly the most important and least correlated[20]. In the third stage, wefit a logistic regression model using the selected biomarkers from the first two stages and generated its receiver operating characteristic curve and AUC value to evaluate the model’s discriminatory performance between CD, UC, and healthy controls.

Table 1 Clinical information of the samples
Pair-wise subgroup comparisons based on the Montreal classification were performed for the odds ratio (OR) of each antibody using the seropositivity threshold defined as the maximum of MNI 2 and the 75thpercentile of all samples. Chi-squared tests were used to test global significance between all groups with a slight modification by adding 0.5 to each cell of the table to avoid zero cell counts.Pvalues from the Chi-squared method were adjusted for each pair of comparisons and for all candidate biomarkers. The number of antibodies with significant difference in prevalence among classifications were counted based on OR > 1 and OR < 1 for each pair of classification of CD behavior, CD location,UC extent and the surgery history of CD patients. The difference in total number of antibodies with significant difference between classification groups were computed using two sample proportion test.We did not perform a subgroup analysis for the UC patients based on the surgery history because most(84 out of 100) had no surgeries (Table 1).
Spearman’s rank correlation analysis was performed to assess the correlation between autoantibody and anti-microbial antibody reactivity for CD patients and healthy controls. The R “pheatmap” package was used to generate the heatmap for correlation coefficients.
Bioinformatics analysis
The NCBI Taxonomy browser was used to find the taxonomical details of all the bacteria and viruses used in our study. The taxa were downloaded as phylip tree file and was used as an input in interactive tree of life software. Two phylogenetic trees were created for bacteria and viruses with different colors distinguishing the phylum.
For sequence homology analysis, a pair-wise BLAST analysis was carried out on the antigen protein sequences of validated antibodies for CDvshealthy control analysis. E-values were used to generate a heatmap using Python Seaborn package.
RESULTS
Anti-microbial antibody profiling in IBD on microbial protein arrays
We studied IgG and IgA anti-microbial antibody profiles of 100 CD and 100 UC patients and 100 agegender matched healthy controls (Table 1) against 1570 microbial antigens including 1173 antigens from 50 different bacteria and 397 antigens from 33 different viruses using our protein microarray platform(Figure 1, Supplementary Table 1). This study provided a representative overview of the anti-microbial antibody response in IBD patients (Supplementary Figure 1). The numbers of IgG antibodies against bacterial proteins fromBacteroidetes vulgatus(B. vulgatus) andCitrobacter koseri(C. koseri) were significantly higher in CD patients compared with those in healthy controls (Chi-square test,P< 0.01)(Supplementary Figure 1). On the contrary, the numbers of IgG antibodies against proteins from several bacteria, such asStreptococcus pneumoniae(S. pneumoniae),Haemophilus influenza(H. influenzae),Staphylococcus aureus(S. aureus),Helicobacter pylori(H. pylori) andParvimonas micra(P. micra) were significantly lower in CD and UC patients compared with those in healthy controls (Chi-square test,P< 0.05)(Supplementary Figure 1). Overall, fewer IgA anti-microbial antibodies were found than IgG antibodies.The numbers of IgA antibodies againstS. pneumoniae,H. influenzae,S. aureus, andH. pyloriwere significantly lower in UC patients compared with those in healthy controls (Chi-square test,P< 0.01).On the other hand, anti-viral IgG and IgA antibodies showed heterogenous prevalence with no clear trend of differences among CD, UC, healthy controls (data not shown). Therefore, we focused our analysis on anti-bacterial antibodies.

Figure 1 Phylogenetic tree of microbes studied with their corresponding number of proteins analyzed. A: Fifty species of bacteria with 1173 proteins were segregated into 6 phyla; B: Thirty-three species of viruses with 397 proteins were segregated into 10 phyla.
Antibodies distinguishing CD from healthy controls
We compared prevalence for individual anti-microbial antibodies between CD patients and healthy controls. We randomly split samples evenly into discovery and the validation sets (Table 1). For antibodies with elevated prevalence in CD patients, 13 IgG antibodies passed the criteria (sensitivity ≥14% at 96% specificity) in both discovery and validation sets (Table 2). Anti-A4-Fla2_IgG, a well-studied anti-bacterial flagellin antibody in CD, had the best performance with 47% sensitivity at 96% specificity in the full sample set (Table 2). Beside the flagellins, we found antibodies to four novel target antigens fromB. vulgatus(BVU_0562),P. mirabilis(PMI_RS06815),S. flexneri(SF_Lpp) andS. pneumoniae(SP_1992) (Table 2) with no significant sequence homology to flagellins (Figure 2A).
To our surprise, 12 validated IgG antibodies showed elevated prevalence in healthy controls relative to CD patients (Supplementary Table 2). Among these 12 antibodies, anti-bacterial antibodies performed better in differentiating CD patients from healthy controls than anti-viral antibodies(Supplementary Table 2). Antibody against SPy_2009, an anchoring protein located in the cell wall ofStreptococcus pyogenes(S. pyogenes), had the highest sensitivity of 24% at 96% specificity in healthy controls relative to CD patients. Seven validated IgA antibodies showed higher prevalence in healthy controls relative to CD patients (Supplementary Table 4).
Antibodies distinguishing UC from healthy controls
For anti-microbial antibodies with elevated prevalence in UC patients relative to healthy controls, 4 IgG antibodies passed the criteria in both discovery and validation sets (Table 2). Antibodies to A4-Fla2_IgG and a flagellin fromC. koserihad a sensitivity of 18% and 15% respectively. For IgG antibodies with higher prevalence in healthy controls relative to UC patients, 32 antibodies got validated(Supplementary Table 3). Source microorganisms for the target antigens of these 32 antibodies were enriched forS. pneumoniae, S. aureus,andH. influenzae(2-sample proportion test,P< 0.05). 2.7% of the proteins on the microbial protein microarray were fromS. pneumoniaewhile 18.7% of antigens for validated antibodies were fromS. pneumoniae, 6.1% of the proteins on the microarrays were fromS.aureuswhile 18.7% of antigens for validated antibodies were fromS. aureus,and 1.4% of the proteins on the microarrays were fromH. influenzaewhile 12.5% of antigens for validated antibodies were fromH.influenzae. Nine validated IgA antibodies showed higher prevalence in healthy controls relative to UC patients (Supplementary Table 4).
Fewer anti-viral antibodies than anti-bacterial antibodies were validated comparing CD or UC patients with healthy controls (Table 2, Supplementary Tables 2 and 3). Anti-viral antibodies to Rhinovirus B14, Enterovirus C, Influenza A virus, Human metapneumovirus had higher prevalence in healthy controls compared with CD and UC patients (Supplementary Tables 2 and 3).
Comparison of anti-microbial antibody response between CD and UC
We found 46 IgG and 22 IgA validated anti-microbial antibodies with higher prevalence in CD patients compared to UC patients while 28 IgG and 9 IgA validated anti-microbial antibodies with higher prevalence in UC patients compared to CD patients. There was minimal overlap of the target antigens of these validated IgG and IgA antibodies (Figure 2B).
Multivariate analysis to distinguish CD, UC, and healthy controls
We built multi-antibody panels that could distinguish CDvscontrol, UCvscontrol, and CDvsUC with an area under the curve (AUC) of 0.81, 0.87, and 0.82 respectively. For CDvscontrol, antibodies against novel flagellins (HP_0115, CK_LafA, CK_LafA.1, VC_flaD, VC_flaB, VC_flaE, VC_flaA) had an AUC of 0.73, antibodies against non-flagellins (BVU_0562, SP_1992, PMI_RS06815, and SF_Lpp) had an AUC of 0.75 and the combined AUC of antibodies against novel flagellins and non-flagellins was 0.81(Figure 3A). For UCvscontrol, a combination of seven antibodies, four againstS. pneumoniaeand one each againstS. aureus,H. influenzaeandB. vulgatushad an AUC of 0.87 (Figure 3B). For CDvsUC,combination of seven antibodies, two againstH. pyloriand one each againstE. coli,S. pneumoniae,S.pyogenes,C. jejuniandL. bacterium A4had an AUC of 0.82 (Figure 3C).
Subgroup analysis
We investigated the association of CD behavior (B1, B2, B3), CD location (L1, L2, L3), and UC extent (E1,E2, E3) based on the Montreal classification with the anti-microbial antibody prevalence. We calculated the 4thquartile odds ratio for each antibody between the two classification groups and compared the number of antibodies with significant odds ratio (Pvalue < 0.05) in each group. We found B3(penetrating) had the highest prevalence of antibodies followed by B2 (stricturing) and B1 (non-stricturing, non-penetrating) (Table 3). For CD location, we found L2 had the highest prevalence of antibodies followed by L3 (ileocolonic) and L1 (Table 3). For UC extent, E3 (extensive UC) had higher prevalence of antibodies compared to E2 (left sided UC). In addition to the Montreal classification, we also performed subgroup analysis based on the surgery history of CD patients. We found that patients who had surgery possessed higher prevalence of antibodies compared to those without surgery(Table 3).
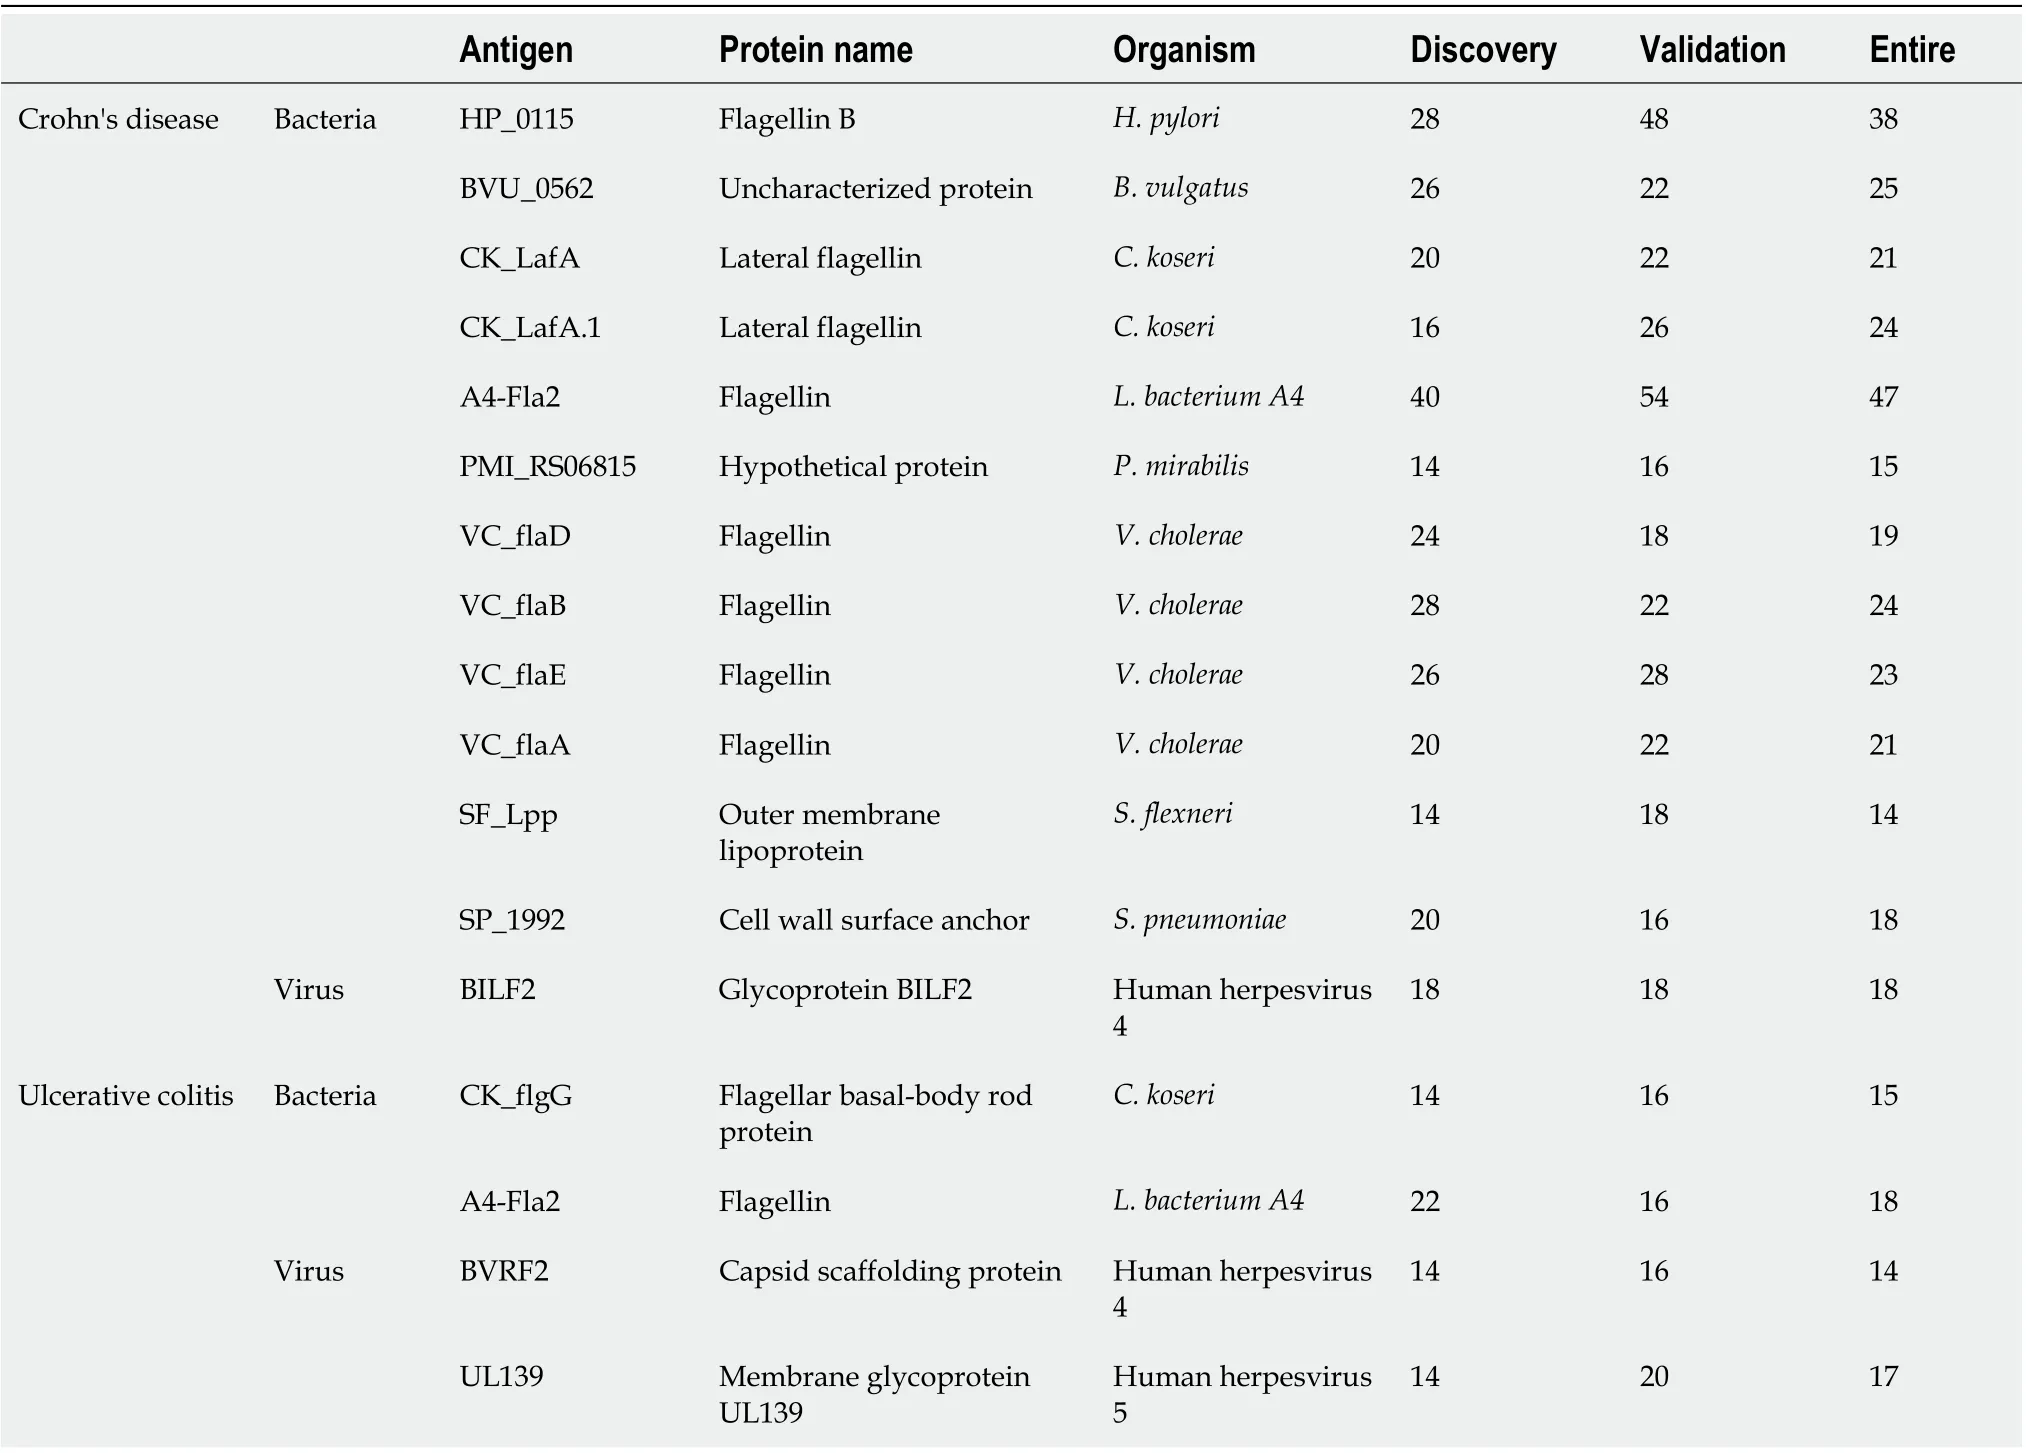
Table 2 Sensitivities of validated lgG antibodies comparing Crohn’s disease and ulcerative colitis with healthy controls in the discovery, validation, and the entire set at 96% specificity
Correlation of anti-microbial antibodies and autoantibodies in CD patients
We previously reported novel autoantibodies in CD patients using the same set of CD patients and healthy controls[21]. We profiled both IgG and IgA autoantibodies and anti-microbial antibodies in all 100 CD and 100 healthy controls. It is interesting to note the antibodies showing differences for autoantibodies were mostly IgA, but the anti-microbial antibodies were mostly IgG[21]. Anti-SNRPB_IgA had the highest sensitivity of 20% at 96% specificity among all autoantibodies compared with 47% sensitivity at 96% specificity for the best performing anti-microbial antibody, anti-A4-Fla2_IgG.
We compared the novel autoantibodies and validated anti-microbial antibody profiles to determine if correlation existed between their reactivity. Overall, we did not observe high correlation between autoantibodies and anti-microbial antibodies in CD patients (Figure 4). Anti-microbial antibodies formed two clusters, one with anti-flagellin antibodies, and the other with SF_Lpp_IgG and PMI_RS06815_IgG. Five autoantibodies, PRPH_IgA, SNAI1_IgA, PPP1R13L_IgA, SNRPB_IgA and PTTG1_IgA, formed a cluster. The remaining antibodies had relatively unique reactivity patterns.
DlSCUSSlON
We have performed a microbiomics study to understand the connection between host anti-microbial responses and IBD and to identify antibody signatures that can aid in the accurate diagnosis of IBD. We found antibody responses to novel non-flagellin antigens with elevated prevalence in CD patients compared with healthy controls. On the contrary, we observed many anti-microbial antibodies withlower prevalence in UC patients relative to healthy controls. We built antibody panels that could distinguish CDvscontrol, UCvscontrol and CDvsUC with AUCs of 0.81, 0.87, and 0.82, respectively.Lichtensteinet al[22] reported an integrated serological (ASCA-IgA, ASCA-IgG, anti-OmpC, anti-CBir1,anti-I2, pANCA) and genetic (SNP8, SNP12, SNP13) marker panel with an AUC of 0.80 to distinguish CDvscontrol. A panel of serological markers (ASCA-IgA, ASCA-IgG, ANCA, pANCA, OmpC, and CBir1) built by Plevyet al[23] yields an AUC of 0.78 to distinguish CDvsUC. Our novel antibody marker panels had comparable or better performance in IBD diagnosis or distinguishing CD from UC subtypes. We observed a stronger anti-microbial antibody response with more aggressive disease in both CD and UC patients. Finally, we demonstrated that anti-microbial antibodies and autoantibodies had different reactivity patterns in CD patients.
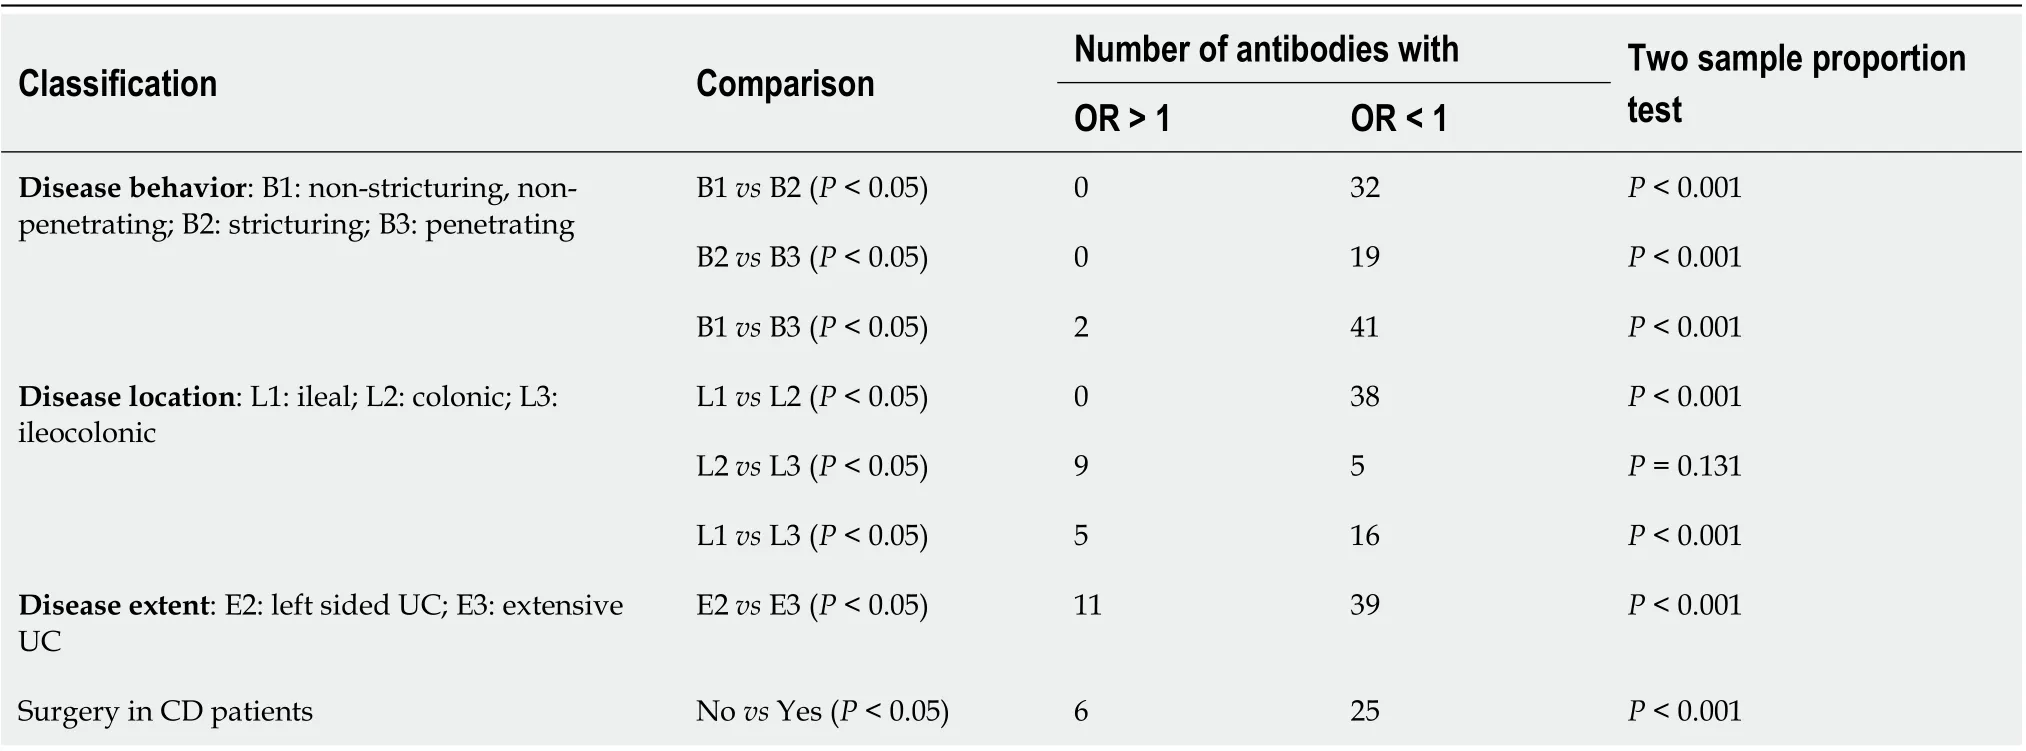
Table 3 Subgroup analysis of inflammatory bowel disease patients

Figure 2 Sequence homology of target antigens of validated antibodies and overlap of antibodies among Crohn’s disease and ulcerative colitis. A: Heatmap showing sequence homology among target antigens for antibodies with validated performance of ≥ 14% sensitivity at 96% specificity comparing Crohn’s disease (CD) patients with healthy controls; B: CD_IgG, ulcerative colitis (UC)_IgG, CD_IgA and UC_IgG represent the overlap of anti-microbial antibodies of IgG and IgA isotypes in CD and UC patients with ≥ 14% sensitivity at 96% specificity against healthy controls in the discovery set. CD: Crohn’s disease; UC:Ulcerative colitis.

Figure 3 Receiver operating characteristic curves to discriminate Crohn’s disease, ulcerative colitis, and healthy controls. A: Receiver operating characteristic (ROC) curve for Crohn’s disease (CD) vs healthy controls. Area under the curve (AUC) values of novel anti-flagellin antibodies (HP_0115,CK_LafA, CK_LafA.1, VC_flaD, VC_flaB, VC_flaE, VC_flaA) and anti-non-flagellin antibodies (BVU_0562, SP_1992, PMI_RS06815, SF_Lpp) was 0.73 and 0.75,respectively. The AUC value obtained with a combination of novel anti-flagellin and anti-non-flagellin antibodies was 0.81; B: ROC curve for ulcerative colitis (UC) vs healthy controls. The AUC value obtained with a combination of 7 markers was 0.87; C: ROC curve for CD vs UC. The AUC value obtained with a combination of 7 markers was 0.82.
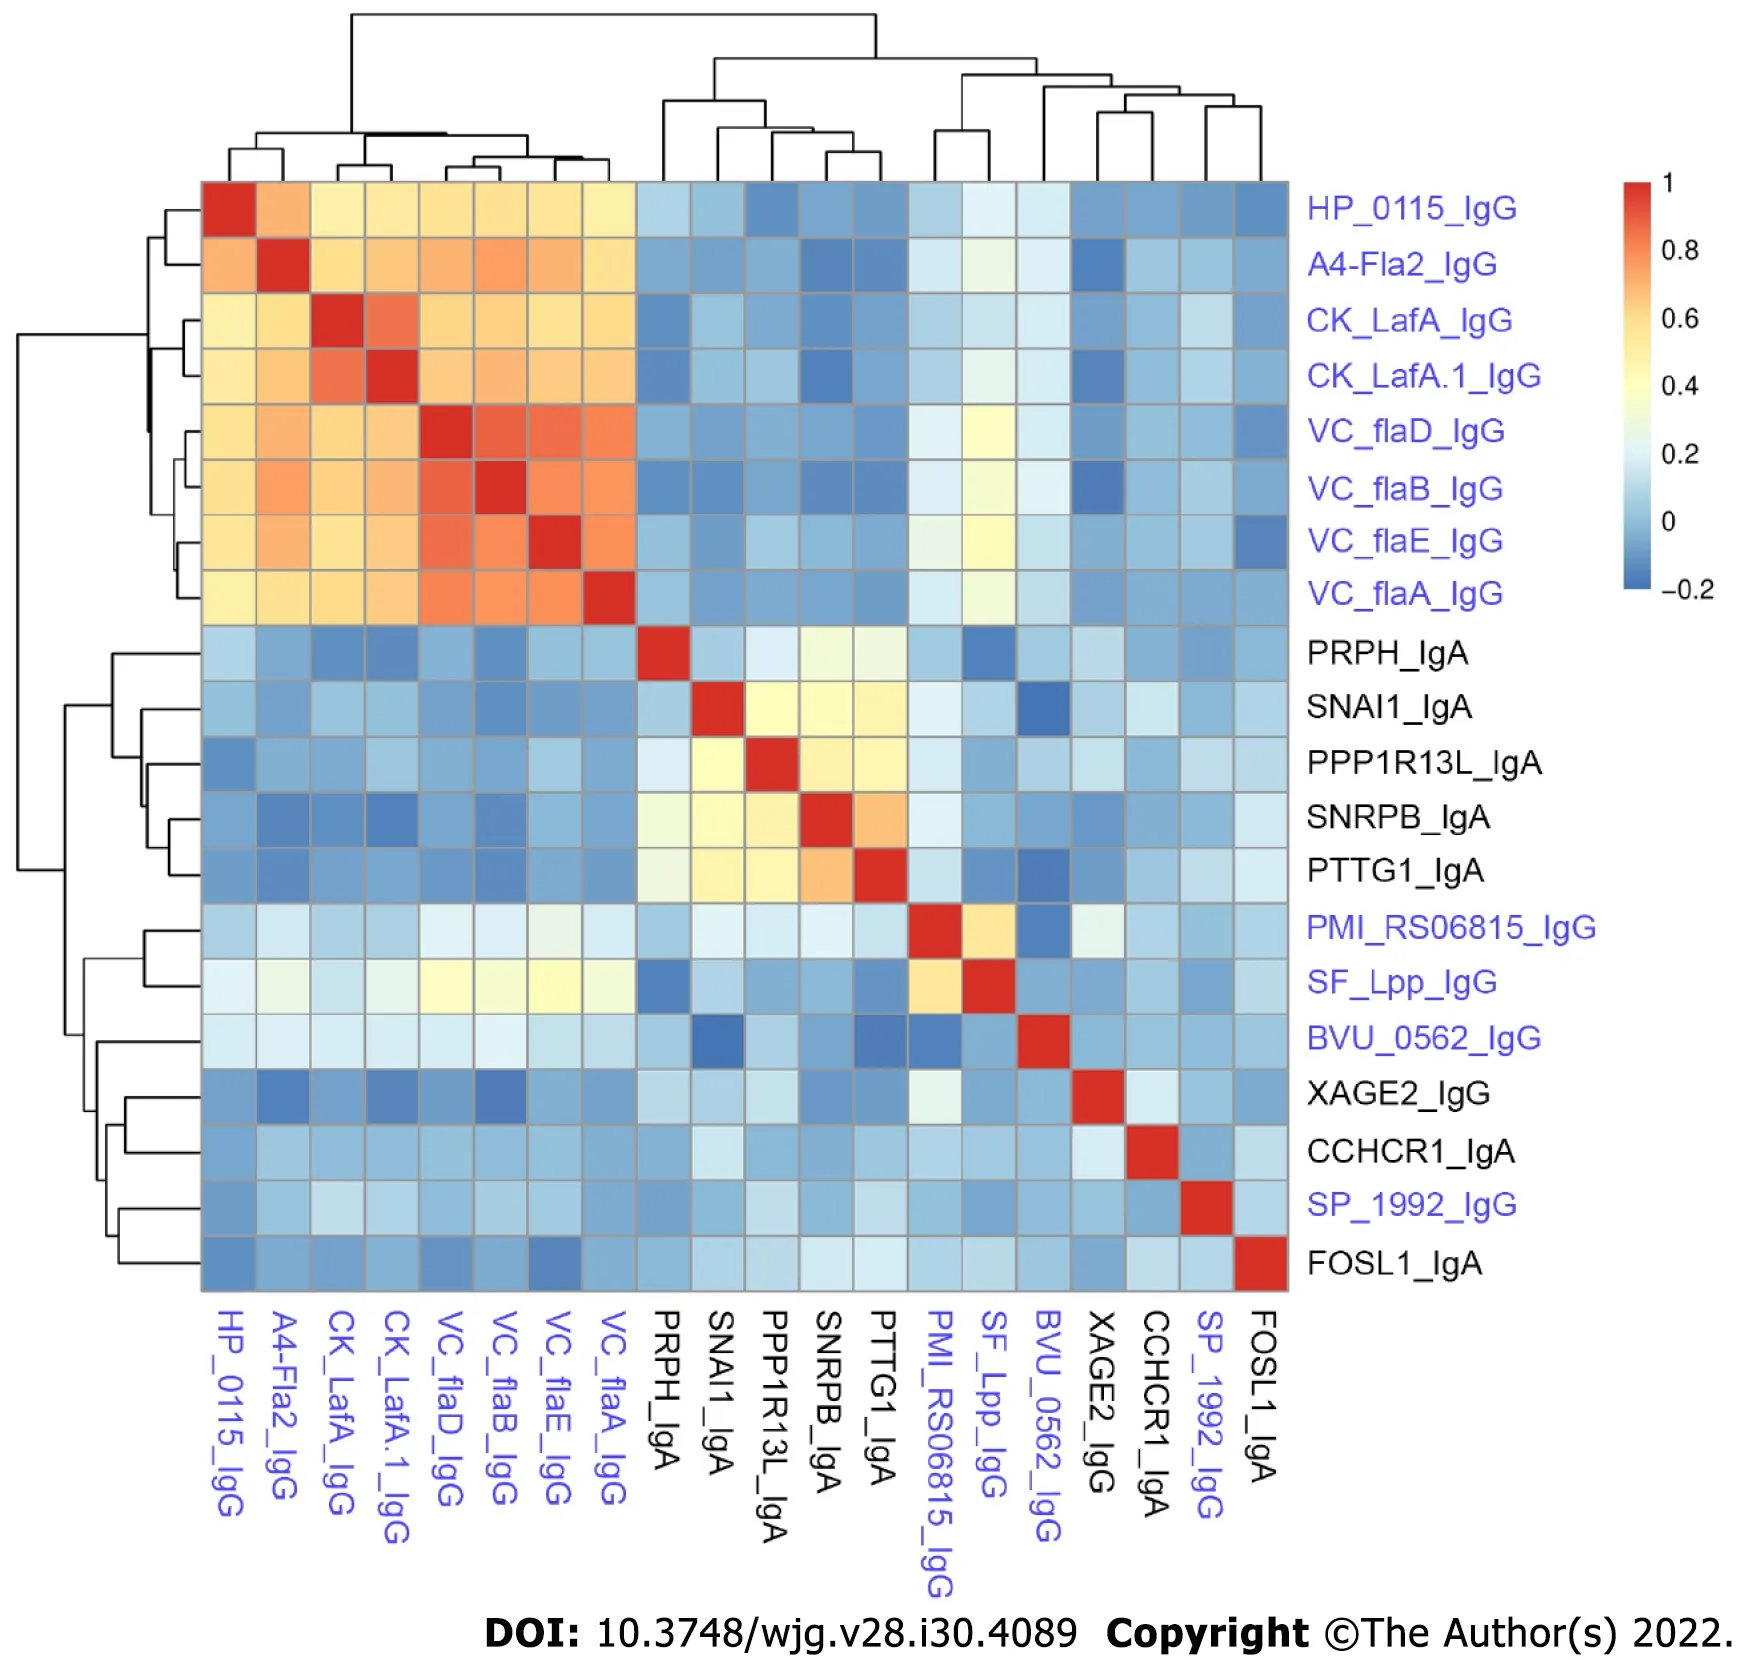
Figure 4 Spearman’s rank correlation coefficient heatmap of anti-microbial antibodies and autoantibodies in Crohn’s disease patients.The names of anti-microbial antibodies are colored in blue while autoantibodies are colored in black.
Our comprehensive study of anti-microbial antibodies in IBD patients provided interesting insight into its pathogenesis. Antibody responses to proteins fromB. vulgatus,P. mirabilis,S. flexneriandS.pneumoniaewere elevated in CD patients.B. vulgatushas been reported to induce colitis in IBDsusceptible mice[24,25].P. mirabilisin gut can induce inflammation in cells and a colitis mouse model and has been associated with CD pathogenesis[26]. Our results suggest thatB. vulgatusandP. mirabilismay also play a role in human CD development. We observed reduced antibody responses in UC patients to several genera of the Firmicutes phylum includingP. micra,S. pyogenes, S. aureus,which were often reduced in abundance in UC patients’ gut microbiota[27]. For several genera belonging to Proteobacteria phylum, such asH. influenzae,H. pylori,K. oxytoca,we observed overall reduced antibody responses; however, their abundance in the gut microbiota of UC patients has been reported to be either increased or remained the same compared with healthy controls[6,28].
Beyond exposure alone, antibody response requires functional immunological interaction between a microorganism and the host; however, anti-microbial antibodies by themselves do not prove causality.As such, source microorganisms whose antibodies show significant changes between IBD patients and healthy controls warrant future confirmation and functional assessment in causing IBD. A4-Fla2 flagellin included in our study showed IBD-specific prevalence with performance similar to that reported in the literature[14,29]. We also identified several antibodies to flagellins with higher prevalence in CD patients relative to healthy controls.
Previous studies mostly focused on antibodies with higher prevalence in IBD patients[30]. Our unbiased data-driven approach revealed the existence of many anti-microbial antibodies with higher prevalence in healthy controls relative to CD and especially UC patients (Supplementary Tables 3 and 4). The reduction observed in CD and UC patients may be attributed to the dysbiosis and reduced diversity of gut microbiota in CD and UC patients[28,31]. It is also possible that the reduction in antimicrobial antibodies in some CD and UC patients was in part because of immunosuppressive therapies they received. The greater number of antibodies having high prevalence in CD patients compared with UC patients indicates stronger anti-microbial humoral immunity in CD than in UC, which is consistent with reports in the literature that most known anti-microbial antibodies, such as ASCA, anti-OmpC,anti-Cbir1, and anti-I2, had higher prevalence in CD patients than in UC patients[30]. This agreement,together with comparable performance of anti-flagellin antibodies in our study and that reported in the literature, suggests that our results reflect the microbial association of IBD etiopathology. However, the use of samples from patients with established disease and the lack of information on immunosuppressive therapies of these patients limited the interpretation of the results.
We studied the association between anti-microbial antibody prevalence and various disease classifications based on Montreal classification and surgery history. We found more antibodies with significantly higher prevalence in patients with more aggressive disease behaviors relative to those with milder disease behavior. We also found more antibodies with significantly higher prevalence in colonic CD patients relative to those in ileal CD patients. Our results were consistent with previous reports that increasing diversity and magnitude of anti-microbial immune response was correlated with increased frequency of penetrating and/or stricturing disease behavior[13,32]. It is known that the colon has a microbial density of 1011-1012anaerobic bacteria/gram while the ileum is colonized by 107-108anaerobic bacteria/gram[7]. Kleessenet al[33] found higher percentage of bacterial invasion of mucosa in colon compared to ileum. CD patients requiring surgery usually had more severe disease compared with those who did not need surgery. Stronger anti-microbial immune response in patients with severe CD or UC suggests a higher abundance of the source microorganisms for the target antigens of the differential antibodies and/or a stronger more conducive immune microenvironment at the disease site in severe disease.
Both autoantibodies and anti-microbial antibodies associated with IBD have been reported[30]. One popular hypothesis for the autoantibody elicitation is molecular mimicry, where anti-microbial antibodies cross react with human proteins. However, we found minimal correlation between the antimicrobial antibodies and the autoantibody profiles in the same set of CD samples. The lack of correlation suggests that IBD-specific autoantibodies and anti-microbial antibodies are elicited independently through different underlying mechanisms, and cross-reactivity may play less of a role in eliciting CD-associated autoantibodies. The breakdown of immune tolerance to human proteins might have occurred due to the damaged gut epithelial cells and the faulty immunological microenvironment partly caused by microbial infections. In addition, the elicitation of autoantibodies may be associated with the infections of multiple microorganisms, and the correlation with individual anti-microbial antibodies may not be great.
Strengths of our study include the broadest analysis to date of IgG and IgA antibodies against individual antigens from many different microorganisms in both CD and UC patients and the use of a two-stage approach with discovery and independent validation of antibody markers. There are some limitations to our study. Except for a few microbes, the number of proteins studied for each species is small, which might limit our interpretation of antibody response in IBD at the species level.Furthermore, many samples used in studies were collected from patients with established disease.Future studies with access to more clinical information, such as information about the use of immunosuppressive or antibiotics treatment, could aid in the interpretation of our results. In addition,samples collected from newly diagnosed patients will strengthen our ability to identify diagnostic markers and microbial connections for IBD development.
CONCLUSlON
In summary, we have demonstrated the power of a microbiomics study of anti-microbial antibodies in IBD for the identification of anti-microbial antibody signatures to improve early accurate diagnosis and help understand IBD etiology. The elucidation of the source microorganisms of the target antigens of the antibody biomarkers could lead to novel strategies for the prevention of IBD.
ARTlCLE HlGHLlGHTS
ACKNOWLEDGEMENTS
The authors would like to thank Jessica Friton for her help with patient sample and data acquisition.The authors would like to thank Shehzad Sheikh for helpful suggestions to improve the manuscript.
FOOTNOTES
Author contributions:Shome M and Song L designed and ran the experiment; Williams S and Chung Y performed the statistical analysis; Murugan V and Park JG helped in preparation of clones; Faubion W, Pasha SF and Leighton J provided the serum samples and also provided intellectual guidance; LaBaer J and Qiu J supervised the project and secured funding; Shome M and Qiu J wrote the original manuscript which was then reviewed by remaining authors.
lnstitutional review board statement:The authors have taken appropriate steps to protect the rights and welfare of humans participating as subjects in the research (IRB Application #: 13-008267).
lnformed consent statement:All study participants or their legal guardian of the study provided informed written consent about personal and medical data collection prior to study enrollment.
Conflict-of-interest statement:All the authors report no relevant conflicts of interest for this article.
Data sharing statement:Data from this study is available on request from the corresponding author.
STROBE statement:The authors have read the STROBE Statement-checklist of items, and the manuscript was prepared and revised according to the STROBE Statement-checklist of items.
Open-Access:This article is an open-access article that was selected by an in-house editor and fully peer-reviewed by external reviewers. It is distributed in accordance with the Creative Commons Attribution NonCommercial (CC BYNC 4.0) license, which permits others to distribute, remix, adapt, build upon this work non-commercially, and license their derivative works on different terms, provided the original work is properly cited and the use is noncommercial. See: https://creativecommons.org/Licenses/by-nc/4.0/
Country/Territory of origin:United States
ORClD number:William Faubion 0000-0003-1291-5745; Ji Qiu 0000-0002-7913-9042.
S-Editor:Gong ZM
L-Editor:A
P-Editor:Gong ZM
 World Journal of Gastroenterology2022年30期
- World Journal of Gastroenterology的其它文章
- Alcohol-related diseases and liver metastasis: Role of cell-free network communication
- Benefits of minimally invasive surgery in the treatment of gastric cancer
- Contrast-enhanced ultrasound of a traumatic neuroma of the extrahepatic bile duct: A case report and review of literature
- ANGPT: Angiopoietin; VEGFA: Vascular endothelial growth factor; PGF: Placental growth factor; AFP: Alpha-fetoprotein; IQR: Interquartile range; SD:Standard deviation, SE: Standard error.
- Network meta-analysis of randomized controlled trials on esophagectomies in esophageal cancer: The superiority of minimally invasive surgery
- Hepatocellular carcinoma, decompensation, and mortality based on hepatitis C treatment: A prospective cohort study