
Potential suitable sites for the calibration of Scientific Echo Sounder in the marginal seas around Antarctica
2022-07-20 01:40CHENQingmanGUOGuijunLUOGuangfuHEJianfeng
Advances in Polar Science 2022年1期
CHEN Qingman, GUO Guijun, LUO Guangfu & HE Jianfeng*
Potential suitable sites for the calibration of Scientific Echo Sounder in the marginal seas around Antarctica
CHEN Qingman1, GUO Guijun2,3, LUO Guangfu1& HE Jianfeng1*
1Key Laboratory of Polar Science, MNR, Polar Research Institute of China, Shanghai 200136, China;2First Institute of Oceanography, Ministry of Natural Resources, Qingdao 266061, China;3Laboratory for Regional Oceanography and Numerical Modeling, Pilot National Laboratory of Marine Science and Technology, Qingdao, 266237, China
Thecalibration of Scientific Echo Sounders (SESs)in the Southern Ocean is crucial for accurate assessments of Antarctic krill and fishery biomasses. Because of the occurrence of strong winds, waves, and sea ice coverage in most seasons, SES calibration is usually difficult to perform in the Southern Ocean. Accordingly, it is essential to identify potential sites suitable for SES calibration in the marginal seas around Antarctica to successfully calibrate SESs in the Southern Ocean. Using synthetic analyses of the wind, surface current, and sea ice concentration in the targeted seas, we found that the polynya in the southeast Prydz Bay, close to the Chinese Zhongshan Station, is an ideal location to calibrate SESs based on its weak wind and surface current and its ice-free coverage during Antarctic cruises. Calibrations of the SESs onboard the research vessels ofandduring the 36th and 37th Chinese National Antarctic Research Expeditions indicate that this location is a potential suitable site for conducting SES calibration with the vessel in a drifting mode.
acoustic calibration, Scientific Echo Sounder, coastal current, wind speed, sea ice, Antarctic
1 Introduction
With scientific and technological developments, underwater acoustic surveys have become widely used in fields such as seabed topography, fishery biomass investigations, and water current surveys. Fishery hydroacoustics is one of the most efficient and important methods used to investigate marinefisheryresources and is primarily implemented via ship-based Scientific Echo Sounders (SESs) in field investigations. SES works by transmitting sound waves into the water and receiving the echo signals reflected by plankton, fish, or the sea bed. The intensity of the echo signal can then be used for the estimation and administration of fishery resources in the ocean (Zhao and Chen, 1996).
Antarctic krill, a key species in the marine food web, has a huge biomass and wide distribution in the Southern Ocean. The study of the type, quantity, and distribution of krill is of significance for understanding the ecosystem and assessing the krill biomass in the Southern Ocean (e.g., Laws, 1985; Zhao et al., 2016; Zuo et al., 2016). SES has commonly been used as the main instrument in Antarctic krill biomass surveys, and several comprehensive assessment methods have been established (e.g., Yang and Zhu, 2018). There have been multiple studies focusing on topics such as the distribution of Antarctic krill populations, target strength analyses, the elimination of background noise, and species identification (Jarvis et al., 2010; Wiebe et al., 2010; Zhu, 2011; Krafft et al., 2012; Qu, 2014; Wang et al., 2014).
The SES calibration plays a critical role in making precise estimations of the Antarctic krill biomass, and the accuracy of the SES is mainly responsible for the error in biomass assessments. A target strength (TS) standard sphere is generally used to perform acoustic calibrations of the receiver gain and equivalent beam angle of the SES (Foote, 1983) to make the measured TS consistent with the actual TS.
With the wide application of SESs, the process of acoustic calibration has been gradually developed. At first, standard balls with various diameters and materials were used to calibrate transducers of different frequencies. For example, Foote found that standard copper balls with a diameter of 60 mm always maintained a stable TS for 38-kHz SES transducers and that the accuracy of the calibrated TS could reach 0.1 dB (Foote, 1983; Zhao and Chen, 1996). At present, a tungsten carbide (WC) sphere with a diameter of 38.1 mm can be used to calibrate transducers of multiple frequencies equipped on an SES. However, there are still problems to be solved in the calibration of SESs in the Southern Ocean because of the harsh Antarctic environment. When performing a calibration in Antarctic waters, strong wind and surface currents often cause the research vessel to drift rapidly, which threatens the stability of the sphere and leads to a failure of the SES calibration. Therefore, the prevailing wind and surface current at sites used to perform the SES calibration should be sufficiently weak to ensure the stability of the sphere in the water exactly under the SES transducer, which is fixed to the bottom of the hull.
Chinese investigations in the Southern Ocean are primarily conducted in the Prydz Bay and its adjacent waters, in waters near the tip of the Antarctic Peninsula, and in the Ross Sea, using Research Vessel (R/V)and. Here we compare the wind, surface currents, and sea ice concentrations in these marginal seas and incorporate thecalibrations of the SES in the Antarctic during the 36th and 37th Chinese National Antarctic Research Expeditions (CHINAREs), aiming at selecting suitable sites for the calibrations of SES aboard R/Vand2 during Chinese Antarctic cruises for a better utilization of the SES.
2 Application and calibration of SES
2.1 Application on polar icebreakers in China
In 1995, an SES, Simrad EK500, was installed on R/Vand used in its subsequent Chinese Antarctic cruises. In 2012, the original SES was upgraded and replaced with Simrad EK60, a new generation of SES equipped with two transducers (with frequencies of 38 kHz and 120 kHz). In 2019, a new Chinese polar icebreaker, R/Vwas put into operation. R/Vis equipped with a new SES, Simrad EK80, with four transducers at different frequencies (Table 1), improving China’s biological investigation capabilities in the Southern Ocean.

Table 1 Information of the SESs installed aboard R/V Xuelong and Xuelong 2
R/Vhas a length of 122.5 m, a width of 22.32 m, and a height of 11.8 m. Its designed displacement is close to 14000 T, with a draft of 8.3 m when fully loaded (Chen et al., 2020). In general, conventional marine research vessels have a displacement of approximately 3000–5000 T, and fishery resources survey vessels have a displacement of 6000–8000 T. Larger size of R/Vmake it more difficult to calibrate the SES on board. Accordingly, it is essential to select suitable sites for calibrating the SES via an analysis of the environmental parameters, such as the field wind, surface water current, and sea ice concentration.
R/Vhas been specially designed to optimize the performance of its SES. To protect the transducers from broken ice and minimize the interruption of bubbles produced when the ship moves forward, the SES transducers are installed on a streamlined spindle box keel that protrudes 0.6 m from the bottom of the ship (point D in Figure 1). During calibration, a 38.1-mm WCCo (tungsten) ball is hung in the water at a depth of 20–40 m just below the transducer and the position of the ball is adjusted by changing the lengths of three nylon ropes (A, B, and C in Figure 1) connected to the ball. The echo sound intensity of the ball is then measured to calibrate the SES.
2.2 SES calibrations during previous CHINAREs
The SES needs to be calibrated for each Antarctic cruise to ensure the accuracy of the SES measurements. The SES is generally calibrated before the field investigation begins; if not, it can be corrected using a post-investigation calibration. The harsh environment in the Southern Ocean imposes many limits on SES calibrations. Table 2 summarizes the SES calibration information for R/Vin previous CHINAREs. The SES on R/Vwas successfully calibrated for most cruises; however, only half of these calibrations were successful with one try.

Figure 1 Schematic of the calibration of the Simrad EK80 on R/VPoint D in the inset indicates the box keel where the transducers are installed, and points A, B, and C represent the ends of the nylon ropes on the deck used to adjust the position of the sphere.

Table 2 SES calibrations on R/V Xuelong during recent CHINAREs
R/Vis propelled by a traditional propeller shaft, and its large tonnage makes it less maneuverable than small boats. Even though it is equipped with a DP2 dynamic positioning capability, the occasional push of the bow side in the dynamic positioning mode causes rapid water flow, which affects the SES acoustic calibration. To ensure the safety of the ships, the locations chosen to calibrate SESs are generally far from island and reef areas.
3 Environments of the potential calibration sites
China has established and operated two Antarctic coastal stations, the Great Wall Station in the Southern Shetland Islands and Zhongshan Station on the Larsemann Hills in East Antarctica. A new station on the western coast of the Ross Sea is currently under construction. The Chinese R/Vandare used for Southern Ocean scientific investigations as well as cargo supply to the coastal stations and inland stations (Taishan Station, Kunlun Station) in the Antarctica. Therefore, their scientific investigations primarily focus on the marginal seas adjacent to these coastal stations, i.e., the waters near the tip of the Antarctic Peninsula, Prydz Bay, and Ross Sea (Figure 2).
During the Antarctic cruises, environmental factors, such as surface current, swell, wind, sea ice, bottom depth and biological condition are likely to affect the success of SES calibration on board the vessels (Foote et al., 1983; Demer et al., 2015). The primary investigated regions for R/Vandare generally deeper than 100 m, which is deep enough to place sphere in the far-field of the transducers. In the open ocean off the continental shelf, strong winds in the Southern Ocean drives strong waves and swells and it is difficult to carry out the SES calibration. In marginal seas close to the coast, open water are shielded by sea ice outside and the wave heights are generally weaker than that in the open ocean. This would facilitate the success of the SES calibration in marginal seas near the coast compared with that in the open ocean. In addition,experiences show that surface waters in the investigated regions by R/Vandare clean enough to enable the calibration to be void of biological scatters. Given this, here we focus on analyzing the wind speed, surface current and sea ice concentration in these regions investigated by R/Vandto determine the potential best sites for the ship-based SES calibration.
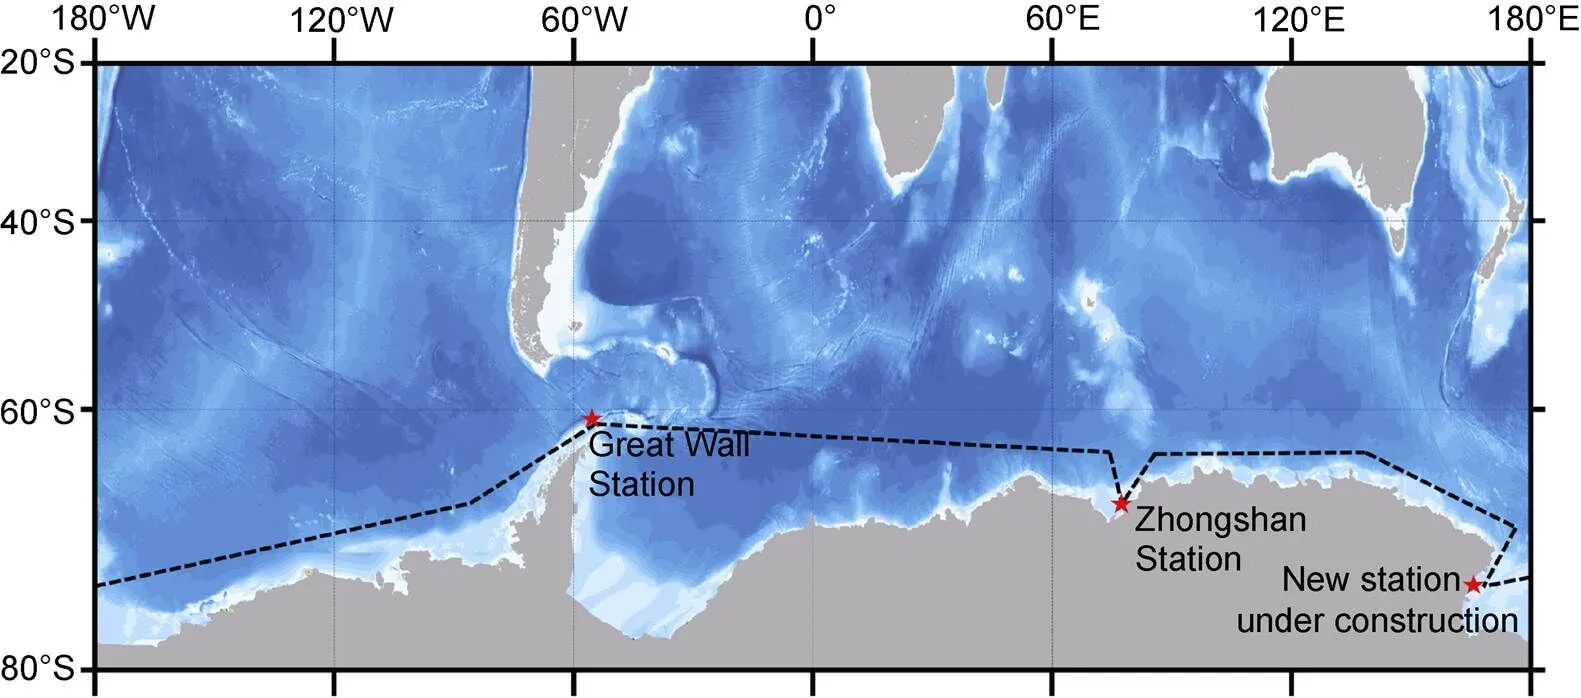
Figure 2 Trajectory of the research vessels in the CHINARE cruises.
3.1 Sea ice
Sea ice concentration data were obtained from the Advanced Microwave Scanning Radiometer 2 (AMSR2; http://www.iup.uni-bremen.de:8084/amsr2/), with a spatial resolution of 6.25 km × 6.25 km.observations conducted by R/Vandgenerally last from December to March of the following year. Therefore, the mean sea ice concentration during the summer season (December–March) for the period of 2013–2018 was used to analyze the spatial distribution of the sea ice in the investigated regions.
Figure 3a indicates that sea ice is generally concentrated in coastal seas in the austral summer months when the investigations in the Antarctic are performed. Most marginal seas near the coast are covered by sea ice, except some coastal polynyas, i.e., ice-free regions surrounded by sea ice. Under conditions of persistent katabatic winds and the glacier tongue barrier effect, the coastal polynya off the new station in the Ross Sea are the first to become ice-free in the austral summer months. In the southeast Prydz Bay off the Zhongshan Station, the combination of warm water intrusion from the deep ocean onto the shelf and wind contributes the existence of the Davis Polynya, which develops into a large ice-free area that is favorable to SES calibrations. In the coastal sea around the Great Wall Station, the sea ice melts because of its lower latitude in summer and therefore has no influence on SES calibrations. Therefore, the coastal seas off these grounded stations are all free of ice coverage and are potential locations for research vessels to perform SES calibrations.

Figure 3 Mean summer sea ice concentration in the Southern Ocean averaged over December to March from 2013 to 2018: a, the entire Southern Ocean; b, the Ross Sea; c, the Prydz Bay; d, the Antarctic Peninsula. In panel c, red circles indicate locations where SES calibrations have been successful and black circles indicate locations where they have failed. The red stars in panels b–d indicate the new station under construction in the Ross Sea, Zhongshan Station and Great Wall Station, respectively. The same notation is used in Figures 4 and 5.
3.2 Wind
The sea surface wind was derived from the ERA5 reanalysis dataset, available from the European Centre for Medium-Range Weather Forecasts (ECMWF, https://doi. org/10.24381/cds.adbb2d47). The spatial characteristics of the sea surface wind were evaluated by comparing the mean wind speed at 10 m above the surface during the period of 2013–2018, with a spatial resolution of 0.25° × 0.25°. Wind in the Southern Ocean is characterized by strong westerlies (Figure 4a). In the coastal seas close to the Antarctic continent, the wind is also strong as a result of the polar eastward wind and katabatic wind. Even though the mean wind speed between the westerlies and the coastal seas is small, the coastal seas are significantly affected by strong waves generated by strong winds.
In the polynya east of the new station in the western Ross Sea, even though there is no sea ice cover during the austral summer, the wind maintains its highest speed over the Ross Sea (Figure 4b). This wind would drive the vessel to drift rapidly and threaten the stability of the sphere. Conversely, in the Prydz Bay, strong wind occurs primarily in the western part of the bay, while the wind speed in the east embayment north of Zhongshan Station is much lower. The mean wind speed in the southeastern Prydz Bay off the Zhongshan Station, where the polynya is located in austral summer, remains at its lowest level of less than 3 m·s−1(Figure 4c). The coastal seas around the Great Wall Station are close to the westerlies and are vulnerable to strong winds and waves (Figure 4d). Therefore, this area is not favorable for SES calibrations.
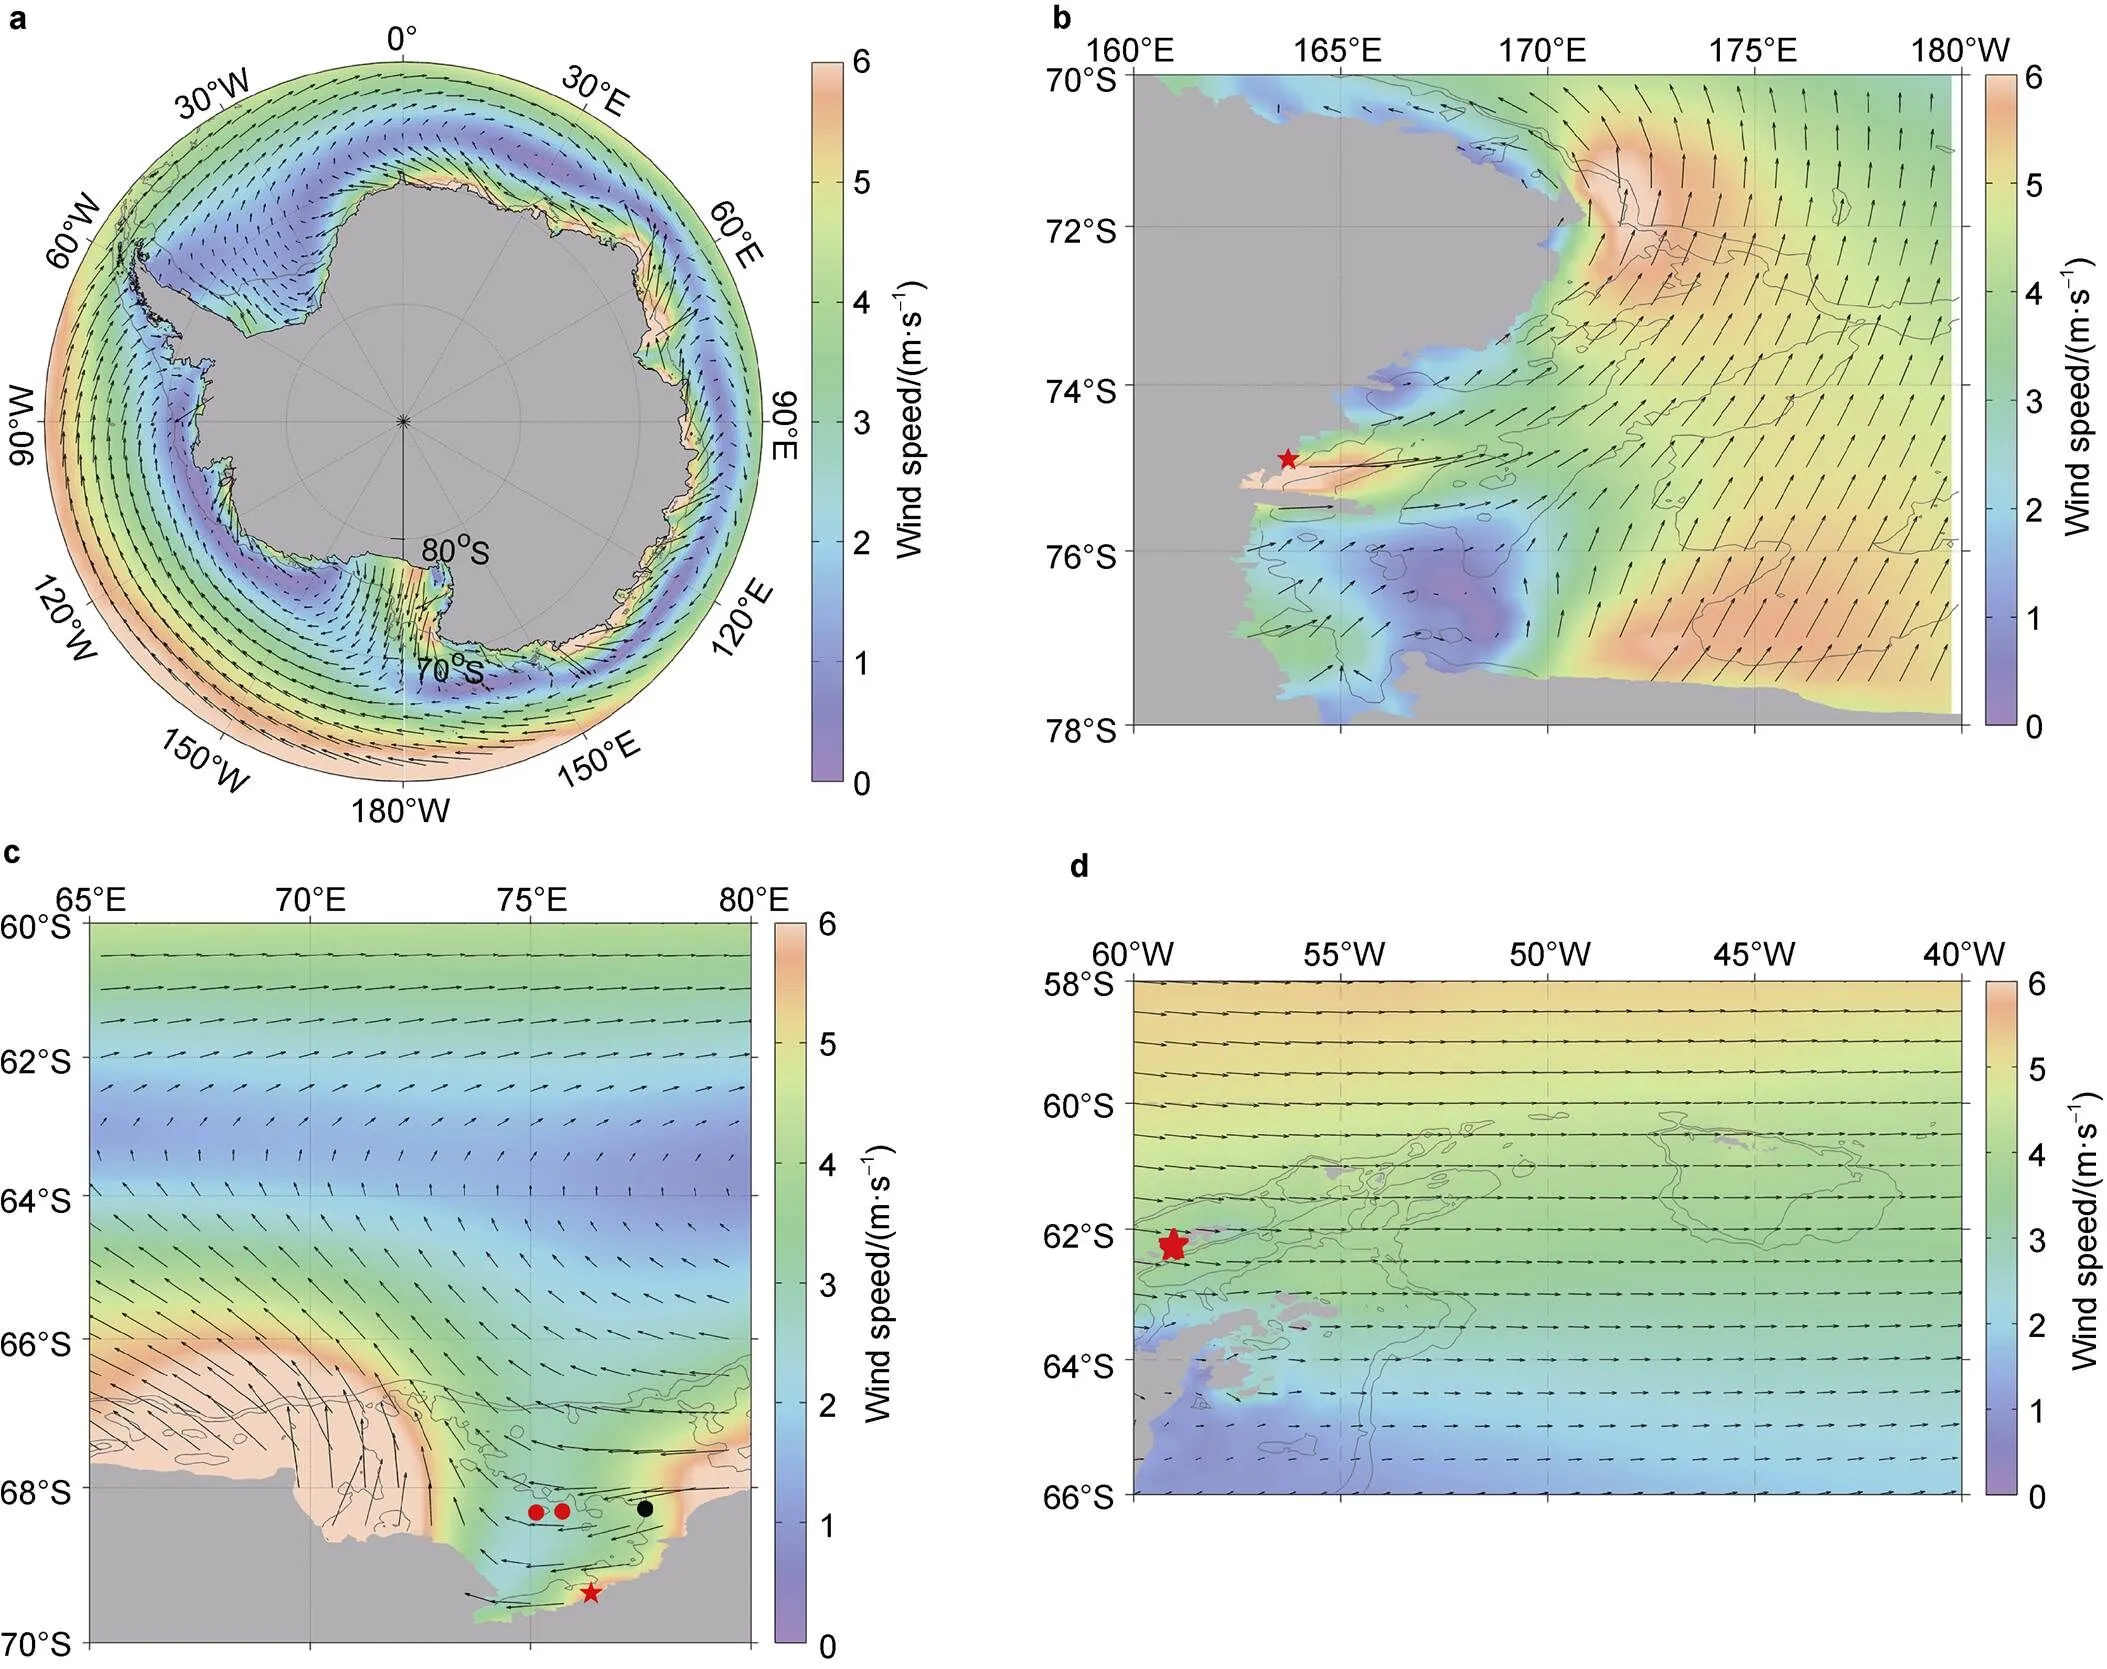
Figure 4 Mean surface wind speed at 10 m in the Southern Ocean averaged over all months from 2013 to 2018: a, the entire Southern Ocean; b, the Ross Sea; c, the Prydz Bay; d, the Antarctic Peninsula.
3.3 Surface currents
Surface current data were obtained from the Southern Ocean State Estimate (SOSE) reanalysis dataset (www.sose.ucsd. edu/sose_stateestimation_data.html). The SOSE dataset has a spatial resolution of 1/6° × 1/6° for the horizontal velocity and 43 levels in the vertical direction. Here, the surface current data were estimated by averaging the current data above 50 m during the period of 2013–2018. Driven by the strong wind in the westerlies, there is a strong surface current in the deep Southern Ocean. By contrast, the surface current close to the Antarctic continent flows westward driven by the polar easterly wind, i.e., the coastal current, with a mean value of approximate 0.1 m·s−1(Figure 5a).
Figure 5b shows that there is a significant northeastward current along the coast in the coastal polynya off the new station in the Ross Sea, with a mean value larger than 0.1 m·s−1. Therefore, it is not an ideal location for SES calibrations even though there is no ice in the summer. In the southeast Prydz Bay, the polynya is sufficiently removed from the influence of the coastal current which is less than 0.05 m·s−1(Figure 5c). The coastal seas around the Great Wall Station are also characterized by a weak surface current and there is no ice coverage in the austral summer months. However, the tidal current in the shelf regions around the Antarctic Peninsula is strong compared with those in the other coastal seas around Antarctica. Because SES calibrations usually take several hours, a strong tidal current would affect the stability of the sphere (Makinson and Nicholls, 1999).

Figure 5 Mean surface ocean current of the top 50 m in the Southern Oceanaveraged over all months from 2013 to 2018: a, the entire Southern Ocean; b, the Ross Sea; c, the Prydz Bay; d, the Antarctic Peninsula.
4 In situ calibrations
Since late 2019 when R/Vfirst voyaged to the Antarctic, the SES aboard this ship has been calibrated three times in the Southern Ocean (Table 3). These calibrations were all performed in the Prydz Bay, with two successes and one failure. After completing the cargo supply to Zhongshan Station (red stars in Figures 3c, 4c, and 5c), R/Vset off from the land-fast ice to the north and selected an ice-free region to perform the SES calibration. Even though we invested more than 5 h in the calibration, the first SES calibration during the 36th CHINARE failed. The failure of this first calibration was ascribed to the influence of a strong coastal current (black dots in Figures 3c, 4c, and 5c). The fast water flow below the ship impeded the calibration and prevented the precise maintenance of the correct position of the sphere beneath the transducers, and the calibration was suspended. Then, the ship was moved westward (left red dot in Figures 3c, 4c, and 5c), far from the influence of the coastal current. The weak wind and surface current enabled us to successfully calibrate the SES onboard R/V. Referring to the practical experience gained on the 36th CHINARE, we performed the SES calibration successfully in the southeastern Prydz Bay during the 37th CHINARE (right red dot in Figures 3c, 4c, and 5c) adjacent to the calibration location of the previous cruise. Given ourcalibration experience, the ice-free polynya in the southeastern Prydz Bay (68°–68°40'S, 74°30'–76°30'E), far from the katabatic wind and coastal current, is a favorable site for SES calibration.

Table 3 Information concerning the calibration of the Simrad EK80 onboard R/V Xuelong 2
5 Conclusions
Chinese icebreakers in the Antarctic manage both oceanic investigations and cargo supply to coastal stations. Therefore, it is important to improve the efficiency ofobservations. SES calibration is critical to precisely estimate the biomass of Antarctic krill and fish. Therefore, it is essential to identify suitable sites to calibrate ship-based SESs. Via an analysis of the local wind, surface current, and sea ice distribution in the regularly investigated regions of R/Vand, we found that the polynya in the southeastern Prydz Bay off the Zhongshan Station (68°–68°40'S, 74°30'–76°30'E) is an potential ideal location to perform SES calibrations because of its low annual mean wind speed, slow surface current, and ice-free coverage during the Antarctic cruises. There are also successful calibration experiments conducted in the Antarctic Peninsula area by other surveys, e.g., the US AMLR surveys (Hewitt et al., 2004). However, compared with Prydz Bay, relatively stronger winds and surface current make the Ross Sea and coastal waters near the Antarctic Peninsula the suboptimal sites for SES calibrations during Chinese Antarctic cruises.
Acknowledgements The sea ice concentration data were obtained from the AMSR2 dataset available at http://www.iup.uni-bremen.de:8084/ amsr2/. The sea surface wind data were derived from the ERA5 reanalysis dataset provided by ECMWF (https://doi.org/10.24381/cds.adbb2d47). The surface current data were obtained from the SOSE reanalysis dataset, available at https://www.sose.ucsd.edu/sose_stateestimation_data.html. This study was financially supported by National Polar Special Program “Impact and Response of Antarctic Seas to Climate Change” (Grant nos. IRASCC IRASCC 01-01, 01-02, 02-01), was supported by the National Key R&D Program of China (Grant nos. 2017YFC0306003 and 2016YFB0501703), and the National Natural Science Foundation of China (Grant nos. 41876111, 41706115, and 41806214).
We are grateful to the crew of R/Vduring the 36th and 37th CHINAREs for their considerable support during the SES calibrations. Special thanks are also given to Wang Xinliang from the Yellow Sea Fisheries Research Institute of the Chinese Academy of Fishery Sciences for his professional advice in preparing the manuscript. We appreciate Dr. Hongliang Huang as reviewer and another anonymous reviewer, and Guest Editor Prof. Jiuxin Shi for their constructive comments that have further improved the manuscript.
Chen Q M, Wang S R, Yuan D F. 2020. Special design of the laboratory of icebreaking polar research vessel. Chin J Polar Res, 32(3): 352-361, doi: 10.13679/j.jdyj.20200026 (in Chinese with English abstract).
Demer D A, Berger L, Bernasconi M, et al. 2015. Calibration of acoustic instruments. ICES Cooperative Research Report, No. 326, May 2015.
Foote K G. 1983. Maintaining precision calibrations with optimal copper spheres. J Acoust Soc Am, 73(3): 1054-1063, doi:10.1121/1.389153.
Hewitt R, Watters G, Trathan P, et al. 2004. Options for allocating the precautionary catch limit of krill among small-scale management units in the Scotia Sea. CCAMLR Science, 11: 81-97.
Jarvis T, Kelly N, Kawaguchi S, et al. 2010. Acoustic characterisation of the broad-scale distribution and abundance of Antarctic krill () off East Antarctica (30-80°E) in January–March 2006. Deep Sea Res Part II Top Stud Oceanogr, 57(9-10): 916-933, doi:10.1016/j.dsr2.2008.06.013.
Krafft B A, Skaret G, Knutsen T, et al. 2012. Antarctic krill swarm characteristics in the Southeast Atlantic sector of the Southern Ocean. Mar Ecol Prog Ser, 465: 69-83, doi:10.3354/meps09876.
Laws R M. 1985. The ecology of the Southern Ocean. Am Sci, 73: 26-40.
Makinson K, Nicholls K W. 1999. Modeling tidal currents beneath Filchner-Ronne Ice Shelf and on the adjacent continental shelf: their effect on mixing and transport. J Geophys Res, 104(C6): 13449-13465, doi:10.1029/1999jc900008.
Qu T C, Chen S, Huang H L, et al. 2014. Removal of echo integration noise and estimation of the abundance of Antarctic krill. Chin J Polar Res, 26(4): 451-459, doi:10.13679/j.jdyj.2014.4.451 (in Chinese with English abstract).
Wang X L, Zhao X Y, Tang Y, et al. 2014. Removal of the inter- instrument acoustic interference and its application in the study of Antarctic krill swarms. Prog Fish Sci, 35(2): 22-29 (in Chinese with English abstract).
Wiebe P H, Chu D Z, Kaartvedt S, et al. 2009. The acoustic properties of. ICES J Mar Sci, 67(3): 583-593, doi:10.1093/ icesjms/fsp263.
Yang Y, Zhu G P. 2018. Assessment on marine living resources based on acoustic technology and its application in Antarctic krill abundance estimation. Mar Fish, 40(3): 368-376, doi:10.13233/j.cnki.mar. fish.2018.03.013 (in Chinese with English abstract).
Zhao X Y, Chen Y Z. 1996.target strength measurements on walleye pollock (). J Fish Sci China, 3(4): 19-27 (in Chinese with English abstract).
Zhao X Y, Zuo T, Leng K L, et al. 2016. Engineering science and technology challenges in the Antarctic krill fishery. Chin J Eng Sci, 18(2): 85-90, doi:10.15302/j-sscae-2016.02.010 (in Chinese).
Zhu G P. 2011. Population biology of Antarctic krill. I – age, growth and mortality. Acta Hydrobiol Sin, 35(5): 862-868, doi: 10.3724/SP.J.1035.2011.00862 (in Chinese with English abstract).
Zuo T, Zhao X Y, Wang X L, et al. 2016. Development of feedback management for the Antarctic krill fishery. Chin J Polar Res, 28(4): 532-538, doi:10.13679/j.jdyj.2016.4.532 (in Chinese with English abstract).
2 July 2021;
29 November 2021;
30 March 2022
10.13679/j.advps.2021.0033
: Chen Q M, Guo G J, Luo G F, et al.Potential suitable sites for the calibration of Scientific Echo Sounder in the marginal seas around Antarctica. Adv Polar Sci, 2022, 33(1): 102-109,doi:10.13679/j.advps.2021.0033
, E-mail: hejianfeng@pric.org.cn
 Advances in Polar Science2022年1期
- Advances in Polar Science的其它文章
- Relating the composition of continental margin surface sediments from the Ross Sea to the Amundsen Sea, West Antarctica, to modern environmental conditions
- Effects of sea ice melt water input on phytoplankton biomass and community structure in the eastern Amundsen Sea
- Features and influencing mechanisms of gaseous elemental mercury over the equatorial Pacific and their differences with the Southern Ocean
- Horizontal distribution of tintinnids (Ciliophora) in surface waters of the Ross Sea and polynya in the Amundsen Sea (Antarctica) during summer 2019/2020
- Distribution of transparent exopolymer particles and their response to phytoplankton community structure changes in the Amundsen Sea, Antarctica
- Particle dynamics revealed by 210Po/210Pb disequilibria around Prydz Bay, the Southern Ocean in summer