
Analysis of the corrosion performance of binder jet additive manufactured magnesium alloys for biomedical applications
2022-07-13 03:09:54KaiXiangKuahDanielBlakwoodWeeKitOngMojtabaSalehiHangLiSeetMuiLingSharonNaiSudeshWijesinghe
Journal of Magnesium and Alloys 2022年5期
Kai Xiang Kuah, Daniel J.Blakwood, Wee Kit Ong, Mojtaba Salehi, Hang Li Seet,Mui Ling Sharon Nai,∗∗, Sudesh Wijesinghe
a Department of Materials Science & Engineering, National University of Singapore, 9 Engineering Drive 1, 117575 Singapore
b Reliability and Characterisation Unit, Singapore Institute of Manufacturing Technology (SIMTech), Agency for, Science, Technology and Research(A∗STAR), 73 Nanyang Drive, 637662 Singapore
cAdditive Manufacturing Group, Singapore Institute of Manufacturing Technology (SIMTech), Agency for, Science, Technology and Research (A∗STAR), 73 Nanyang Drive, 637662 Singapore
Abstract
Keywords: Magnesium; Additive manufacturing; Binder jetting; Porous; Corrosion; Biodegradability.
1.Introduction
In the field of materials for biomedical applications, there has long been a strong interest in the use of magnesium for biomedical implants.The benefits of magnesium based implants include improved tissue regeneration, and its biocompatibility allows for the degradation of magnesium implants over time, removing the need for any retrieval surgery [1].Elements beneficial to the body, such as zinc and manganese[2], are readily found as part of the alloying system in commercially available magnesium alloys,with ZK60(Mg-Zn-Zr)[3,4]and WE43 (Mg-Y-Nd-Zr) [5,6]being two of the most common alloying systems chosen for biomedical implants.
The introduction of structural porosity has been observed to provide functional benefits for their intended use.In automotive industry, the incorporation of porous material not only promotes weight savings,but also provides more tangible benefits such as impact absorption and fire resistance which has been well summarized and understood [7,8].Porous magnesium samples have also found their way into the orthopaedic industry with the introduction of pores in the implant has been found to allow for improved cell viability and bone regeneration [9].
Manufacturing processes for porous magnesium alloys have been in development for some time and are often make use of space-holder materials, which is removed post process via either etching [9], dissolving in water [10]or thermal decomposition [11,12]to reveal the porous structure.Binderjet additive manufacturing, also known as binder jet printing(BJP), opens a new window of opportunity for the fabrication of highly interconnected porous magnesium structures with a wide range of pore’s sizes, given the unique layer-by-layer manufacturing fashion with the option for the finetuning of the pore morphology post printing by varying the sintering parameters [13–16].As there are no additional steps to remove any space holder material, the binderjet process reduces the chances of sample contamination.
Despite the benefits porous structures bring to the table,the introduction of porosity in samples has been shown to increase their corrosion rate when compared to bulk alloys[11,17–20]due to the proposed increase in surface area.Similar increase in the corrosion of porous structure attributing to possibilities of localised and crevice corrosion has also been suggested [21].Although the corrosion characterizations of porous BJP alloys have yet to be fully investigated and documented, it is likely these will suffer increased corrosion rates in a similar fashion to porous alloys produced by alternative techniques.This means that more work and insights are required to have a better understanding of the relationship between the post printing parameters on microstructure and their corresponding corrosion characteristics, to ascertain if additional treatments will be required to reduce corrosion rates to an acceptable level.
Magnesium alloys are known to have inherently higher corrosion rates than traditional structural materials like steels and aluminium, as magnesium is placed towards the active end of the galvanic series for seawater.The corrosion reactions usually involve anodic magnesium dissolutionMg→Mg2++ 2e-, supported by the cathodic hydrogen evolution reaction (HER) (2H2O+ 2e-→H2+ 2OH-).One common route people use to circumvent this problem is through surface modifications, such as anodization and coatings [22], which are found to effectively reduce the corrosion rate of magnesium alloys.One of the more well-known coatings used in biomedical applications is hydroxyapatite (HA),a type of biocompatible phosphate conversion coating [23,24]that has been shown to reduce the corrosion rate of magnesium alloys [25], and for which a wide variation of application techniques are available [23–27].The incorporation of HA into plasma electrolytic oxidation (PEO) coating has also been demonstrated in the work of Pezzato et al[28]., which provides a glimpse into the versatility of HA.
An alternative approach could be to impregnate the pores in the BJP alloy with a polymer creates a metal polymer composite, whereby the voids within the porous structure are replaced with a polymer filler.Although the overall mass of the metal polymer composite will increase in comparison to the as printed BJP alloy, it will still be much lighter than bulk magnesium, maintaining the advantageous low density afforded by magnesium alloys.For biomedical applications,a biocompatible polymer could be used, such as Poly(lactic)Acid (PLA), as the coating, which have been reported to reduce the corrosion rates of magnesium alloys [3,29,30].The combination of PLA and magnesium alloy manufactured from BJP process, which are both biocompatible and biodegradable, could open-up the possibility for more clinical applications in the biomedical sector,such as controlled drug delivery from within the implant itself.
This work is a novel attempt that aims to understand the corrosion characteristics and performance of BJP Mg-Zn-Zr magnesium alloys in phosphate-buffered saline (PBS).The BJP Mg-Zn-Zr alloys sintered at different temperature (615°C and 573 °C) are characterized to understand the effect of sintering parameters on their physical morphology, elemental composition, and corrosion behaviour in comparison to their as cast counterparts.The preliminary study on the effectiveness of filling the pores with HA,epoxy and PLA at retarding the corrosion rate will be demonstrated.
2.Experimental procedure
The Mg-Zn-Zr powder, with particle diameter of 60–70 μm and a measured chemical composition determined via ICP-OES of Zn 5.49 wt.% Zr 0.17 wt.% Mg Bal., was purchased from International Laboratory (USA) and used in its as supplied raw form.The raw powder was binder printed via an in-house modified 3D printer, wherein a roller spreads a 100 μm thick layer of Mg powder from the feed platform to the build platform.Afterwards, an inkjet print head deposited a formulated ink at 70% saturation level into the designated area to form capillary-mediated bridges, followed by spreading the subsequent layer on the previous one and selectively depositing the ink.These steps were repeated until an entire 3D object was fabricated, with the development processes having been fully discussed in earlier works [13–16].After the printer’s envelope had been dried with a hot-air fan for an hour, the green samples were removed from the surrounding loose powder in the powder bed and loaded into a horizontal tube furnace and sintered in an argon atmosphere.For nomenclature, the BJP sample sintered at 615 °C, which has a relative density of 87%, will be referred to as BJP-87 and the sample sintered at 573 °C, which has a relative density of 73%, will be referred to as BJP-73.The relative density compared to bulk sample was measured by Archimedes principle(ASTM B962) in previous work [16].The pores openness index, that is the ratio of open porosity to total porosity, was also calculated by the Archimedes principle.The method is described in more details elsewhere[14].This indices for the BJP-87 and BJP-73 specimens were 0.95 and 0.96, respectively.The composition of the powder feedstock, BJP-73 and BJP-87 were determined via a Perkin Elmer Optima 4300 DV inductively coupled plasma-optical emission spectrometer.Only Mg, Zn and Zr were detected above the 0.01 wt.%level.The oxygen content is determined via inert gas fusion infrared absorbence.
To allow for comparison with BJP samples,a Mg-Zn-Zr alloy of similar composition was fabricated via traditional gravity casting technique by pouring the molten alloy at 750 °C into steel mould, with the final composition of the casted sample being determined by EDX to be Zn 5.65 wt.% Zr 0.96 wt.% Mg Bal.This bulk sample is referred to as “as cast” Mg-Zn-Zr magnesium alloy.For characterization andcorrosion tests, the sample surfaces were polished systematically to OPS for electron microscopy and 2400 Grit for corrosion testing.All the grinding and polishing steps were done with non-aqueous lubricant.

Fig.1.SEM images of as cast Mg-Zn-Zr magnesium alloy at different magnification.

Fig.2.EDX mapping showing the elemental and phase distribution on as cast Mg-Zn-Zr magnesium alloy.
Surface microstructure and elemental mapping were characterized with a Zeiss Sigma 300 Fe-SEM, using an accelerating voltage of 15 kV for the EDX analysis.The crystal structures were investigated with Bruker D8 Discover XRD(Cu Kα), using a Theta-2theta scan, 10° to 100° at 0.1° interval with a dwell time of 3 s.The morphology of the porous structure was identified using a Nanotom M180 X-ray computer tomography system (XCT), with the calculations done based on voxel size of 3.5 μm.The total porosity and surface area within a volume of the porous sample can be determined by the built-in function that comes with the software, which will be reported and extrapolated to obtain the total surface volume of the sample used for the hydrogen evolution experiment in the later part of the work.It is expected that the relative density(inverse of porosity)measured by Archimedes principle to be lower when compared to measurements done by XCT, which is due to the limitation of the XCT in the detection of features smaller than the voxel resolution [31].
Through the XCT,the effective surface area and subsequently,the effective corrosion rate can be derived from the corrosion results.

Fig.3.SEM images of (a,b) BJP-73 and (c,d) BJP-87 Mg-Zn-Zr magnesium alloy at different magnifications.
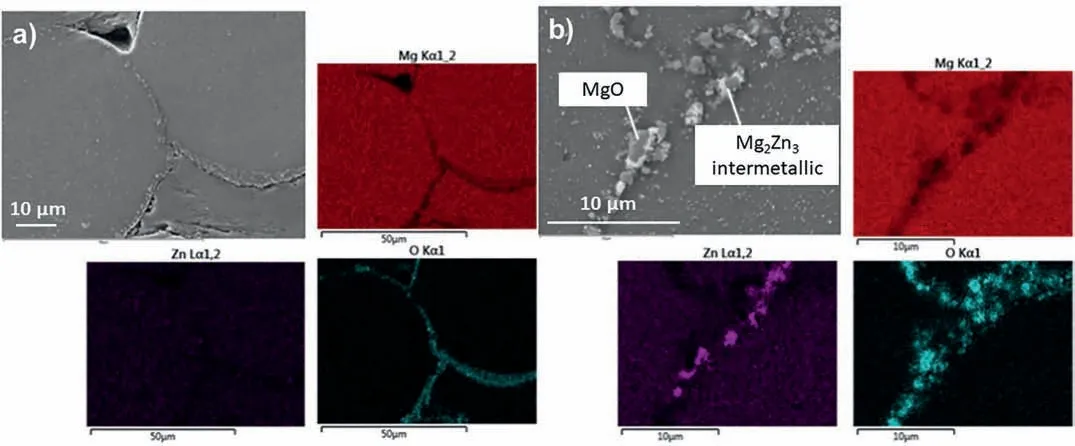
Fig.4.EDX mapping showing the a) magnesium oxide segregation along the sinter-neck area and b) Mg2Zn3 precipitation of BJP-73 Mg-Zn-Zr magnesium alloy.
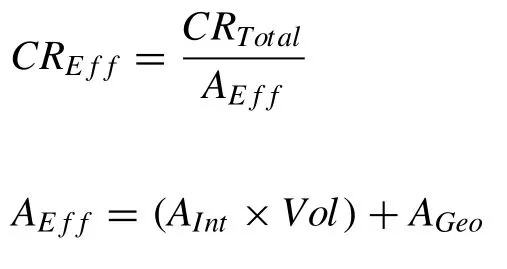
WhereCREffis the effective corrosion rate,CRTotalis the total corrosion rateAEffis the effective surface area,Aintis the internal surface area per unit volume,Volis the volume of the sample andAGeois the geometric (external) surface area.
For the immersion tests, samples were machined into cylindrical shape, 20 mm in length and 5 mm in diameter.The electrolyte was phosphate buffered saline PBS solution(GibcoTMPBS pH 7.4) maintained at 37 °C.Samples were immersed in the electrolyte and the hydrogen gas evolved collected with a set of inverted funnel and burette, with readings taken periodically over the duration of the experiments, that lasted up to 5 days.At least three samples were used for each test to ensure reproducibility.This setup for the monitoring H2was first introduced and discussed in greater details in the work of Song et al.[32].
Electrochemical tests were conducted with Gamry Reference 600.The sample serves as the working electrodes of a three-electrode setup, completed with a saturated calomel electrode (SCE) as the reference electrode and a graphite rod as the counter electrode.The electrolyte was PBS maintained at 37 °C and the samples were left at open circuit for 30 mins, before being polarized from -0.25 V vs their open circuit potentials (OCP) to -1.0 V vs SCE at 1 mV/s.To calculated corrosion rates from both the hydrogen evolution and electrochemical data, the samples’ geometries were taken to be dense cylinders, that is to say no attempt was made to include the pores walls in the surface area calculations; the reasons for this will be discussed further in the Results and Discussion Section.
In later experiments, to reduce the corrosion rates, the porous BJP samples were either coated with hydroxyapatite or filled with a polymer.To prepare the stock solution of hydroxyapatite, 0.02 M calcium hydroxide and 0.07 M phosphoric acid were mixed in volume ratio of 5:1.The solution was stirred for 15 mins at room temperature and infused into the pore system of BJP alloy through vacuum impregnation.The sample was then withdrawn and dried in an oven at 100°C.Here the aim was to provide an even HA coating over the entire internal structural surface of the BJP alloy.A more detailed process can be found in the work of Shirokova [23].Two different polymer systems were investigated, a commercially available bisphenol-based epoxy (Struers EpoFix), with stock solution being prepared by mixing the resin and hardener according to the manufacturers recommended ratio, and PLA for which the stock solution was prepared by dissolving commercially available PLA pellets in acetone.Both polymer solutions were infused into the BJP alloy through vacuum impregnation before being allowed to cure at room temperatureand will be referred to as BJP-73-PLA and BJP-73-Epoxy respectively in the latter part of this work.
3.Results and discussion
3.1.Material characterization
Fig.1 and Fig.2 show SEM and EDX maps of the“as cast” bulk Mg-Zn-Zr sample.Secondary Mg-Zn phase is evenly distributed throughout the sample.Unfortunately, the resolution of the EDX was insufficient to accurately determine the elemental composition of the intermetallic beyond stating that it had excess Zn; XRD subsequently revealed the presence of Mg2Zn3.Closer inspection of the SEM images of the “as cast” sample reveals regions of optical contrast within the magnesium matrix, suggesting variations in the elemental composition.The lighter regions are identified to have higher zinc concentration based on the EDX elemental mapping in Fig.2.
Fig.3 shows SEM images of the sintered BJP-87 and BJP-73 Mg-Zn-Zr magnesium alloys,in which the sinter-necks between the particles can be seen.It is also clear that a higher sintering temperature of BJP-87 at 615 °C, results in a denser structure and a greater diameter of the sinter-necks.In terms of microstructure, secondary phases are found to precipitate and concentrated along the fusion boundary of the powder particles.SEM revealed two types of phases, magnesium oxide inclusions and a Mg-Zn based intermetallic precipitates(Fig.4 and Fig.5), which subsequent XRD revealed its identity to be Mg2Zn3.The origin of the magnesium oxide in the BJP samples was determined to be from the physical destruction of the powders’ oxide layer during super-solidus liquid phase sintering, as described in one of the authors earlier studies [14].The fragments of magnesium oxide from the disrupted oxide films get carried and displaced by the liquid phases during the super-solidus liquid phase sintering process, and when the liquid phases cools, the oxide gets transported into the sinter-neck regions, together with the precipitated Mg2Zn3.
To understand the elemental composition of the microstructure, spot EDX analysis was conducted on the matrix of the samples.The concentration of zinc in the magnesium matrix is found to be higher for the BJP samples, at 6.6 wt.% and 5.6 wt.% for BJP-73 and BJP-87 respectively as compared the 1.5 wt.% of the as cast samples (Table 1).According to the Mg-Zn binary phase diagram, the maximum solubility of zinc in magnesium is determined to be 6.2 wt.% and this oc-curs at a temperature of 340 °C, but decreases steadily with temperature, reaching a theoretical room temperature solubility of approximately 1.5 wt.% [33,34].Thus, the values in Table 1 show that the elemental percentages of zinc in the magnesium matrix of BJP-87 and BJP-73 samples are higher than the theoretical solubility limit, meaning these are considered supersaturated.To explain this supersaturation of zinc in the magnesium matrix one needs to refer to the Mg-Zn phase diagram [34].This reveals that the Zn solubility in the matrix increases with temperature, reaching a maximum of ca.7 wt.% by 350oC before decreasing again at temperatures above 400oC, where any excess Zn will be in a liquid phase.The sintering temperatures in the BJP process were 573 °C and 615 °C, allowing for maximum solubility of zinc in the magnesium matrix.During the cooling process, the lowered temperature results in slower atomic diffusion kinetics, impeding the segregation of zinc rich region and the formation of zinc rich secondary phases.These factors result in the supersaturated matrix in BJP-73 and BJP-87.

Table 1Elemental composition of the matrix in as cast, BJP-87 and BJP-73 Mg-Zn-Zr magnesium alloy determined by EDX.
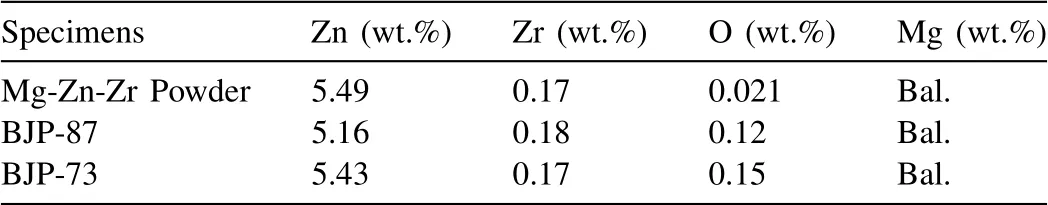
Table 2Elemental composition of Mg-Zn-Zr powder, BJP-87 and BJP-73 Mg-Zn-Zr magnesium alloy determined by ICP AES and inert gas fusion infrared absorbence.
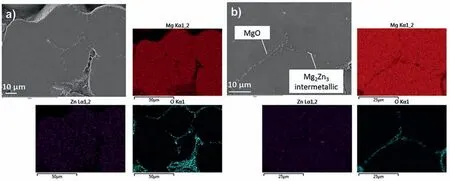
Fig.5.EDX mapping showing the a) magnesium oxide segregation along the sinter-neck area and b) Mg2Zn3 precipitation of BJP-87 Mg-Zn-Zr magnesium alloy.
Table 2 shows the overall compositions of the BJP-87 and BJP-73 samples as determined by ICP AES and inert gas fusion infrared absorbence.A comparison between elemental analysis revealed that the zinc content is higher in the BJP-73, which is sintered at a lower temperature of 573 °C, as compared to BJP-87, with a higher sintering temperature of 615 °C, in both the matrix (EDX) and the overall composition (ICP AES/ inert gas fusion infrared absorbence).This observed difference can be attributed to the nature of the BJP sintering process, where the fusion of materials depends on the interactions of the solidus phases.From the composition analysis, it is possible to conclude that the choice of sintering parameters influences the overall composition difference between the samples.This observation has also been observed when selective laser melting (SLM) has been used for fabrication of Mg-Zn-Zr alloys, with zinc losses of 18–22% being reported [35,36].From the composition analysis,it is possible to conclude that the choice of sintering parameters influences the overall composition difference between the samples.The evaporation of alloying elements was observed during the sintering of binder jet printed Mg-Zn-Zr specimens in microwave and conventional tube furnaces in which the Zn content decreased by 6.9% and 1.2%, respectively [16].Such a process-induced compositional change in BJP is less rigorous compared to the laser powder bed fusion of Mg-Zn-Zr alloys, with zinc losses of 18–22% being reported [35,36].Likewise, the zinc concentration in the BJP alloys being lower than that in the original powder is also likely due to Zn evaporation during the sintering process.
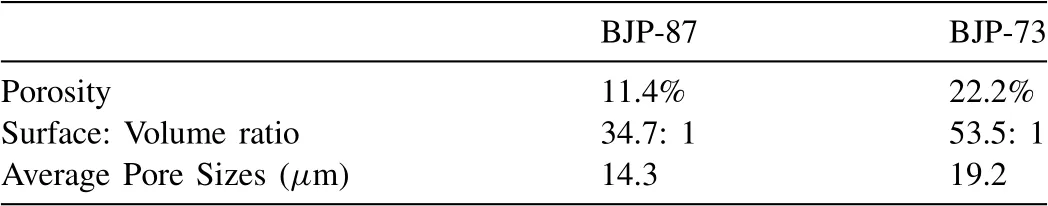
Table 3Porosity percentage, surface to volume ratio and average pore size of BJP-87 and BJP-73 Mg-Zn-Zr magnesium alloy determined from X-ray CT.
Fig.6 shows the XRD patterns collected from the three different sample types.Apart from peaks related to the Mg matrix, and in the case of the BJP samples peaks related to magnesium oxide, the only other phase detected is Mg2Zn3;which XRD showed is present in all samples.Therefore, the Mg-Zn intermetallic observed in the SEM images (Fig.1 and Fig.3) is identified to be predominately Mg2Zn3; although other phases may be present below their detection limits for XRD.The lack of additional phases in the “as cast’ sample, beyond the Mg2Zn3, implies that the difference in optical contrast observed in the SEM (Fig.1) results from a higher saturation of zinc in the magnesium matrix, rather than the precipitation of a new additional secondary phase.
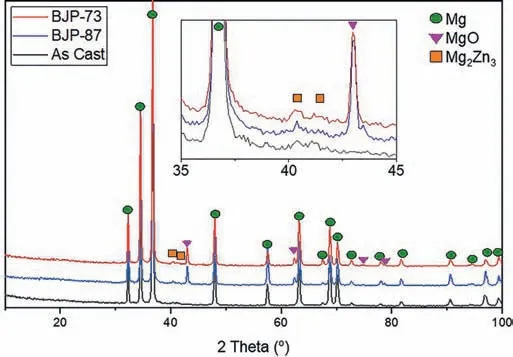
Fig.6.XRD spectra comparison between as cast, BJP-87 and BJP-73 Mg-Zn-Zr magnesium alloy.
The SEM images in Fig.3 revealed that voids are present in BJP samples.These voids represent the pores in the porous structure of the BJP alloys.To better understand and quantification of the porous structure, BJP-87 and BJP-73 BJP samples underwent characterization using the X-ray CT (Figure S1), which shows the 3D tomogram of the morphology and distribution of the magnesium scaffold and the pores within the structure.Fig.7 shows 2D cross section images of BJP-87 and BJP-73, from which the porosity and surface area to volume ratios of the open porosity were determined; the of surface to volume ratio was defined as the amount of surface area per unit volume of the sample.Average pore sizes (Figure S2 and S3) were calculated by assuming spherical pore morphology with a circular cross section.Table 3 shows that according to the X-ray CT analysis, both porosity and surface to volume ratio decreased as the sintering temperature increased, which is due to the chosen sintering temperature controlling the proportion of solid to liquid phase; as determined from the Mg-Zn phase diagram [14].From the X-ray CT analysis, it is possible to conclude that the choice of sintering parameters influences the porosity and the available surface area within the internal structure of the BJP samples;in addition to the elemental composition revealed by elemental analysis.XCT was also used to estimate the actual total surface area of the samples (after taking into considerations the contribution by the pores), revealing the ratio of “as cast”:BJP-87: BJP-73 to be 1: 5: 7.
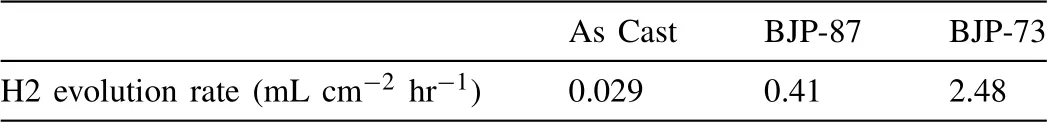
Table 4Hydrogen evolution rate of as cast, BJP-87 and BJP-73 Mg-Zn-Zr magnesium alloy determined from their hydrogen evolution during the first 5 h of immersion in PBS at 37 °C.
3.2.Corrosion performance of “as cast”, BJP-73 and BJP-87
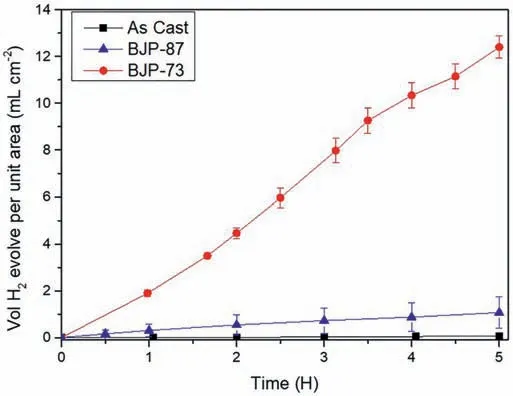
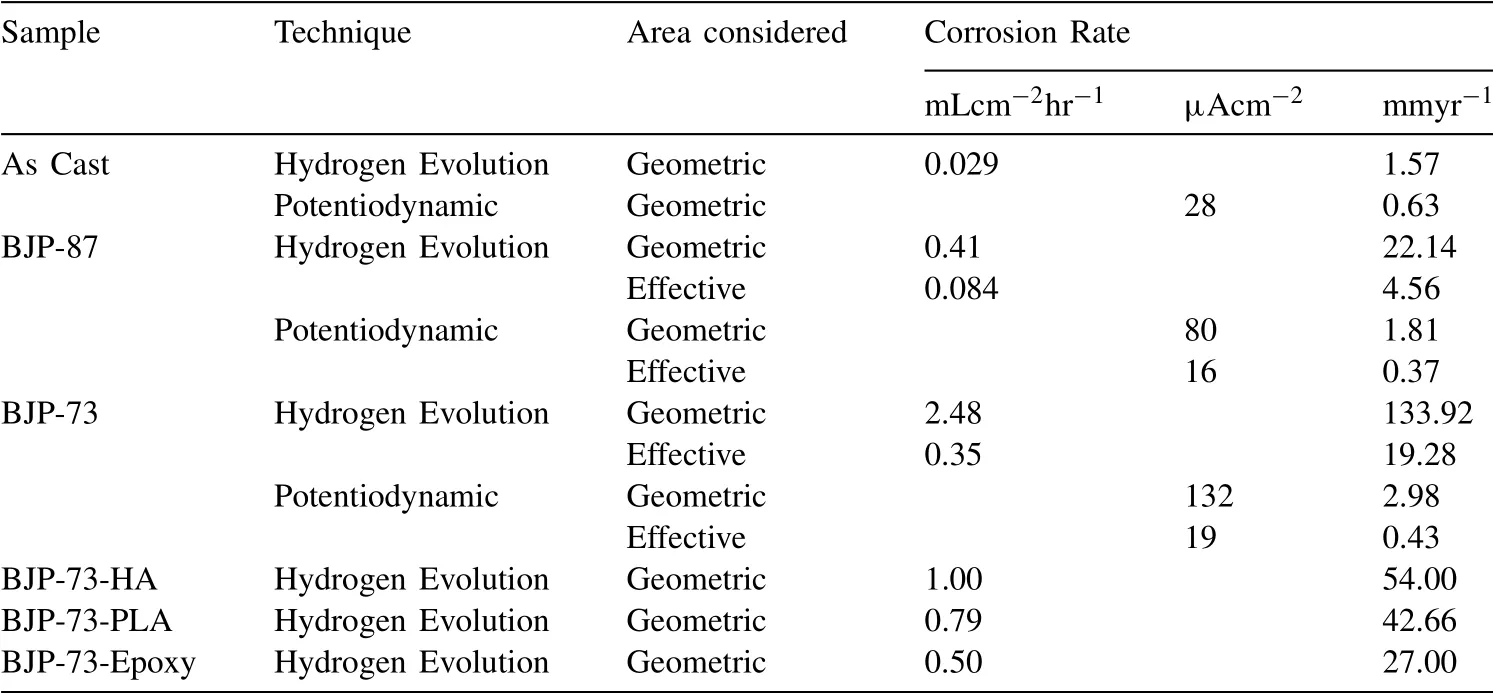
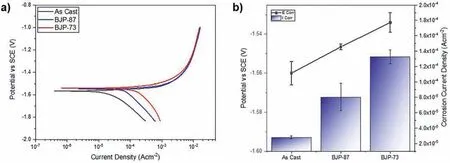
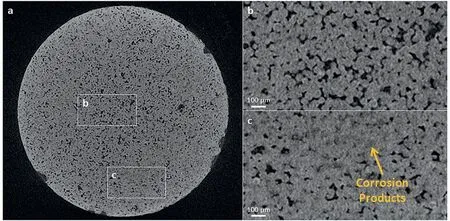
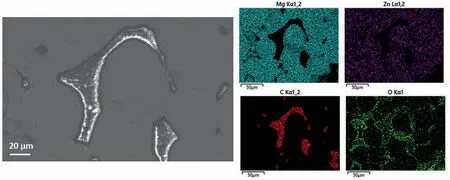
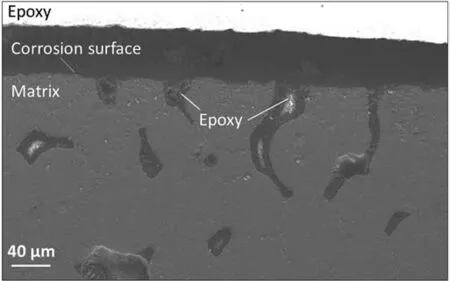
Fig.8 shows the volume of hydrogen evolved per geometric area of the samples during the first 5 h of immersion in PBS at 37 °C.The geometric area was calculated by assuming the samples were perfectly dense cylinders structure.Table 4 reveals that the amount of hydrogen evolved in the immersion tests increased in the order “as cast” Mass loss data (Table 5), following ASTM G1, were calculated to compliment the hydrogen evolution results.For the as cast sample, the ratio of the corrosion rate is 0.54.This is similar to the ratio of corrosion rate of Mg samples measured by H2evolution to mass loss in biological fluid (HBSS) of 0.5 ~0.6 [37].However, this trend was not found with the BJP samples, where the corrosion rates determined by the weight loss approach was either smaller (BJP-87) or equal(BJP-73) their hydrogen gas-based counterparts.It is believed that this is partly due to the chromic acid not removing all the corrosion products within the porous matrix; this affects the BJP-87 more as it has a tighter pore structure than the BJP-73.The limited removal of the corrosion products from the porous matrix by chromic acid was one of the reasons why this work decided to select the hydrogen evolution technique; other reasons being the well document environmental concerns associated with chromic acid and the importance of the body hydrogen uptake limit in biomedical applications. Table 5Comparison of the corrosion rate of As-Cast, BJP-87 and BJP-73 determined from hydrogen evolution and mass loss (ASTM G1); based on geometric surface area. Fig.9a shows the potentiodynamic polarization curves of the BJP and “as cast” samples recorded after being immersed in PBS at 37 °C for 30 mins.The corrosion potentials and corrosion current densities obtained via Tafel extrapolations of the cathodic halves of the polarization curves and presented in Fig.9b.The corrosion potential was observed to shift in the positive direction in the order “as cast” (-1.56 V vs SCE) to BJP-87 (-1.54 V vs SCE) to BJP-73 (-1.53 V vs SCE), whereas the corrosion current densities were in the order with “as cast” (28 μA cm-2) Fig.7.X-ray CT image of the top view of a) BJP-87, b) BJP-73 and side view of c) BJP-87, d) BJP-73 Mg-Zn-Zr magnesium alloy. Fig.8.Volume of hydrogen evolved from as cast, BJP-87 and BJP-73 Mg-Zn-Zr magnesium alloy during the first 5 h of immersion in PBS at 37 °C. Table 6 converts both the current density and hydrogen evolution rate of the BJP and “as cast” samples to corrosion rate, assuming Mg2+being the main corrosion products and using the samples’ geometric surface areas.For the “as cast”Mg-Zn-Zr alloy, its corrosion rate of 0.63 ~1.57 mm yr-1is in good agreement with literature values for alloys of similar composition in biological fluids or sodium chloride: 0.32~1.03 mm yr-1(H2evolution in Hanks’ solution) [36,39];1.5 ~3.5 mm yr-1(mass loss in 0.1 M NaCl) [40]and 1.27~1.37 mm yr-1(Potentiodynamic polarisation in PBS) [41].Although both techniques give the same trend, “as cast” Table 6Volume of hydrogen evolution and potentiodynamic polarization of as cast, BJP-87, BJP-73, BJP-73-HA,BJP-73-PLA and BJP-73-Epoxy Mg-Zn-Zr magnesium alloy presented as corrosion rate during the corrosion process based on geometric and effective surface area. Fig.9.a) Potentiodynamic polarization of as cast, BJP-87 and BJP-73 Mg-Zn-Zr magnesium alloy after 30 mins immersion at OCP in PBS at 37 °C.b)Corrosion potential and corrosion current of as cast, BJP-87 and BJP-73 Mg-Zn-Zr magnesium alloy derived from the polarization curves in (a). Table 6 also shows the corrosion rates after taking into account the effective surface areas, as determined by XCT.As presented in Table 6, after taking into consideration the effective area for corrosion rate determination, the effective corrosion rate is found to be 1: 3: 12 in the ratio of “as cast”: BJP-87: BJP-73;.This means that BJP-73 sample corroding more than ten times faster than as cast samples cannot be explained just by its larger surface area, meaning that additional factors must be played that cause the accelerated corrosion of the BJP samples; similar conclusions can be drawn from a comparison of the mass loss data between the “as cast” and BJP-73 samples (Table S1).It has previously been reported that additive manufacturing processes often have negative impacts on the microstructure including solute segregation,residual stress and also grain sizes [43,44].Geometrically, the porous design of the sample could also lead to the formation of crevices,whose contribution to the increase in corrosion has been previously observed [21].It was proposed by Wu et al.[45]that porous corrosion products within crevices may absorb chloride ions, causing a local rise in their concentration and accelerated corrosion of the Mg alloys even in an alkaline environment; extracted pore solutions were found to be morealkaline (pH 10) than the bulk electrolyte (pH 7).The observed segregation of secondary phases in BJP samples could have led to the observed disproportionate increase in the corrosion rate (Fig.4 and Fig.5), in particular, the presence of magnesium oxide.The surface breakdown of magnesium leads to the formation of corrosion products which have been found to demonstrate cathodic behaviour relative to the matrix [46,47].Further investigation determined those products to be magnesium oxide [48]and magnesium hydroxide [49];the latter forms insitu when MgO is in contact with water.Although the source/origin of the magnesium oxide reported in the literature is different compared to this present work,we do not rule out the possibility of it being a cathode at this stage despite the presence of doubts with regards to the effectiveness of magnesium oxide as a cathode [48]. Fig.10.X-ray CT image showing the overview and cross section of as cast, BJP-87 and BJP-73 Mg-Zn-Zr magnesium alloy after 5 h immersion in PBS at 37 °C. Fig.10 shows a comparison of the corrosion morphologies of the samples, obtained via tomography, after 5 h immersion in PBS at 37 °C; the cross-section images were collected across the middle of the 20 mm long specimens so as to avoid effects from corrosion of the top and bottom surfaces.As expected, the corrosion of the “as cast” sample is limited to the exposed external surface, whereas for the BJP-87 and BJP-73 Mg-Zn-Zr alloy the corrosion extends into the porous structure.It can also be seen that the extent of the corrosion on the external surfaces increased with increasing porosity of the samples.Fig.11 provides more details of the non-uniform corrosion morphology within the pores of the BJP-73 sample,revealing two distinct regions that can be classified as either lack of visible corrosion, (Fig.11b) or filled with corrosion products (Fig.11c).The contrast convention in the XCT is that denser material appears brighter, and less dense material appears darker.While voids will appear completely dark on the tomogram, the corroded region on the other hand will have its void filled with corrosion products, whose contrast resembles those indicated by the arrow in Fig 11c.It is postulated that the non-corroded areas arise in regions where the electrolyte was unable to penetrate into the pores. Although it is possible for XCT to distinguish corrosion products based on their density [50–52], in the case of magnesium the corrosion products are porous [49,53]resulting in them demonstrating a perceived lowered density.The issue is further complicated by the fact that the likely corrosion products (magnesium oxide: 3.6 g cm-3.magnesium hydroxide:2.3 g cm-3) are denser than the parent metal (1.7 g cm-3);i.e.the porosity makes it harder to distinguish the corrosion products from the magnesium itself.In Fig.11, the corrosion products have a higher grey value than the parent magnesium alloy (Figure S4), but less than that of the pore voids (air:1.2 g cm-3).Fig.11 also shows that there appears to be more corrosion products at the edge of the sample near the outer surface, which signifies the higher corrosion rate relative to the surfaces in the pore channels. The fact that the electrolyte is unable to penetrate throughout the entire porous matrix means there is little point in attempting to normalize corrosion rate measurements (regard-less of whether the data is from hydrogen evolution or electrochemical experiments) to the true total surface area (despite this area was estimated via XCT) unless the depth of penetration can be determined; the present XCT does not have this capability even if was willing to place a corrosive inside the sample chamber.Furthermore, the true penetration depth will be a function of the local pH, which will be evolving during the course of the experiments and, in the case of the electrochemical experiments, the applied potential. Fig.11.Xray CT top view of a) BJP-73 Mg-Zn-Zr magnesium alloy after 5 hrs immersion in PBS at 37 °C.(b,c) are zoomed in region as specified in (a). When electrolyte flows into the pore channel,corrosion occurs,and in the case of magnesium,hydrogen will be liberated as cathodic by-product.Although hydrogen is soluble in water at ambient temperature (~1.5 ppm) [54], its limited solubility suggests that there will be a strong likelihood that the accumulation of hydrogen gas pockets within the pore channels becomes significant, disrupting the pathways for electrolyte flow.In addition to the accumulation of hydrogen pockets, a reduction or disruption to the flow of electrolyte within the pores will also result from the deposition of corrosion products. In the presence of a porous structure, it is found that the diffusion kinetics within the structure decrease relative to the bulk electrolyte, with the magnitude dependant on the pore morphology [55,56].Corrosion of magnesium is predominately supported by hydrogen evolution as the cathodic reaction, which results in the production of hydroxide ions causing a local rise in the pH; the bulk electrolyte is found to increase from pH 7 to pH 9, compared to the electrolyte extracted from the pores which was raised to approximately pH 10,at which point the precipitation of magnesium hydroxide from the saturated electrolyte prevents any further raise in pH.In initially neutral to basic media the corrosion kinetics of magnesium decrease as the pH is evaluated, as this favours passivation by Mg(OH)2[57,58], such that any decrease in diffusion kinetics due to pore morphology will mean a lowered corrosion rate at surfaces deep within the porous structure.The XCT image in Fig.11 shows that solid corrosion products do form within the porous structure.In contrast, at the outer surfaces of the specimens spatial separation of the anodic and cathodic regions may occur, especially as it has been reported that oxygen reduction contributes to the supporting cathodic for the corrosion of Mg alloys [59], giving rise to conditions akin to crevice corrosion thereby negating any rise in pH.The presence of carbon dioxide may prevent alkalinity from occurring at the outer surfaces, as well as lead to carbonate containing corrosion products of magnesium [60], but the impact of CO2within the porous structure is expected to be minimal. With the BJP structures having higher surface area, the amount of corrosion is expected to increase even if the corrosion rate is exactly the same.Nevertheless, before the BJP alloys can be adopted for real world applications, it is necessary to reduce its corrosion rate through appropriate modifications.Special considerations will be required to target the internal surfaces of the BJP alloy.However, the application of coatings within a porous matrix is not a trivial matter,for example electrochemical deposition techniques, including anodization and electroplating, are limited by the depth of penetration of the applied electric field; that is the same issue that causes these techniques to be inadequate to measure true corrosion rates deep within porous materials.Therefore,vacuum impregnation methods were chosen due to their simplicity,which can be done either through the direct application of a coating or a filler material to form a composite at theinternal pore walls.Fig.12 shows a polished surface of BJP-73-Epoxy, along with elemental mapping that shows that the pores are filled with polymer; i.e.there are the carbon and oxygen rich regions. Fig.12.SEM images and EDX mapping of pores filled by epoxy on the surface of BJP-73-Epoxy.Pores are filled with carbon and oxygen rich compounds,which originates from the epoxy. Fig.13 shows the total volume evolved and evolution rate of hydrogen from the BJP-73, BJP-73-HA, BJP-73-PLA and BJP-73-Epoxy samples during immersion in PBS at 37 °C.It is observed that the BJP-73-Epoxy demonstrated the lowest hydrogen evolution rate, with the others increasing in the order of BJP-73-PLA, BJP-73-HA and BJP-73.Although visually from Fig.13a it may appear that the corrosion rate accelerates from an initial low value and then trends towards a steady rate, that is the plot of volume of hydrogen evolved against time appears to tend to a linear line.However, upon closer analysis it is found that the plots are still curving upwards, indicating that the rates of hydrogen evolution are still increasing.In turn, this means the corrosion rates have not plateaued, but are continuing to increase at a steady rate as denoted in Fig.13b.Overall, the results show the effectiveness of surface modifications in reducing the corrosion rate of the BJP structure as compared to unmodified BJP-73.Fig.14 shows a cross section of corroded surface after 5 h immersion in PBS at 37 °C, revealing how with the presence of epoxy fillers, the flow of electrolyte into the porous system of the sample is prevented such that corrosion only occurs on the outer surface.Nevertheless, as the corrosion front advances fresh pores will be exposed, which are not plugged by epoxy,causing the corrosion rate to increase.The improved performance of the polymerization approach over the HA coating arises from the fact that former can penetrate deeper into the porous matrix and that the HA is likely forms a more porous barrier. Comparing the polymer filled BJP-73-PLA and BJP-73-Epoxy, the sample filled with PLA demonstrated weaker cor-rosion resistant compared to the BJP-73-Epoxy due to the difference in the interactions between the different polymer and the aqueous electrolyte.While the bisphenol-based epoxy is chemically inert and insoluble in water, the depolymerization of the PLA will occur via hydrolysis [61].With the depolymerization of PLA occurring alongside the corrosion of the magnesium structure, there will be an increase in the exposed metallic surface area in contact with the electrolyte for corrosion to proceed.This difference in corrosion mechanism of the composite structure leads to the difference between the corrosion behaviour of the polymer filled BJP-73-PLA and BJP-73-Epoxy. Fig.14.SEM image showing the cross section of BJP-73-Epoxy, located at the sample edge after 5 h immersion in PBS at 37 °C. Nevertheless, for some applications the hydrolysis of the PLA could be an advantage, for example fully resorbable biomedical implants.Indeed, with the degradation rate of the PLA via hydrolysis able to be varied through the variation in cross linking and molecular weight of the polymer during synthesis to achieve desired properties [62], it may be possible to design bespoke biopolymers that degrade at controlled rates within the Mg porous matrix to suite specific applications.Modifications to the filler in the metal polymer composite could open new possibilities for the functionalization of the polymer to provide additional benefits for their intended applications,such as for controlled drug delivery,through the incorporation of active substances into polymers such as PMMA[63]or PLA [64], which allows for direct drug delivery system to the surgical sites when used for biomedical purposes. In this work,the microstructure and corrosion behaviour of binder jet printed Mg-Zn-Zr samples sintered at 573 °C and 615 °C were systematically studied.The conclusions were listed as follows: 1 Varying the sintering parameters of binder jet printed magnesium alloy samples allows the finetuning of the porosity and pore morphology.A higher sintering temperature yields a lower porosity at the expense of more zinc being evaporated from the alloy 2 Corrosion tests of the binder jet printed and “as cast” Mg-Zn-Zr samples in PBS at 37 °C show that the corrosion rate increases with increasing porosity, such that the order is BJP-73>BJP-87>“as cast” Mg-Zn-Zr.This observation is attributed to possible crevices as well as microstructure induced factors that accelerated corrosion.Potentiodynamic polarization is also found to greatly underestimate the actual corrosion rate of the porous binder jet printed structures, by more than an order of magnitude due to poor penetration of the applied electric field into the pore matrix. 3 The post corrosion morphology of the samples investigated by X-ray Computed Tomography revealed nonuniform corrosion within the porous structure.Hydroxide ions are produced as a by-product of the cathodic supporting reaction,which combined with limited mass transport rates means there will be pH gradients across the depths of the pores that in turn causes variations in the corrosion local corrosion rate. 4 The disproportionate increase in corrosion rate of binder jet printed samples, as determined by hydrogen evolution,suggests that the increase in surface area of the porous samples may not be the only contributing factor to the observed increase in corrosion rate, with microstructural difference induced during the binder jet printed process likely to be the contributing factor, in particular the presence of magnesium oxide segregated along the sinter-neck.The cathodic effectiveness of magnesium oxide has been contentious and more experimental evidence are required before conclusions can be drawn. 5 A preliminary study on the application of coating has shown high effectiveness in retarding the corrosion rate of binder jet printed structures through the reduction in the rate of hydrogen evolution.In particular, polymer coating(epoxy and polylactic acid) is more efficient in reducing the corrosion rate compared to hydroxyapatite coating due to the higher restriction on the electrolyte penetration by the polymer coating Acknowledgements This work was supported by the first Singapore-Germany Academic-Industry (2 + 2) international collaboration grant(Grant No.: A1890b0050) and Agency for Science, Technology and Research (A∗STAR), under the RIE2020 Advanced Manufacturing and Engineering (AME) Programmatic Grant No.A1881b0061.Kai Xiang Kuah would like to acknowledge the support of a scholarship from the A∗STAR Graduate Academy. Supplementary materials Supplementary Tables and Figures Table S1: Ratios of the effective surface areas determined by XCT and the corrosion rates determined by H2evolution and Weight loss.The tight pore structure of BJP-87 sample makes it difficult for the chromic acid used in ASTM G1 to remove all the MgO cor-rosion product causing an apparent low corrosion rate from the weight loss test. Supplementary material associated with this article can be found, in the online version, at doi:10.1016/j.jma.2021.11.016.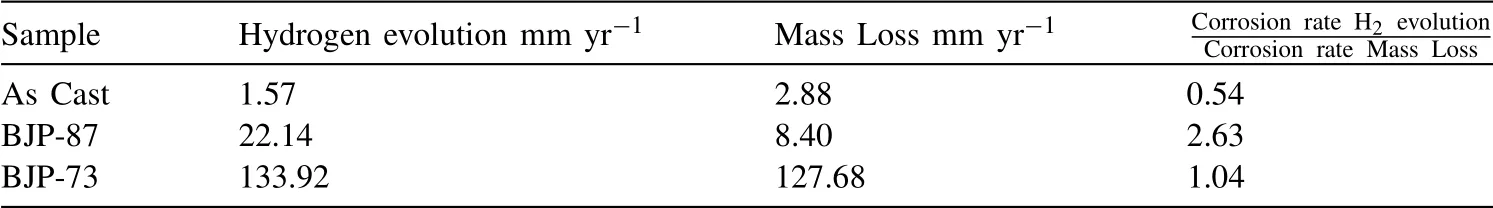


3.3.Morphology of corroding BJP Mg alloy
3.4.Proposed mechanism of the effects of pores on corrosion of magnesium
3.5.Reducing the corrosion rate for BJP alloys / protection methodologies
4.Conclusion
 Journal of Magnesium and Alloys2022年5期