
Generation of stable and tunable optical frequency linked to a radio frequency by use of a high finesse cavity and its application in absorption spectroscopy
2022-06-29 09:18YuetingZhou周月婷GangZhao赵刚JianxinLiu刘建鑫XiaojuanYan闫晓娟ZhixinLi李志新WeiguangMa马维光andSuotangJia贾锁堂
Chinese Physics B 2022年6期
关键词:赵刚
Yueting Zhou(周月婷) Gang Zhao(赵刚) Jianxin Liu(刘建鑫) Xiaojuan Yan(闫晓娟)Zhixin Li(李志新) Weiguang Ma(马维光) and Suotang Jia(贾锁堂)
1State Key Laboratory of Quantum Optics&Quantum Optics Devices,Institute of Laser Spectroscopy,Shanxi University,Taiyuan 030006,China
2Collaborative Innovation Center of Extreme Optics,Shanxi University,Taiyuan 030006,China
Keywords: optical frequency stabilization,spectral measurement,direct absorption spectroscopy
1. Introduction
High precision spectroscopy plays a prime role in a number of research fields, such as test of fundamental laws of physics, high sensitive trace gas detection, and astronomical observation.[1–4]One of prerequisites of the technique is the precise manipulation of optical frequency,which provides an accurate horizontal axis. The advent of optical frequency combs (OFCs) has revolutionized the frequency and time metrology by linking optical frequency to radio frequency.By linking the carrier–envelope offset frequency and the repetition frequency of OFCs to a radio frequency reference,
where the latter is routinely realized through stabilization of the internal cavity length of comb, hundreds of thousands of comb teeth with certain optical frequency is attained. It facilitates high precision spectroscopy by dramatically enhancing its accuracy,resolution and spectral coverage.[5]However,the bulky dimension,complicated operation and high cost restrain its applicability. Moreover, the superior OFCs, like modelocked femtosecond laser in near infrared, are not available in all optical frequency region. Therefore, some other strategies to determine optical frequency are required. Etalon is often utilized as frequency marker, by virtue of its wavelengthdependent transfer function.[6]However,it can only determine a relative frequency variation and the accuracy and resolution are limited.
Fabry–P´erot cavity is an alterative choice. Compared with etalon, it possesses much higher finesse and thus narrower resonant modes.As a result,it is more accurate by using its discrete transmission modes as frequency ruler.[7]Fabry–P´erot cavity with ultra-stable design has been widely used to establish ultra-stable optical frequency reference. Frequency uncertainty of sub-10 mHz at 1.5 μm with observation time of 170 s has been demonstrated.[8]However,in this manner,the frequency resolution, equal to the frequency interval of cavity modes, namely free spectral range (FSR), is limited. The cavity FSR is inversely proportional to the cavity length, and varies usually from hundreds MHz to GHz. In order to refine the resolution, a piezoelectric transducer (PZT) is used,attached to the cavity mirror to detune the cavity length as well as the cavity mode frequency. Nevertheless, due to the drift of the cavity length dominantly caused by the cavity PZT,the fractional frequency instability of the cavity mode is often limited to 10-9,even though the cavity is temperature-controlled and vibration-isolated.[9]To conquer this, some efforts to actively stabilize the cavity length have been made. For example, by locking two cw-lasers to their corresponding external cavity modes, their beat frequency, equal to multiple of the cavity FSR,as well as the cavity length could be stabilized to a RF reference by feeding the error signal back to the cavity length.[10,11]In consequence, thenth cavity mode frequencyfncould be determined with the expression

where Δforiginates from the dispersive phase shift of the cavity mirror,[11]andffsris the cavity FSR.Thus the optical and radio frequencies are linked by a chain offered by the optical cavity. Another method with similar principle was proposed by Devoe and Brewer.[12,13]A cw laser passes through an optical phase modulator, driving by a RF signal atfm, to generate a pair of sidebands. By simultaneously locking the cw laser frequencyflaserto the cavity mode with Pound–Drever–Hall (PDH) technique and the multiple of the cavity FSR to thefmwith named Devoe–Brewer(DVB)technique,theflaseris stabilized. Its effectiveness has been demonstrated at visible and near infrared region.[12,14]Compared to the former,this method is simpler and more compact since it avoids the employ of two lasers. Additionally,due to the accelerated development of optical technology, this method is applicable to broad spectral range from visible to terahertz. Nevertheless,in the previous work, the stability was inaccurately predicted and comprehensive analysis of the performance has not been executed.[12,14]Moreover, its generalization is limited by the usage of a massy dye ring laser.And its capacity to application has not been evaluated.
In this paper,we build a system to obtain a stable and tunable optical frequency with an external optical cavity by using the combination of PDH and DVB locking techniques. It is based on a fiber laser,which is more compact and economical compared to its first implementation. Several means to minimize interference effect,so as to improve the long-term stabilization, are implemented. With the help of frequency comb,the cavity mirror dispersion and the locking performance are analyzed.Finally,the application of the stabilized laser to high precision spectroscopy and trace gas detection has been tested.
2. Experimental setup
The experimental setup is shown in Fig. 1. An Erbium doped fiber laser (EDFL, NKT K84-151-14), emitted at 1530 nm with output power of 36 mW, is utilized as light source. It addresses thePe(10) transition of C2H2at 6531.7803 cm-1with linestrength of 4.0×10⁻²¹cm-1/(molecule·cm-2). The output laser passing through a fiber-coupled acousto-optic modulator(f-AOM,AA opto-Electronic, MT110-IR25-3FIO), accompanied with the laser internal PZT,is used to actuate the laser frequency. After a fiber splitter (f-s), part of the laser is sent into a fibercoupled electro-optic modulator(f-EOM KY-PM-15-10g-PPFA)with a proton exchange waveguide to avoid residual amplitude modulation (RAM). Two frequencies, i.e.,fPDHat 25 MHz andfDVBat 380.682 MHz, are simultaneously sent to a combiner and then drive the f-EOM to generate two pairs of sidebands for PDH and DVB locking, respectively. The two RF frequencies are disciplined to a 10 MHz rubidium oscillator. By an fiber collimator(f-C),the light is coupled into free space, and then passes through a matching lens (MML),a half-wave plate(λ/2),a polarization beam splitter(PBS),a quarter-wave plate(λ/4)and finally impinges into the FP cavity. The reflected light from the cavity front mirror is deflected by the PBS to a high bandwidth photodetector(PD1,New Focus, 1611). An off-axis parabolic mirror (OAP), rather than a focus lens, is preferred to focus the light on the detector to less the unwanted interference. In order to further reduce interference effect,the optical components are tilted and located at etalon immune distance.[15]
The Fabry–P´erot (FP) cavity comprises a pair of highreflective mirrors, among which the input mirror is plane–plane and the output mirror is plane–concave with a radius of curvature of 1 m. The reflectivity of cavity mirror is 99.997%,resulting in a cavity finesse of 9.6×10⁴. Both mirrors are mounted on a piezoelectric transducer(PZT)and separated by a Zerodur spacer with a length of 39.4 cm, corresponding to the cavity FSR of 380.6 MHz.
The signal detected by PD1 is demodulated atfPDHto get the error signal for PDH locking, which is, then, sent to the homemade servo(PID1). The resulted correction signal is fed to the laser PZT and the driving frequency of the f-AOM to lock the laser to the cavity mode with the bandwidth of 200 kHz. Another part of the PD1 output is demodulated at the difference frequency offDVBandfPDHfor DVB locking.The error signal is sent to PID2 (Stanford Research System,SIM960) and then fed to the cavity PZT. Consequently, the cavity length as well as theflaseris locked to the radio frequency reference according to Eq.(1). After that,theflasercan be consecutively and finely detuned by varying thefDVB.
To further analyze the locking performance, a portion of the laser beam is separated by the f-s. It is, then, combined with a frequency comb centered at 1.5 μm by a fiber coupler, shown in part A of Fig. 1. After hitting on a reflective diffraction grating,the light is extended in one dimension according to wavelength and then detected by the PD2(New Focus,1611)). The absolute laser frequency can be then deduced from the beat frequency,measured by a spectrum analyzer,between the cw-laser and the frequency comb teeth.
To apply this stabilized laser to spectroscopic measurements, the separated light could be also coupled into a direct absorption spectrometer with balance detection scheme,shown in part B of Fig. 1. In order to reduce the relative intensity noise,balanced detection is implemented and the light passes through a polarizer followed by a 1:1 splitter. Part of the light transmits through a gas cell filled with pure C2H2at 50 Torr and is collected by a photo-receiver of the homemade balance photodetector(BPD),while the other is directed to another photo-receiver of the BPD as a reference.
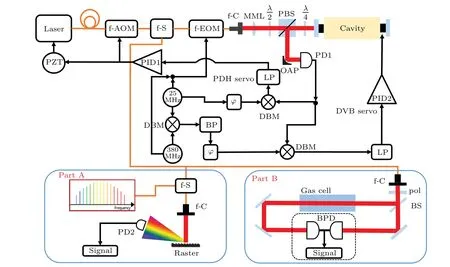
Fig.1. Experimental setup. f-AOM,fiber-coupled acoustic optic modulator;f-s,fiber splitter;f-EOM,fiber-coupled electro-optic modulator;f-C, fiber-coupled collimator; MML, mode matching lens; λ/2, half-wave plate; PBS, polarization beam splitter; λ/4, quarter-wave plate;PZT, piezoelectric actuator; PD1,2, photodetectors; PID1,2, proportion-integration-differentiation; φ, phase shifter; BP, band pass filter; LP,low pass filter;DBM,doubled balance mixer;pol,polarizer;BS,beam splitter;BPD,balance photodetectors.
3. Experimental results
3.1. In-loop and out-loop noise
The evaluation of locking performance,in term of in-loop noise and out-loop noise, were carried out: the former offers the knowledge of the limitation of the locking, while the latter,resulting from the beat note with the frequency comb,implies the capability of absolute frequency stabilization. The in-loop noise were assessed by recording the error signals of the two lockings with the sampling rate of 200 kHz over 10 s,shown in the upper panels of Fig. 2. They-axis, in terms of relative frequency variation, is calibrated by the cavity mode width(4 kHz in our case). The frequency noise spectral density are plotted in the low panels. Both curves show a value lower than 10-2Hz2/Hz at low frequency region, which indicates the gains of the PID servos in this region are large enough to compensate most of the excess noise and the longterm drift. The spectral density for the PDH locking, i.e.,the curve in the left panel,does not exceed 1 Hz2/Hz in the whole range except some discrete point. While the spectral density for the DVB locking has a relatively low and flat value around 10-3Hz2/Hz, which will be multiplied by the cavity mode numbernand then transferred to the laser frequency thus dominate the performance of the frequency reference.For our case,nis larger than 5×10⁵,yielding a laser frequency deviation of around 1.5 kHz.
With the aid of the frequency comb,the drift of the laser frequency,i.e.,the out-loop noise,was monitored with acquisition rate of 10 Hz and shown in Fig.3.The curve in Fig.3(b)represents the free-running laser frequency over 0.3 hour. It drifts, at a range larger than 25 MHz, predominantly because of the stretch of the laser PZT induced by the temperature variation.While with locking,the laser frequency is stabilized and keeps approximately constant over 5 hours, shown as a relatively flat line in the panel(a). Meanwhile, the Δfin Eq.(1)was determined to be 9.9 MHz,which can be considered constant in the laser frequency range of dozens of GHz. The solid lines in Fig. 3(c) are the corresponding Allan plots. The statistical confidence is also shown in the plot as error bars. The curve for the free-running laser, i.e., the line in blue, directly goes up, indicating its noise at low frequency is enormous.While the line in black verifies that, with locking, the drift is suppressed to a large extent.And it reaches to the lowest value of 50 kHz at integration time of 0.4 s,corresponding to a relative frequency uncertainty of 2.6×10⁻¹⁰,and does not exceed 110 kHz even at the integration time longer than 2.5 h. While,the residual drift of the locked laser is suspected to be caused mainly by the drift of the electronic set point of the DVB servo and could be ameliorated by use of a high-class voltage reference.
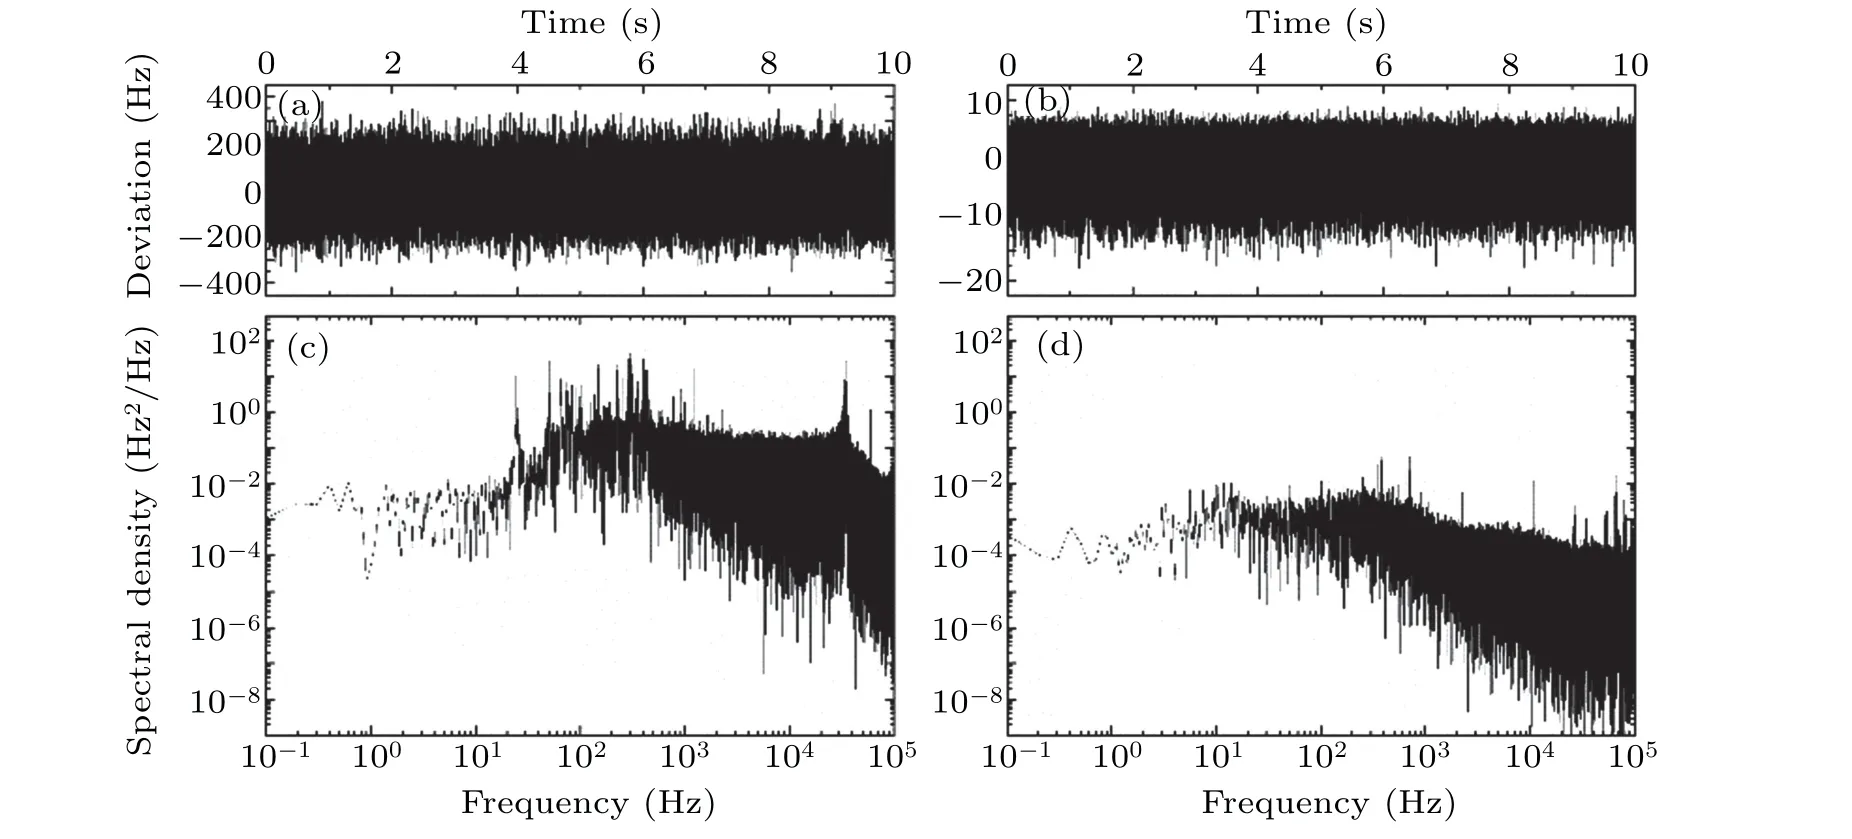
Fig.2. The frequency deviation of(a)PDH and(b)DVB locking and the frequency spectral density of(c)PDH and(d)DVB locking deviation.

Fig. 3. The measured frequency drift of the beat frequencies between the laser and the comb teeth with(a)and without(b)locking. (c)The Allan deviation of the beat frequencies with(line in black)and without(line in blue)lock. The statistical confidence is also shown in the plot as error bars.
3.2. Application to laser spectroscopy
To test its ability for laser spectroscopy, the laser frequency is detuned by stepping thefDVBwith the step of 10 Hz and thePe(10)transition of C2H2is investigated.[16]The black dot in Fig.4 is the measured direct absorption signal with balanced detection and the red line is the Voigt fitting result.Each data point is averaged over 150 times with the total recording time of 142 s. The lower panel is the fitting residual and the signal to residual ratio of 600 has been obtained. With the knowledge of pressure induced shift,[17]the transition central frequency is deduced to be 195817848.40 MHz with statistical uncertainty of±0.10 MHz,which is only 0.03 MHz away from the value provided by Ref.[18].

Fig.4. The measured(line in black)direct absorption spectrum of the C2H2 at P=50 Torr,T =300 K and the Voigt fitting result(line in red).The lower panel is the fitting residual.
Then,to further test its applicability,we keep the laser frequency at the center of the C2H2transition and measured the cell transmission signal consecutively. This scheme is often employed to get the target gas concentration in the fields like atmospheric lidar and industrial process control. The black and blue lines in Fig.5(a)show the transmission signals with and without locking, respectively, measured more than 1.5 h.When the laser frequency is free running,the transmission signal drifts monotonically, which owes to the drift of the laser frequency leading to a divergence from the transition center.While, with locking, the laser frequency stays at the transition center and consequently the signal is stable. The curves in Fig. 5(b) are the corresponding Allan plots and its vertical axis represents detectable optical density. It is clear to see,without locking, the blue curve is dominated by the drifts in all integration time range. For the locked laser, the improvement of long-term stability by 2-orders-of-magnitude has been demonstrated through the comparison of the Allan deviations at 100 s. A minimal detectable optical density of 9.4×10⁻⁶at 21 s is resulted, which is 40 times better than that without locking at the same observation time.
4. Conclusion and perspectives
The optical frequency of a fiber laser is stabilized and controlled by use of one external high finesse cavity based on the PDH and DVB locking. The locking performance has been comprehensively investigated. The analysis of the outloop noise by referring to a frequency comb shows that the instability can be restricted to 50 kHz,corresponding to a relative frequency uncertainty of 2.6×10⁻¹⁰, and does not exceed 110 kHz within 2.5 hours. The limitation of the current system is speculated from the electronic part,i.e., the drift of the locking offset. Although the generation mechanism of frequency of this method is similar to that of OFCs,both originating from the link between cavity FSR and RF frequencies,the frequency uncertainty is still much worse than that of OFCs,assumedly limited by the broadening cavity mode width and stability of the voltage reference for theffsrlocking. Finally,an absorption spectrum is measured based on this stabilized laser with balance detection scheme and the detection sensitivity can be down to 9.4×10⁻⁶at integration time of 21 s,which is much better than the conventional direct absorption spectrometer.This opens up for the construction of a compact,stable and robust laser source for precision spectroscopy.
Acknowledgements
Project supported by the National Key R&D Program of China (Grant No. 2017YFA0304203), the National Natural Science Foundation of China (Grant Nos. 61875107,61905136, 61905134, 62175139), Scientific and Technological Innovation Programs of Higher Education Institutions in Shanxi, China (Grant No. 2019L0062), Opening Foundation of Key Laboratory of Laser & Infrared System (Shandong University).
猜你喜欢
健康体检与管理(2022年4期)2022-05-13
Plasma Science and Technology(2020年4期)2020-05-06
故事会(蓝版)(2020年4期)2020-04-28
今古传奇·故事版(2019年9期)2019-09-27
微型小说选刊(2019年3期)2019-09-10
美与时代·美术学刊(2019年3期)2019-04-27
短篇小说(原创版)(2018年5期)2018-10-27
短篇小说(2018年5期)2018-07-13
黄河黄土黄种人(2018年11期)2018-01-23
小小说大世界(2017年11期)2017-11-27
- Chinese Physics B的其它文章
- Ergodic stationary distribution of a stochastic rumor propagation model with general incidence function
- Most probable transition paths in eutrophicated lake ecosystem under Gaussian white noise and periodic force
- Local sum uncertainty relations for angular momentum operators of bipartite permutation symmetric systems
- Quantum algorithm for neighborhood preserving embedding
- Vortex chains induced by anisotropic spin–orbit coupling and magnetic field in spin-2 Bose–Einstein condensates
- Short-wave infrared continuous-variable quantum key distribution over satellite-to-submarine channels