
Measurement of 232Th(n,γ)cross section at the CSNS Back-n facility in the unresolved resonance region from 4 keV to 100 keV
2022-06-29 08:57BingJiang姜炳JianlongHan韩建龙JieRen任杰WeiJiang蒋伟XiaoheWang王小鹤ZianGuo郭子安JianglinZhang张江林JifengHu胡继峰JingenChen陈金根XiangzhouCai蔡翔舟HongweiWang王宏伟LongxiangLiu刘龙祥XinxiangLi李鑫祥XinrongHu胡新荣andYueZhang张岳
Chinese Physics B 2022年6期
Bing Jiang(姜炳) Jianlong Han(韩建龙) Jie Ren(任杰) Wei Jiang(蒋伟)Xiaohe Wang(王小鹤) Zian Guo(郭子安) Jianglin Zhang(张江林) Jifeng Hu(胡继峰)Jingen Chen(陈金根) Xiangzhou Cai(蔡翔舟) Hongwei Wang(王宏伟)Longxiang Liu(刘龙祥) Xinxiang Li(李鑫祥) Xinrong Hu(胡新荣) and Yue Zhang(张岳)
1Shanghai Institute of Applied Physics,Chinese Academy of Sciences,Shanghai 201800,China
2CAS Innovative Academy in TMSR Energy System,Chinese Academy of Sciences,Shanghai 201800,China 3University of Chinese Academy of Sciences,Beijing 100049,China
4Key Laboratory of Nuclear Data,China Institute of Atomic Energy,Beijing 102413,China
5Institute of High Energy Physics,Chinese Academy of Sciences,Beijing 100049,China
6China Spallation Neutron Source,Dongguan 523803,China
7Shanghai Advanced Research Institute,Chinese Academy of Sciences,Shanghai 201210,China
Keywords: 232Th(n,γ)cross section,CSNS Back-n facility,C6D6 detectors,unresolved resonance region
1. Introduction
Nowadays, the energy of nuclear fsision has incomparable advantages in serving the ever growing requirements for energy and environmental protection. Compared to the traditional uranium–plutonium fuel cycle, the importance of thorium-based nuclear fuel has become increasingly prominent because of its excellent breeding capability in both thermal and fast reactors,lesser long-lived minor actinides resulting from fission, and abundant reserves of thorium.[1]Either the critical or the subcritical system based on Th–U fuel cycle becomes the focus of attention presently, such as the thorium molten salt reactor nuclear energy system(TMSR)[2]and the accelerator-driven sub-critical system (ADS).[3]The design and development of these innovation nuclear systems require precise neutron nuclear data of the key isotopes, since the simulation of the performances for these systems strongly depends on the cross sections of neutron-induced reactions. In this scenario,an accurate knowledge of the232Th(n,γ)cross section is of great importance in the thorium–uranium fuel cycle which is based on the fissile233U formed by neutroninduced capture on the fertile232Th.
The TMSR system is designed for thorium-based nuclear energy utilization and it is committed to achieving the comprehensive utilization of nuclear energy.[1,2]The use of thorium can significantly reduce the generation of high-level radioactive waste of spent fuel,which is an interesting advantage compared to the uranium fuel.For TMSR,232Th is the‘beginning’nuclide of the thorium–uranium cycle chains,which makes the neutron capture data of232Th an essential input for the critical performance and safe operation of the reactor core. In addition, a sensitivity analysis of nuclear data for the Th–U fuel cycle in the molten salt reactor shows that a 1% disturbance of the232Th neutron capture cross sections would result in a 0.35%change of thekefffor the core system,[4]which makes the accurate measurement of232Th(n,γ)cross section important for serving the neutron nuclear data requirements of the TMSR system.
The available data of232Th(n,γ)cross section are mainly from evaluated nuclear data libraries or existing experimental data included in EXFOR. In recent years, several measurements of232Th (n,γ) cross section have been performed using the time-of-flight technique at different white neutron sources, e.g., n TOF[5,6]and GELINA.[7,8]Although most of these experiments were carried out with high precision, the discrepancies of232Th(n,γ)cross sections still exist and cannot be ignored. The Back-n facility[9,10]is a newly built timeof-flight spectrometer at the China Spallation Neutron Source(CSNS),[11,12]which has been constructed with the aim of studying the neutron-induced reaction cross section for supporting the eminent demands for an enhanced nuclear database in China.[10]With a wide neutron energy spectrum,high neutron flux,and high time resolution of the Back-n facility,it motivates a232Th(n,γ)cross section experiment with high accuracy. No other work of the232Th(n,γ)cross section measurement has been performed at this facility before. The present work reports the data analysis procedure and the results of232Th (n,γ) cross section in the unresolved resonance region(URR)from 4 keV to 100 keV.The values of the experimental cross section are included in the supplementary materials(SM)in the form of excel files,which are openly available at http://dx.doi.org/10.11922/sciencedb.j00113.00015. Because the data analysis and the type of result presentation in the resolved resonance region(RRR)are significantly different from those in the URR,the results in the RRR will be described in detail in another literature to be published.
The rest of this paper is organized as follows. Section 2 provides a description of the experimental details. The data analysis procedure is described in Section 3. In Section 4,the results of experimental cross section are given and discussed.The excitation function of232Th (n,γ)233Th reaction calculated by using the theoretical code TALYS[13]is presented.In addition,the parameters used to describe the average cross section in the URR are also given in this section. The conclusions are presented in Section 5.
2. Experimental details
The measurement of232Th (n,γ) cross section has been performed at the Back-n time-of-flight facility of CSNS operated with the double-bunch mode. At Back-n, the primary neutrons are generated by spallation reactions induced by a 1.6 GeV/c proton beam impinging on a tantalum-cladded and water-cooled sliced tungsten target.[14]These primary neutrons are subsequently moderated by the spallation target itself and the surrounding moderators until they enter the evacuated neutron transport tube of the Back-n facility. Two experimental stations are located on the beam line at flight path lengths of approximately 55 m(ES#1)and 76 m(ES#2)from the spallation target. The present232Th (n,γ) measurement was performed at station ES#2, taking advantage of the lowγ-rays background and excellent neutron energy resolution. A detailed description about the characteristics of the Back-n facility can be found elsewhere.[10,16]The Monte–Carlo calculation indicates that the time resolution is better than 1% at the experimental station which is located about 80 m away from the tungsten target in the energy range of 1 eV–1 MeV when the accelerator works in the single-bunch mode.[14,15]Therefore, the neutron energy can be accurately deduced by the time-of-flight technique.
A disk-shaped232Th sample of 0.82 mm in thickness,corresponding to 1.819×10⁻³atoms/barn was used for the measurement. A natural carbon sample with the same diameter was used to evaluate the background resulting from sample scattered neutrons. In addition, a gold sample, as a standard isotope whose (n,γ) cross section is well-known, was measured under the same condition to verify the data analysis procedure.The characteristics of the samples are listed in Table 1.Besides,an empty holder measurement was also carried out in order to estimate the background that is independent of the232Th sample.

Table 1. Characteristics of samples.
The promptγ-rays from the neutron capture of232Th were detected with four hydrogen-free deuterated benzene C6D6liquid scintillation detectors, which have been widely used for high resolution neutron capture cross-section measurements at the time-of-flight facilities by using the total energy detection principle in combination with the pulse height weighting technique(PHWT).[17–19]Figure 1 shows the C6D6detector system which consists of four C6D6detectors, one aluminum detector bracket and one sample holder. The type of the liquid scintillator in the C6D6detectors is EJ315, and the aluminum shell wrapped around the scintillator is approximately 13 cm in diameter and 7.62 cm in thickness. In addition, an ETEL 9390KEB photomultiplier tube covered by an aluminum shell is directly mounted onto the scintillator. The four C6D6detectors were installed at an angle of 110°relative to the direction of the neutron beam and about 15 cm(distance between the detector center and the sample center) upstream from the capture sample. Such experimental setup with backward angular of the detectors can sufficiently reduce the background resulting from scattered neutrons from the sample and the neutron beam dump.
The calibration of the C6D6detector system was performed by measuring the response to three different radioactive sources of137Cs(662 keV),22Na(551 keV and 1274 keV)and238Pu/13C(composite source,6129 keV).Geant4 Monte–Carlo simulation together with experimental measurement of the deposited energy spectra of each source were performed for the detectors. The calibration results are reported in the literature.[20]
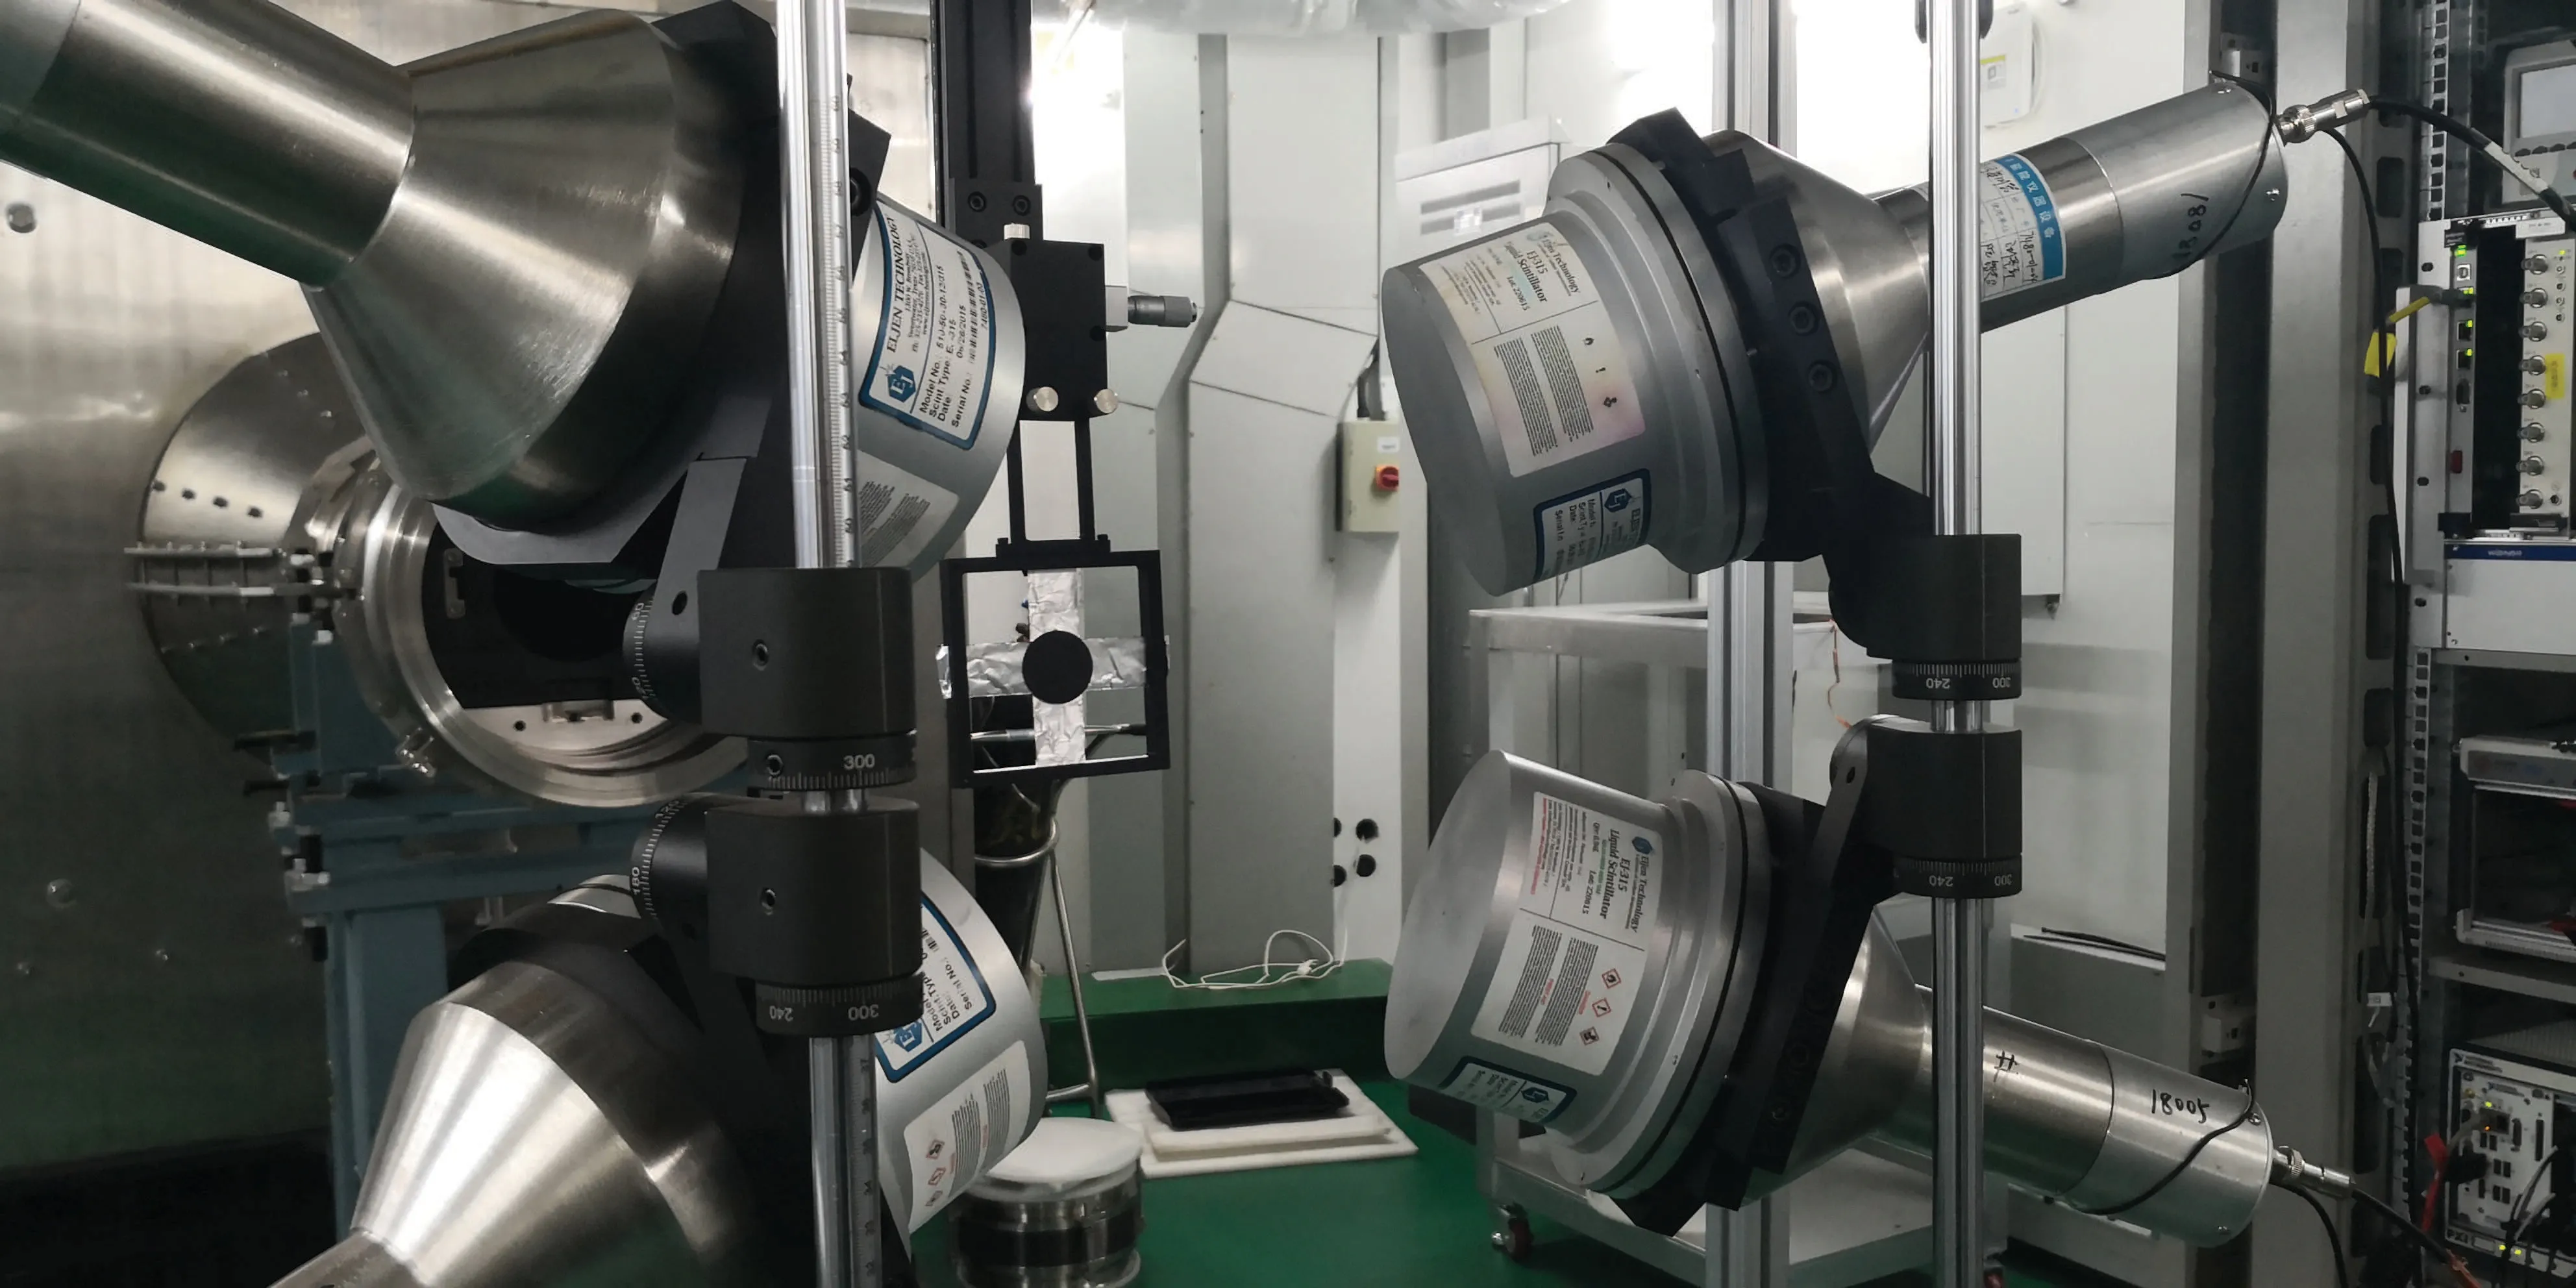
Fig.1. C6D6 detector system at Back-n.
The data acquisition system records the full pulse shape using flash ADCs with 1 GS/s sampling rate and 12 bits resolution. A trigger signal from the pulsed proton beam starts the data acquisition, and all trigger signals from each proton pulse are recorded in the raw data for off-line analysis. The preprocessed data including neutron time-of-flight(TOF)and pulse height spectra (PH spectra) of gamma from the C6D6detector are extracted from the raw files with the data analysis framework ROOT.[21]
3. Data analysis
The neutron capture yieldY(En)as a function of the incident neutron energyEnis determined by

whereC(En) andB(En) are the respective counting spectra measured by the C6D6system for the sample and the background.εc(En)is the efficiency of the detector system to detect a capture event, andΦ(En) is the neutron incident flux.The determination of neutron energy, the deduction of different background components, the correction of detector efficiency and the determination of incident neutron flux are described in the following sub-sections.
3.1. Determination of neutron energy
At Back-n,the kinetic energy of a detected neutron is deduced from the length of the flight path(L)and the flight time(Tn)of the neutron via the classical formula

Experimentally the flight timeTnis derived from the time difference between the neutron production and the detection of reaction products(theγ-rays in capture measurement). As the flight time of the so-calledγ-flash which originates from the proton spallation reaction can be accurately determined by the distance(L0)between the outer surface of the spallation target and the front face of the detector, it is usually used as a time reference in TOF measurements. The TOF of each neutron is given by

whereTeis the stop signal that represents the moment of the observed time of neutrons,Tsis the start signal which origiantes from the arrival of theγ-flash at each detector.L0/cis the time spent ofγ-ray’s transport in the vacuum tube. The flight path lengthLis the sum of the fixed distanceL0and an energy-dependent term ΔLthat results from the neutron moderation process in the spallation target. In this work,Lwas calibrated by using a measurement of standard resonances of197Au and an average length of about 76.69 m was used to calculate the neutron energy.[22]The measurements of the197Au(n,γ) cross section can be found in the literature.[23,24]For obtaining the experimental counting spectrum,a series of parameters were extracted and analyzed from the digital waveforms of the C6D6detectors, i.e., the amplitude, the baseline and signal area.[25]
3.2. Background deduction
An accurate evaluation of the backgrounds is of great importance for this work. The dedicated study on background for neutron capture cross section measurements with C6D6detectors at Back-n can be found in the literature.[25]Figure 2 shows the experimental counting spectra mesured by different samples,which are all normalized by the counting of a Li–Si monitor detector. Several types of backgrounds contribute to the present measurement,which can be calculated by

The time-independent backgroundB0mainly comes from the natural environment, the radioactivity of the232Th sample and the activation of materials around the detector system.This background has been estimated by a series of measurements with the accelerator shutting down.
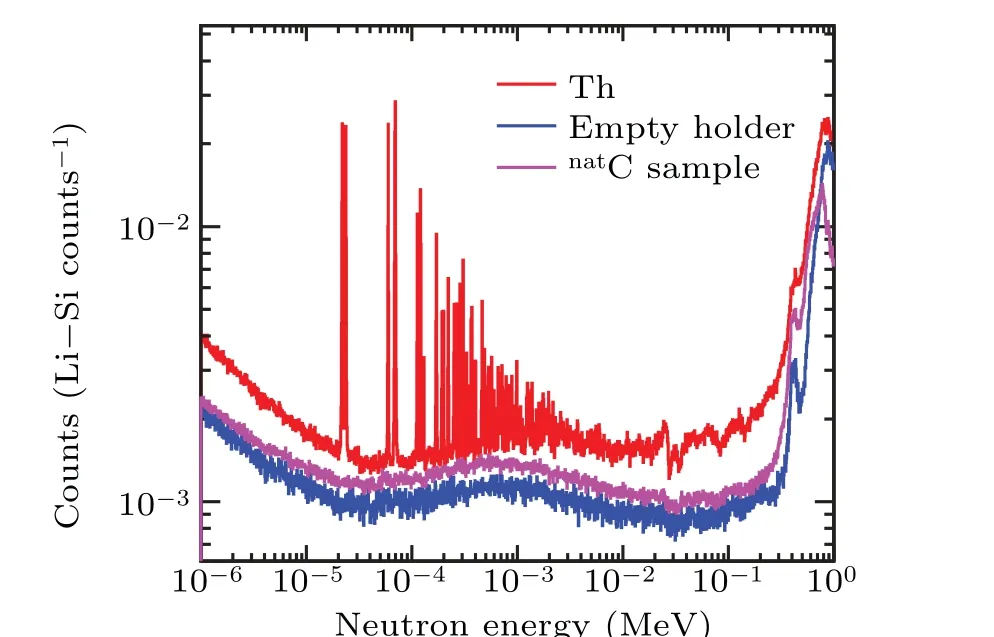
Fig.2. Counting spectrum of 232Th sample,accompanying with different components of background.
The sample-independent backgroundBem(En) originates from the neutron beam reactions with anything other than the232Th sample. Namely, it represents all the effects caused by the neutron beam but not by the sample. This background component is evaluated by a measurement of empty-sample holder with the neutron beam switched on.
Another source of backgroundBs(En) is attributable to the neutrons scattered from samples. Some scattered neutrons would be thermalised and captured by the materials around the detectors. The resultingγ-rays are recorded by the C6D6detectors and will inevitably contaminate the capture yield from the232Th sample. This background can be evaluated by a measurement of a natural graphite sample (natC) which has a quite small capture cross section but a considerably high scattering cross section. For calculating the scattering neutron background of thorium, a ratioηthat represents the difference between the scattered neutrons from the232Th sample and thenatC sample is calculated by the Geant4 Monte–Carlo simulation.[26]This background component can be expressed as

whereNC(En)andNEM(En)represent the experimental spectra of the graphite sample and the empty holder, respectively.Figure 3 shows the ratioηas a function of neutron energy,which was obtained by simulating the number of the scattered neutrons entering the detectors from the232Th sample and thenatC sample.[6,25,27]The ratioηis related to the atomic density and the neutron scattering cross section of the samples. And the product ofηand the experimental spectra of thenatC sample were used to evaluate the scattered neutron background of232Th. The systematic uncertainty ascribed to the background deduction propagates into the final capture yield according to the signal-to-background ratio.By comparing the TOF spectra measured with the empty holder and the232Th sample,an uncertainty of about 1.5%–1.9%was deduced in the URR from 4 keV to 100 keV.[28,29]

Fig.3. Ratio η as a function of neutron energy.
3.3. Detector efficiency
Theγ-ray detection from a neutron capture event is related to the de-excitation path of a compound nucleus, which means that the actual count directly observed in the detector system is not equal to the count of capture events expected. Considering the multiplicity of theγ-ray cascade,the PHWT[17–19]has been applied in the data analysis procedure,which is based on the following two conditions:[19](1)the efficiency to detectγ-rays (εγi) must be low enough to assure that at most only oneγ-ray of a capture cascade is detected at a time. The total efficiency to detect a capture event (εc) can be approximately calculated by
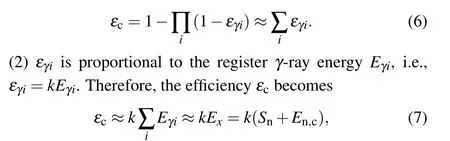
whereExrepresents the excitation energy of the compound nucleus system,which equals the sum of neutron binding energySnand incident neutron kinetic energyEn,c. With Eq.(7),the detection efficiency is independent of the details of theγ-ray cascade path and becomes neutron energy-dependent. Unfortunately,for the C6D6detector system,εγiis small enough but it is not directly proportional to theγ-ray energy. Therefore,the correction of the detector efficiency toγray is indispensable.


Fig.4. Geometry of the detector system used in Geant4 simulation.
In this work, the WF is determined by simulating the detector response functions of a series of monoenergeticγrays released from the sample using the Monte–Carlo toolkit Geant4.[26]The detailed geometry of the complete experimental set-up including the detectors and sample, displayed in Fig. 4, is taken into account in the simulation. The details on the applications of PHWT and the calculatios of WF for the C6D6detector system at the Back-n beam line of CSNS are explained extensively in the literature[20]and references therein.
Figure 5 shows the detector efficiency before (Fig. 5(a))and after weighting(Fig.5(b)).The ratioQ(Fig.5(c))between the weighted efficiency andγ-ray energy is usually used to estimate the quality of PHWT.An expected value of 1 forQat different incidentγ-ray energies shows a great rationality of the weighting function in the energy range of interest. The deviation at low energies is caused by that the threshold ofγ-ray energy used in the simulation is 150 keV,and the detectors are impossible to record valid signals at the low energy due to the experimental limitations.

Fig. 5. Detector efficiency before (a) and after weighting (b). By the weighting procedure,the ratio between the detector efficiency and γ-ray energy is equal to 1(c).
After the correction of the detector efficiency,the experimental capture yieldY(En)is calculated via

withCwandBwbeing the weighted count spectra of the sample and the background. The proportionality constantkis taken equal to 1 MeV-1.Φ(En) andExin Eq. (10) have the same meaning as in Eqs. (1) and (7), respectively. In this way, the experimental neutron capture yield can be calculated without considering the actual cascade path.Several systematic effects related to the PHWT contribute to the final yield, i.e., the efficiency of more than oneγ-ray detected in a capture cascade(see Eq. (1)), the adequacy of the WF used, the reduction of cascadeγ-ray due to the electron internal conversion process,the count loss due to the energy threshold and so on. These effects have been discussed extensively in the literature,[18–20,30]and the systematic uncertainty of the experimental neutron capture yields from the PHWT is about 2%.[18]
3.4. Neutron flux and normalization
AlthoughΦ(En)is crucial for the calculation of the capture yield (see Eq. (10)), the absolute value of neutron flux incident on the sample is unknown in the capture cross section measurement. This issue is solved by the so-called saturated resonance technique.[31]
In the previous work, the235U/238U multi-layer fission ionization chamber (MFC) based on the235U (n,f) reaction was used to measure the relative energy dependence of neutron flux(i.e.,the source neutron energy spectrum)up to hundreds of MeV.[32]And at neutron energies below 10 keV, the Li–Si neutron monitor based on the detection of6Li(n, t)4He reaction product was applied to measure the flux with less obvious resonance structures.[33]The relative neutron flux (see Fig.6)adopted for the calculation of capture yield is the pointwise data from the experimental results of these two detectors, with an overall systematic uncertainties about 8% for neutron energies between 4 keV to 100 keV. More details on the neutron energy spectrum evaluation can be found in the literature.[32,33]As shown in Fig.6,this spectrum is a combination of the measurement results in ES#1 and ES#2,and it is widely used in the capture measurements at Back-n at present.The fluctuation in the measured flux, especially at low energies, is related to the resonance structure of the materials in the neutron beam and the detector.
In the data analysis of232Th(n,γ)cross section measurement, the absolute normalization of the capture yield is determined by the nearly saturated resonance atEn=23.5 eV of thorium, with a peak transmission of about 0.3%. At this resonance energy,the macroscopic total cross section is large enough(nσt≫1)to ensure that all incident neutrons can interact with the sample so that the neutron transmission can be negligible. And the neutron width is much smaller than the capture width (Γn≪Γγ), which ensures that all the incident neutrons in the vicinity of this resonance energy get captured by the sample. Therefore,the neutron capture yield(including the neutron multiple scattering effect)at the resonance energy is close to unity. To evaluate the systematic uncertainty of the normalization,the experimental data should be fitted using different resonance parameters based on a rigorous theoretical analysis.[7,8]However,in the present work,a systematic uncertainty of about 1%is given for the self-normalization by simply comparing different normalization cofficients obtained by the experimental yield and theoretical yield at the resonance top.[34]This uncertainty is also correlated to the accuracy of the shape of the neutron flux,which will be discussed in detail in the following section.
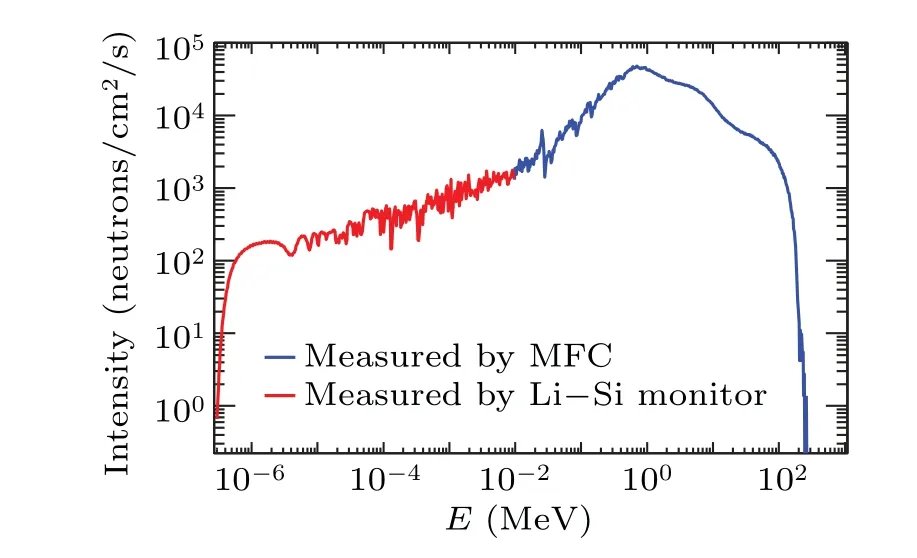
Fig. 6. Source neutron spectrum measured by Li–Si monitor detector (red line)and by 235U/238U multi-layer fission ionization chamber(blue line).
4. Results and disscussion
4.1. Determination of the(n,γ)cross section
The capture yieldY(En)in a capture experiment is related to the capture cross sectionσcand the total cross sectionσtvia the following formula:
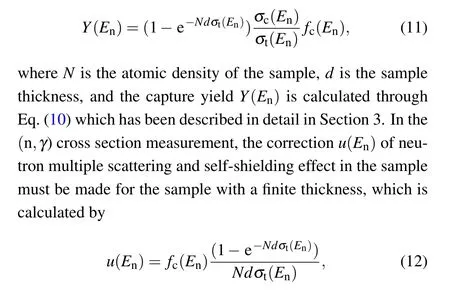
wherefc(En)is the energy-dependent factor for multiple scattering correction, and the term in the parenthesis of the right side of Eq. (12) accounts for the self-shielding effect. As it is difficult to deduct the contribution of these two effects through experiment, the correction is generally obtained by Monte–Carlo simulations[35]or analytical approaches.[36]In this work,we used again the Geant4 code to calculate the multiple scattering correctionfc(En). Combined with the calculation of Eq. (12), the result of the correction factoru(En) was obtained and it ranges from about 1.036 to 1.067 for the232Th sample from 4 keV to 100 keV.Then,the average capture cross section〈σc(En)〉of232Th was derived from the corrected average capture yield〈Y(En)〉via

4.2. Discussion of results and uncertainties
The results of this work and several experimental data from the previous measurements are plotted in Fig.7,accompanying with the evaluated data from the Evaluated Nuclear Data File Version B-VIII.0(ENDF/B-VIII.0),[37]as well as the Chinese Evaluated Nuclear Data Library(CENDL-3.1).[38]
In addition,the232Th(n,γ)reaction cross-sections in the unresolved resonance region from 4 keV to 100 keV were also theoretically studied by using the computer code TALYS-1.95[13]with default parameters. TALYS is an open source software package for prediction and analysis of nuclear reactions. It can calculate the nuclear reactions that involve neutrons, photons, protons, deuterons, tritons,3He- and alphaparticles, in the 1 keV–200 MeV energy range for target nuclides of mass 12 and heavier.[13]The calculation of TALYS is not used as a fitting of the measured result in this work,but as a prediction for nuclear reactions and neutron nuclear cross section in the URR. In this work, all possible exit reaction channels and all associated cross sections of n+232Th reaction at different neutron energies were taken into account and the cross section of the232Th(n,γ)reaction was extracted and analyzed. The results of theoretically calculated excitation function are also shown in Fig. 7. All the cross section data are included in the SM and the datasets are openly available at http://dx.doi.org/10.11922/sciencedb.j00113.00015.

Fig. 7. Comparison of the present experimental data, several existing data from EXFOR, the evaluated data from ENDF/B-VIII.0 and CENDL-3.1,and the theoretical calculation data from TALYS.In order to keep the figure readable,the uncertainties for the existing experimental data are omitted.
As presented in Fig. 7, it can be seen that the trend of the present measurement data is consistent with the theoretical calculation results from TALYS and the evaluated data of ENDF/B VIII.0[37]and CENDL-3.1[38]in the URR from 4 keV to 100 keV.The theoretical cross sections calculated by TALYS using the default parameters are slightly lower than the evaluated data. Although the neuton energy region at Backn is expanded to tens of MeV, the results here are limited to about 100 keV because the system uncertainties increase significantly at higher energy. Compared with the data measured by Aertset al.[5]at n TOF and by Broellaet al.[8]at GELINA,the present measured data shows a greater deviation and fluctuation with the evaluated data. The structures of the neutron spectrum cannot be excluded as an important contribution to the fluctuation since these are greater than those in the thorium data. The similar fluctuations also exist in the measurements of other samples.[23,24]Another important reason for the discrepancy between our data and the existing data is the different normalization procedures. In the present measurement,the capture yield is normalized by a saturated resonance at the low neutron energy so that the structure of the energy spectrum at around this energy will inevitably disturb the accuracy of normalization. It is worth considering a new specialized measurement of the source neutron spectrum to offer more accurate data in the future. However,it is hard for us at present to evaluate the systematic uncertainty of normalization which is combined with the shape of the neutron flux.In addition,the new capture experiments of other isotopes recently performed at Back-n have indicated that the in-beamγbackground resulted from the neutron captures on hydrogen in the spallation target assembly may lead to the discrepancy of experimental cross section, which is worth exploring in our newly planned measurement.
The uncertainty of the present measurement originates from several components,including the statistical and systematic uncertainties.The statistical uncertainties are evaluated by the formula ofN-0.5forNevents in an energy bin. Thanks to the high neutron flux and the adequate measurement time provided by Back-n, the statistical uncertainties in the URR are less than 1%. The contributions of systematic uncertainties can be inferred from the experimental data analysis procedure and have been described in Section 3. These components are listed in Table 2. It can be concluded that the systematic uncertainty related to the energy dependence of the neutron flux plays a dominant role in the URR.The total uncertainties are shown in Fig.7 in the form of error bars on the measured cross sections.

Table 2. System uncertainties in the measured capture cross section.
4.3. Average parameters
In the unresolved resonance region, the cross section is parameterized by the statistical models. Fictitious resonances are generated to characterize the average cross section,which is a substantially different way to describe the cross section in the RRR,with a set of individual resonance parameters for each resonance peak. The fictitious resonances described by the average parameters enable the calculation of cross section,which are essential for the neutron transport calculations of reactors. Hence, it is crucial to extract and analyze the average parameters from the measured cross section.
In the URR,the average cross section〈σcc′〉for a neutroninduced reaction from the entrance channelcto the exit channelc′can be expressed as

whereUcc′ are the average collision matrixes and they are related toRmatrix through some intermediate parameters. The main parameters for the determination of capture cross section in URR include the mean level spacingDl, the neutron strength functionSl,the average radiation width〈Γγ〉l,and the effective scattering radiusR′. The subscriptlis the orbital angular momentum of the incident channel.
The code FITACS, which has been integrated into SAMMY-M5,[36]was used to fit the capture cross section based on the Hauser–Feshbach theory with width fluctuations.In this code, the energy dependence of the radiation widths is specified via the giant dipole model, and of the mean level spacing for s-waves via the Gilbert–Cameron composite formula. The mean spacings forl >0 are given via the Bethe formula and Moldauer prescription is used for partial cross sections.[36]Generally, a simultaneous fit including the data sets of different types of reaction cross sections is recommend to determine the average resonance parameters. In this work, we used only the present capture data. In order to obtain realistic results, the initial values of the varied parameters should not diverge outside of the constraints of the theory.The starting values of neutron strength functions for s-wave(S0=0.87×10⁻⁴)and p-wave(S1=1.90×10⁻⁴)are taken from the literature,[39]and that for d-wave(S2=0.89×10⁻⁴)is adopted from the literature.[5]The average radiation width〈Γγ〉lforl=0–2 and the mean level spacing forl=0(D0=17.2 eV) are also obtained from the literature.[5]In addition,the distant-level parameterR∞is obtained viaR∞=1-R′/a,whereR′is the effective scattering radius andarepresents the channel radius with the units of Fermi. For the effective scattering radius,we obtain valueR′=9.65 fm from the Atlas of Neutron Resonance.[40]And the channel radiusais calculated througha=1.23([A/mn]1/3+0.8). Finally,the related initial value of s-wave distant-level parameterR∞is-0.13.
Other fixed input parameters such as the neutron binding energy, the pairing energy, the center-of-mass excitation energy, spin, and parity for different target levels are adopted from the Evaluated Nuclear Structure Data File (ENSDF) of the National Nuclear Data Center(NNDC).The final fitted results are shown in Fig. 8. The strength functions for s-wave and p-wave resonances are both fixed during the fitting. The fitting parameter results areS2=1.15×10⁻⁴,〈Γγ〉0=〈Γγ〉2=23.9 meV,and〈Γγ〉1=25.8 meV.
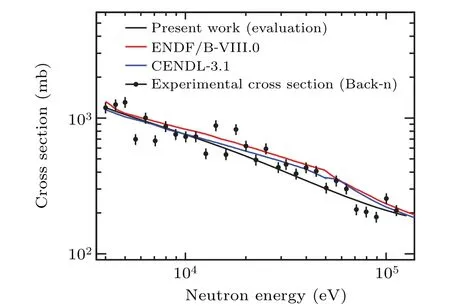
Fig.8. Experimental cross section and the result of evaluation.
5. Conclusion
The232Th neutron capture reaction cross section has been measured at the Back-n facility of CSNS using the C6D6liquid scintillation detectors for the first time. A detailed description of the data analysis procedure and the system uncertainty evaluation was given. The232Th(n,γ)cross section data in the unresolved resonance region from 4 keV to 100 keV were compared with the code TALYS, several existing data from previous measurements, the data from ENDF/B-VIII.0 and CENDL-3.1 evaluation database and were found in consensus. The average parameters in the unresolved resonance region were also obtained by using the code FITACS to fit the experimental cross section and that generated via the theory.The present measurement could offer an important reference for the experimental design of neutron capture cross section measurement at the Back-n facility. Further measurements will be prepared to mitigate the fluctuation and improve the accuracy of experimental cross section.
Data availability
The data that support the findings of this study are openly available in Science Data Bank at http://dx.doi.org/10.11922/sciencedb.j00113.00015.
Acknowledgements
The authors would like to thank the Back-n collaboration for discussions.
Project supported by the Chinese TMSR Strategic Pioneer Science and Technology Project (Grant No. XDA02010000) and the National Natural Science Foundation of China(Grant No.11790321).
- Chinese Physics B的其它文章
- Ergodic stationary distribution of a stochastic rumor propagation model with general incidence function
- Most probable transition paths in eutrophicated lake ecosystem under Gaussian white noise and periodic force
- Local sum uncertainty relations for angular momentum operators of bipartite permutation symmetric systems
- Quantum algorithm for neighborhood preserving embedding
- Vortex chains induced by anisotropic spin–orbit coupling and magnetic field in spin-2 Bose–Einstein condensates
- Short-wave infrared continuous-variable quantum key distribution over satellite-to-submarine channels