Research of Surface Coating Influence on Loose Life of Bolt
ZHANG Yu
(CRRC Nanjing Puzhen Co., Ltd., Nanjing 210031, China)
Abstract:The rust-proof ability relate to the reliability of bolt connection, and the painting is the most simple and effective rust-proof method in industry. Because of lacking general standard, there are different coating thicknesses painted on the surface of workpieces, which influences the loose life of connecting bolt. For the longer loose life, Three kinds of applied coatings (primer coating, primer+top-coat coating, primer+intermediate-coat+top-coat coating) in industry are tested in the experiment, and the best coating is found. All the conclusions gotten by analyzing the testing phenomenon of every coating shown in experiment, have profound meaning for practical industry application.
Keywords: coating; bolt connection; experiment; loose life
1 Introduction
Anti-corrosion is a very important process for the bolted connection structure. Whether the anti-rust process meets the standard determines the service life of the bolted connection. In practice, the painting of bolt connections is generally divided into two type: 1) Paint first, then assemble, 2) Assemble first, then paint[1]. Especially in the process of ″paint first, then assemble″, because the paint layer is sandwiched between the two clamped parts, it will affect the fastening life of the bolt after it is worn out due to the vibration. The current coating paints for rail cars generally include primers, middle paints and top paints. The number and combination of paint layers at different connection positions are also different. There is no uniformly determined guideline to explain the impact of the coating on the loosening life of bolt connections. Problems will inevitably occur in engineering practice.
Although bolts are small, the problems involved are very complicated[2-7]. Therefore, experts and scholars have conducted in-depth study on all aspects of the problems of bolt connections with coatings. Literature[8]combined the test method analyzes the performance of a certain inorganic zinc-rich coating. By analyzing the test data, it is concluded that the inorganic zinc-rich anti-rust and anti-skid coating can improve the anti-slip coefficient between the connected parts, which can guide the actual production. In the literature[9], the surface of the connected parts was painted with zinc and paint, and after the bolts were tightened, the anti-slip coefficient and the pre-tightening force were investigated and tested, and the influence of the bolt pre-tightening force on the clamped parts was analyzed. The influencing law of the anti-slip coefficient of, gives some relevant suggestions on the design of the anti-slip coefficient of coated bolt connections. Literature[10]studied the anti-slip coefficient of bolt connection containing iron red alkyd and polyurethane zinc-rich paint coating with the help of experimental methods. Analyzing various factors that can affect the anti-slip coefficient, combined with the test data, the analysis gives the recommended value of the anti-slip coefficient of the bolt connection of the two kinds of coating connectors: iron alkyd and polyurethane zinc-rich paint. Literature[11]used inorganic zinc-rich paint film thickness and time change as parameters to conduct an experimental study on the anti-slip coefficient of high-strength bolts and the relaxation of the pretension force. Finally, combined with the experimental data, the bolts have The carrying capacity was evaluated. Experts and scholars have conducted extensive research on this issue, but they have not clearly pointed out the influence of different thickness coatings on the loosening life of bolt connections. Therefore, it is very important to study and clarify the influence of different thickness coating combinations on bolt fastening life is og great Engineering Guiding significance.
2 Bolt fastening law
The method of tightening the bolt is usually to use the correct tool to tighten the nut. The nut is regarded as a free body, then the applied torque on the nut isMk. The force couple is formed by the following three types:
1) The component force of the friction between the threads in the tangent direction of the normal sectionM1;
2) A force couple formed by the component force of the normal force between threads in the tangent direction of the normal sectionM2;
3) The force couple formed by the friction force between the washer and the nut bearing surfaceM3. And the three parts are balanced[12].

(1)

(2)

(3)
Where:Pis the preload;fis the anti-slip coefficient between threads;f1is the anti-slip coefficient;αis the thread inclination angle;βis the thread half angle;dis the nominal diameter of bolt;d1is the thread pitch;Dis the diameter of the inscribed corner of the nut bearing surface.
Applied torqueMkis
Mk=M1+M2+M3
(4)
Then, we can get
(5)
The torque coefficient is calculated in the following.

(6)
Then, applied torqueMkis written as
Mk=KdP
(7)
According to the fourth strength theory[13], the strength condition is as following.
8.8 level:

(8)
10.9 level:

(9)

Due to the manufacturing error and the nature of the bolt itself, the pre-tightening force after the bolt cannot reach the theoretical calculation value, so the converted stress coefficient is 1.2, the stress relaxation coefficient of the bolt is 0.9, and the influence coefficient of the deviation factor is 0.9[14]. The design pre-tightening of high-strength boltsPis
8.8 level:

(10)
10.9 level:

(11)
In order to be consistent with the international bolt pre-tightening force level, China increased the pre-tightening force of 8.8-grade high-strength bolts by equation (10) by 10% in the calculation process to make the design pre-tightening force of 8.8 and 10.9 high-strength bolts. They are all controlled at 60% of their tensile strength[14].
3 High-strength bolt vibration test
3.1Test materials, equipment and installation
The bolts used in this test are M10×50 8.8 high-strength bolts and nuts, shown in Figure 1.
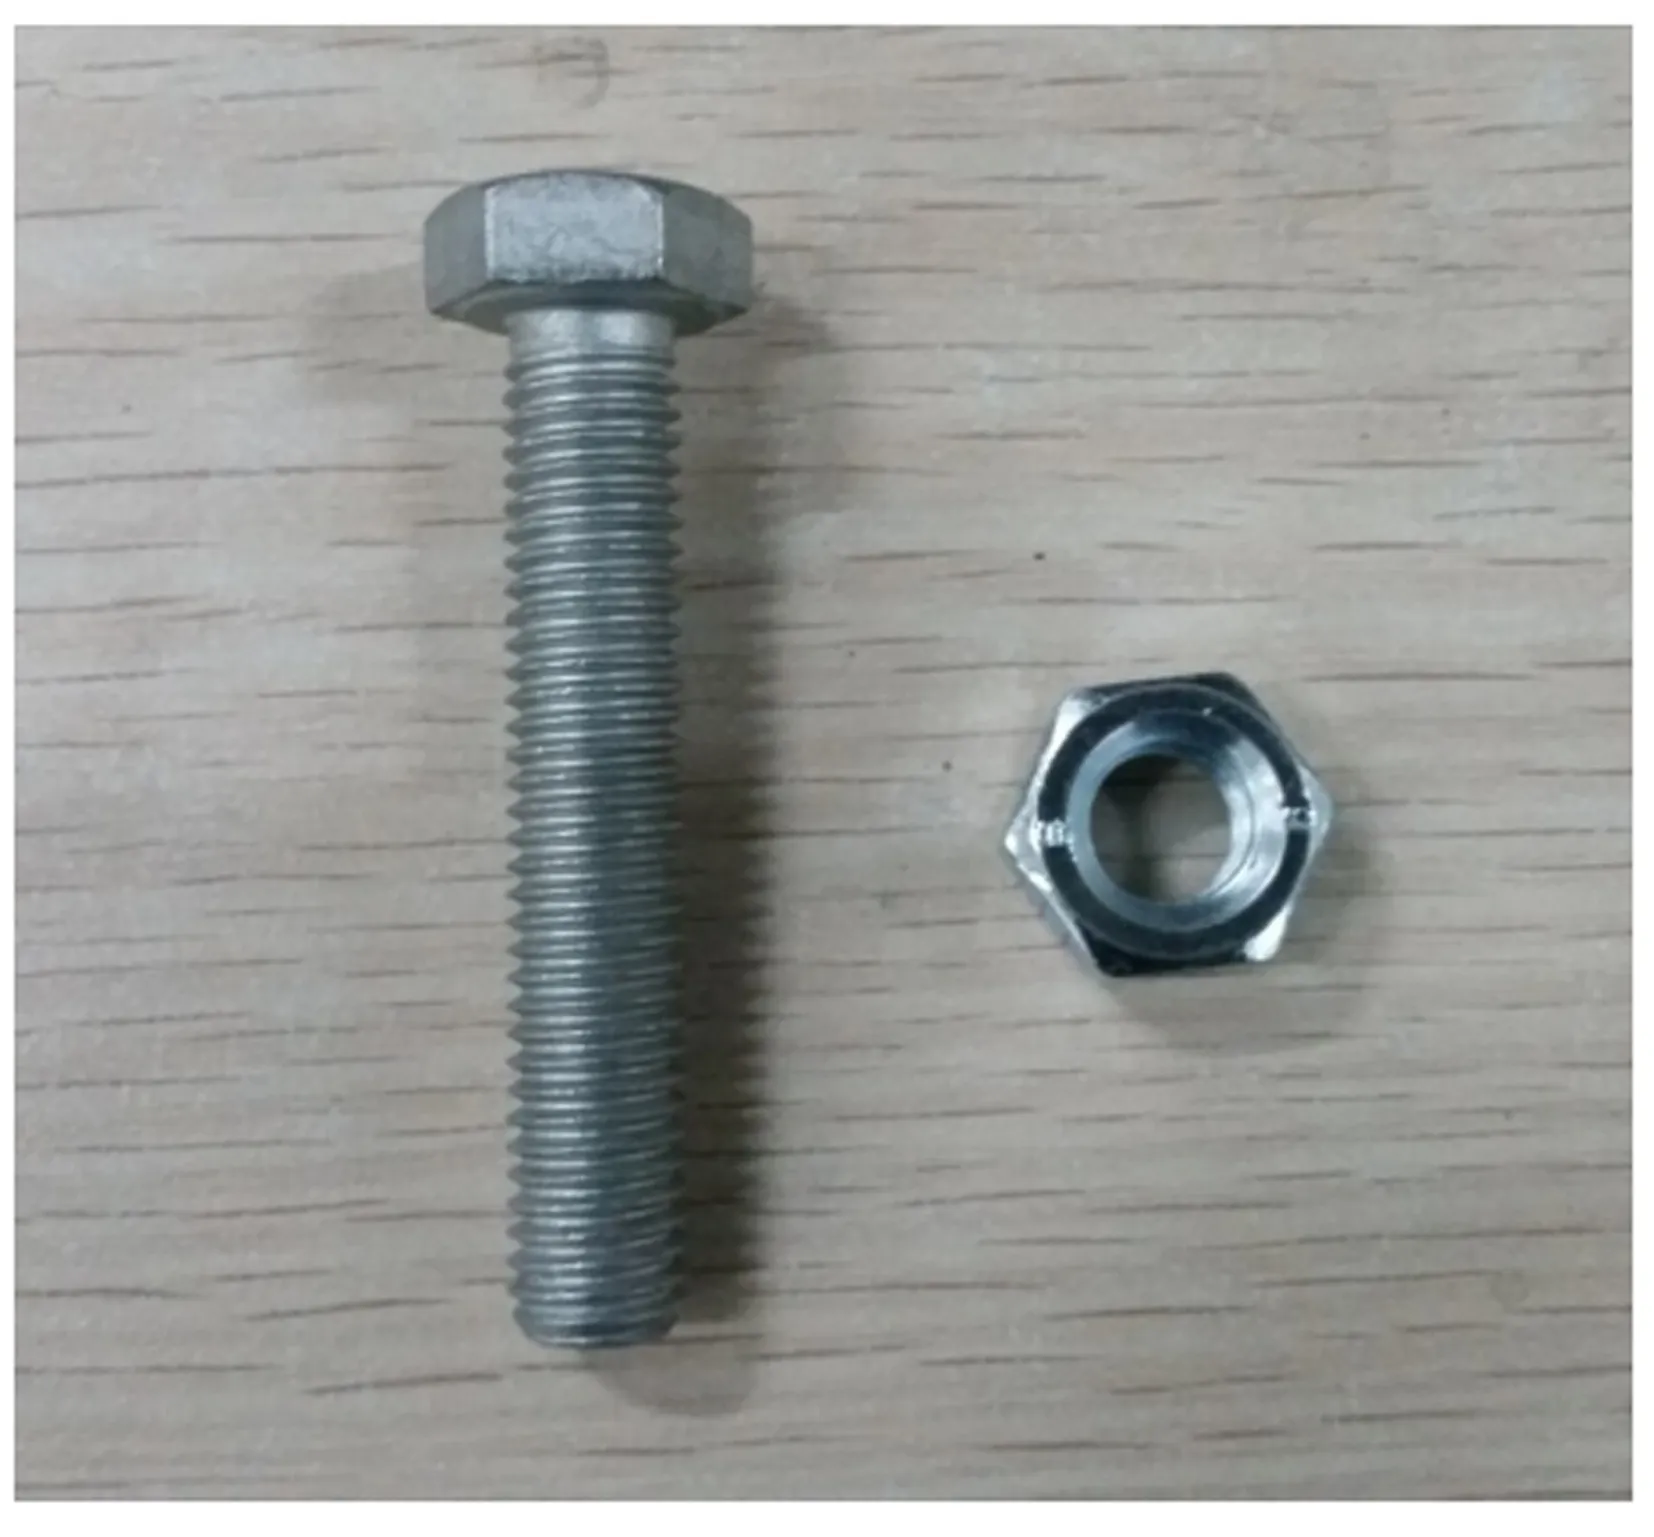
Figure 1 Bolts for test
Inquiry about relevant standards, the M10 bolt has a pitch of 1.5 mm[18]and an effective cross-sectional area of 58 mm2[19]. The bolts used in the test were tightened several times, and the test data were substituted into equation (7) to calculate the tightening coefficientK. It fluctuates between 0.15-0.2, and the median value is 0.175. The tensile strength of the 8.8-grade high-strength bolt is 800 MPa. Combining equations (7) and equation (10), the tightening torque of the bolt should be 48.3 Nm[20]. The test equipment adopts SHIMADZU electro-hydraulic servo fatigue testing machine, shown in Figure 2.

Figure 2 Test equipment
The tooling used in the test is designed as two separable parts (as shown in Figure 3), which are connected by bolts. There are test coatings on the surface of the tooling head. There are three types: 1) Primer coating-epoxy paint, with a thickness of 130±10 μm; 2) Primer+top coat coating-epoxy paint+polyurethane paint, the thickness is 210±20 μm; 3) Primer+intermediate coat+top coat coating-epoxy paint+polyurethane paint+polyurethane paint, the thickness is 280±20 μm.

Figure 3 Test fixture tooling
Install the tooling in the actuator of the test equipment, while placing the pressure sensor in the bolt connection, as shown in Figure 4.

Figure 4 Tooling installation
3.2Determination of test conditions
The relevant standard points out[15]that the amplitude in the free state is determined according to the actual frequency of use under the condition that the bolt is not sheared. During the test, the two clamps rub against each other under the drive of the actuator. Too fast loading frequency will cause the temperature of the test piece to be higher, causing the coating to melt and the sensor to damage. After many attempts, it is found that it is more appropriate to use a load with an amplitude of 0.2 mm and a loading frequency of 5 Hz.
3.3Standing test
After the bolts are tightened, let the tooling stand for 3 hours. The pre-tightening force curves of the three coatings in the static state are shown in Figures 5-Figure 7, and the test data are shown in Table 1.
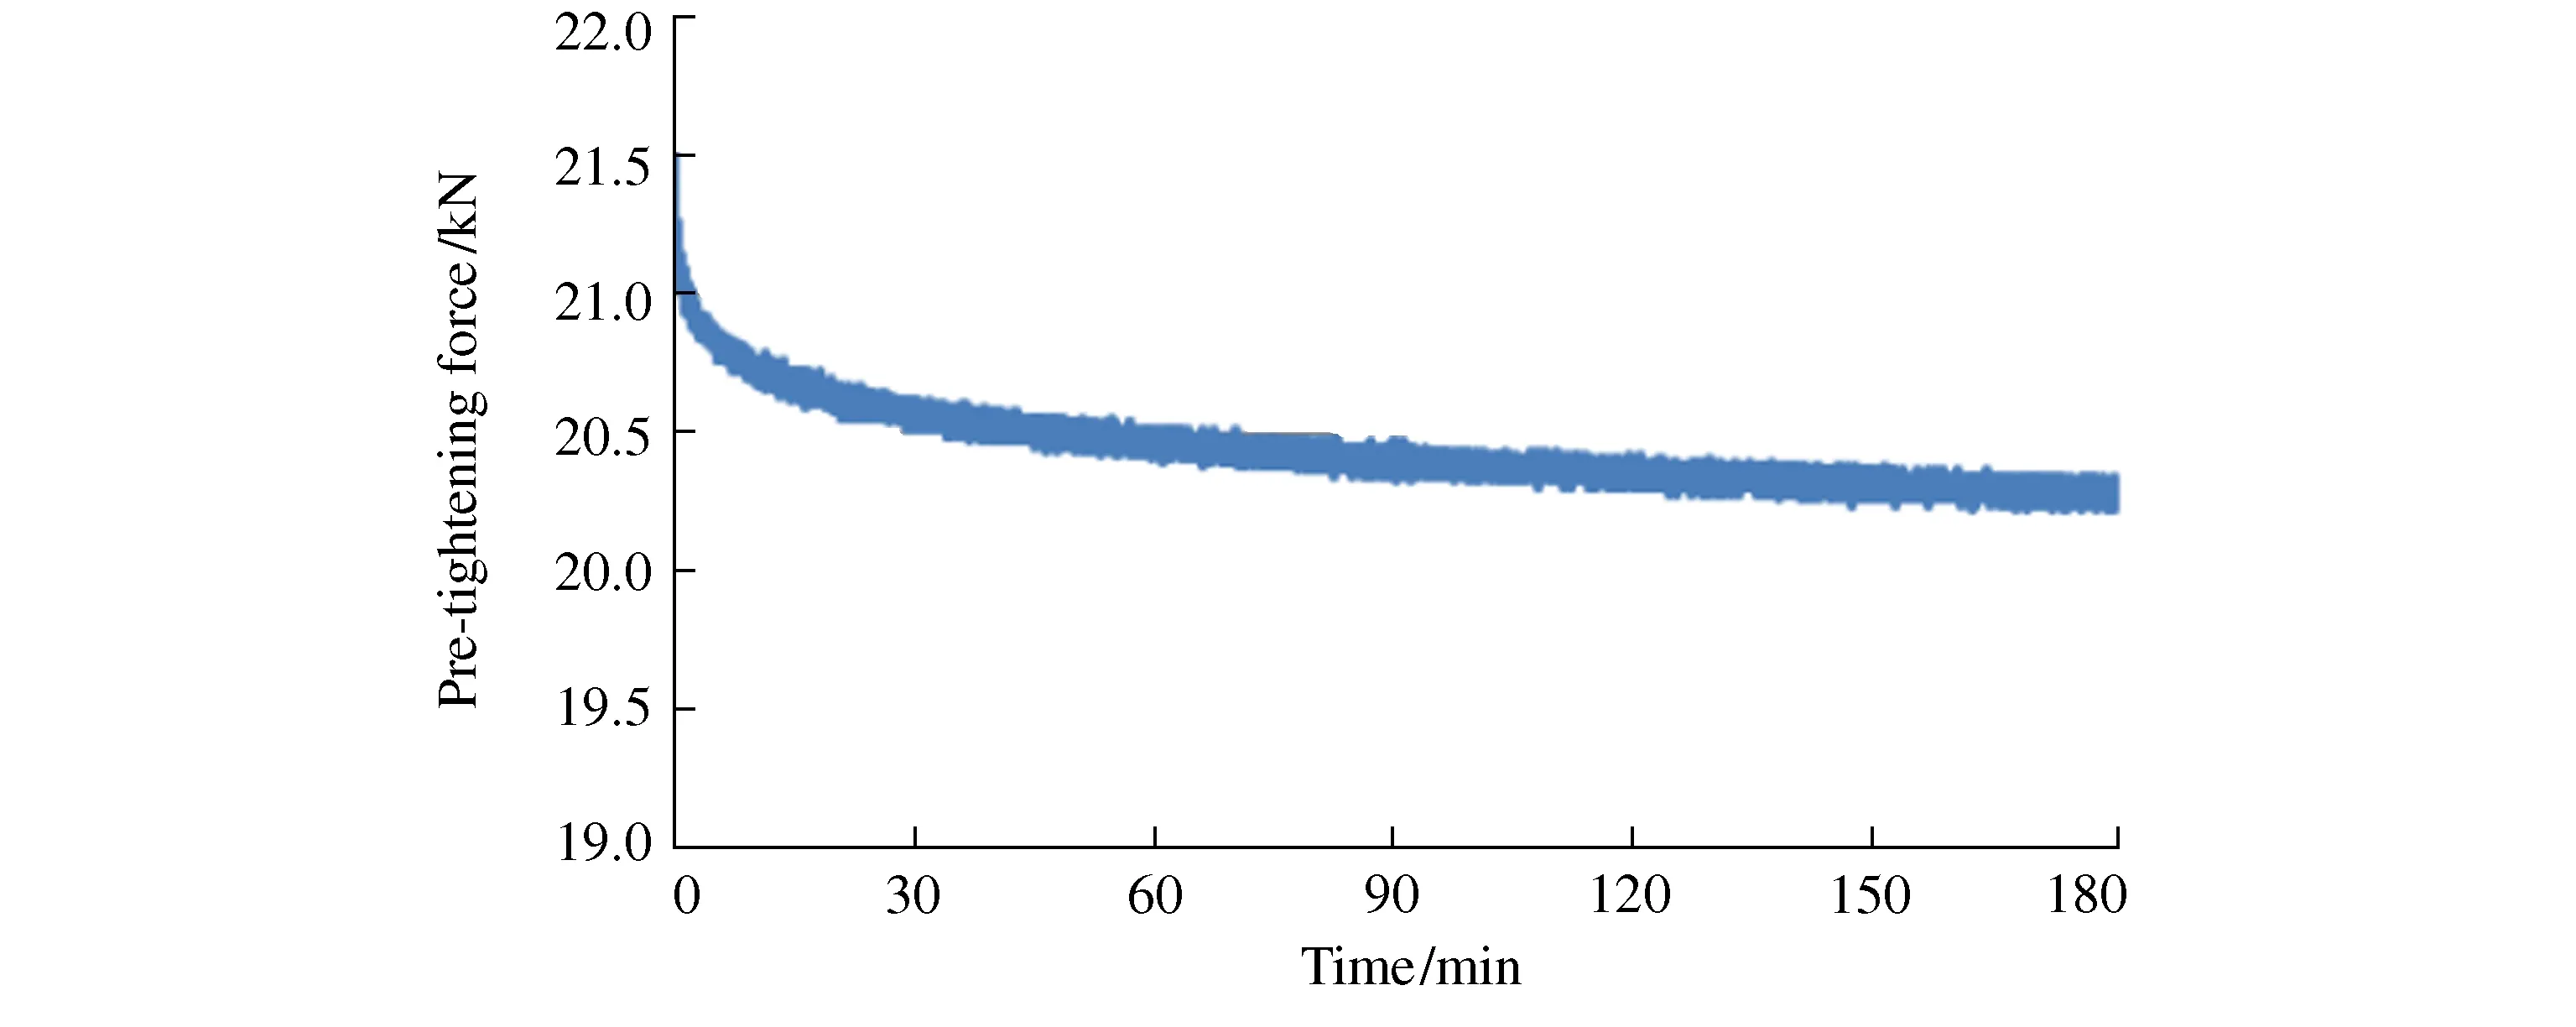
Figure 5 Test curve of pre-tightening force of primer coating in standing state
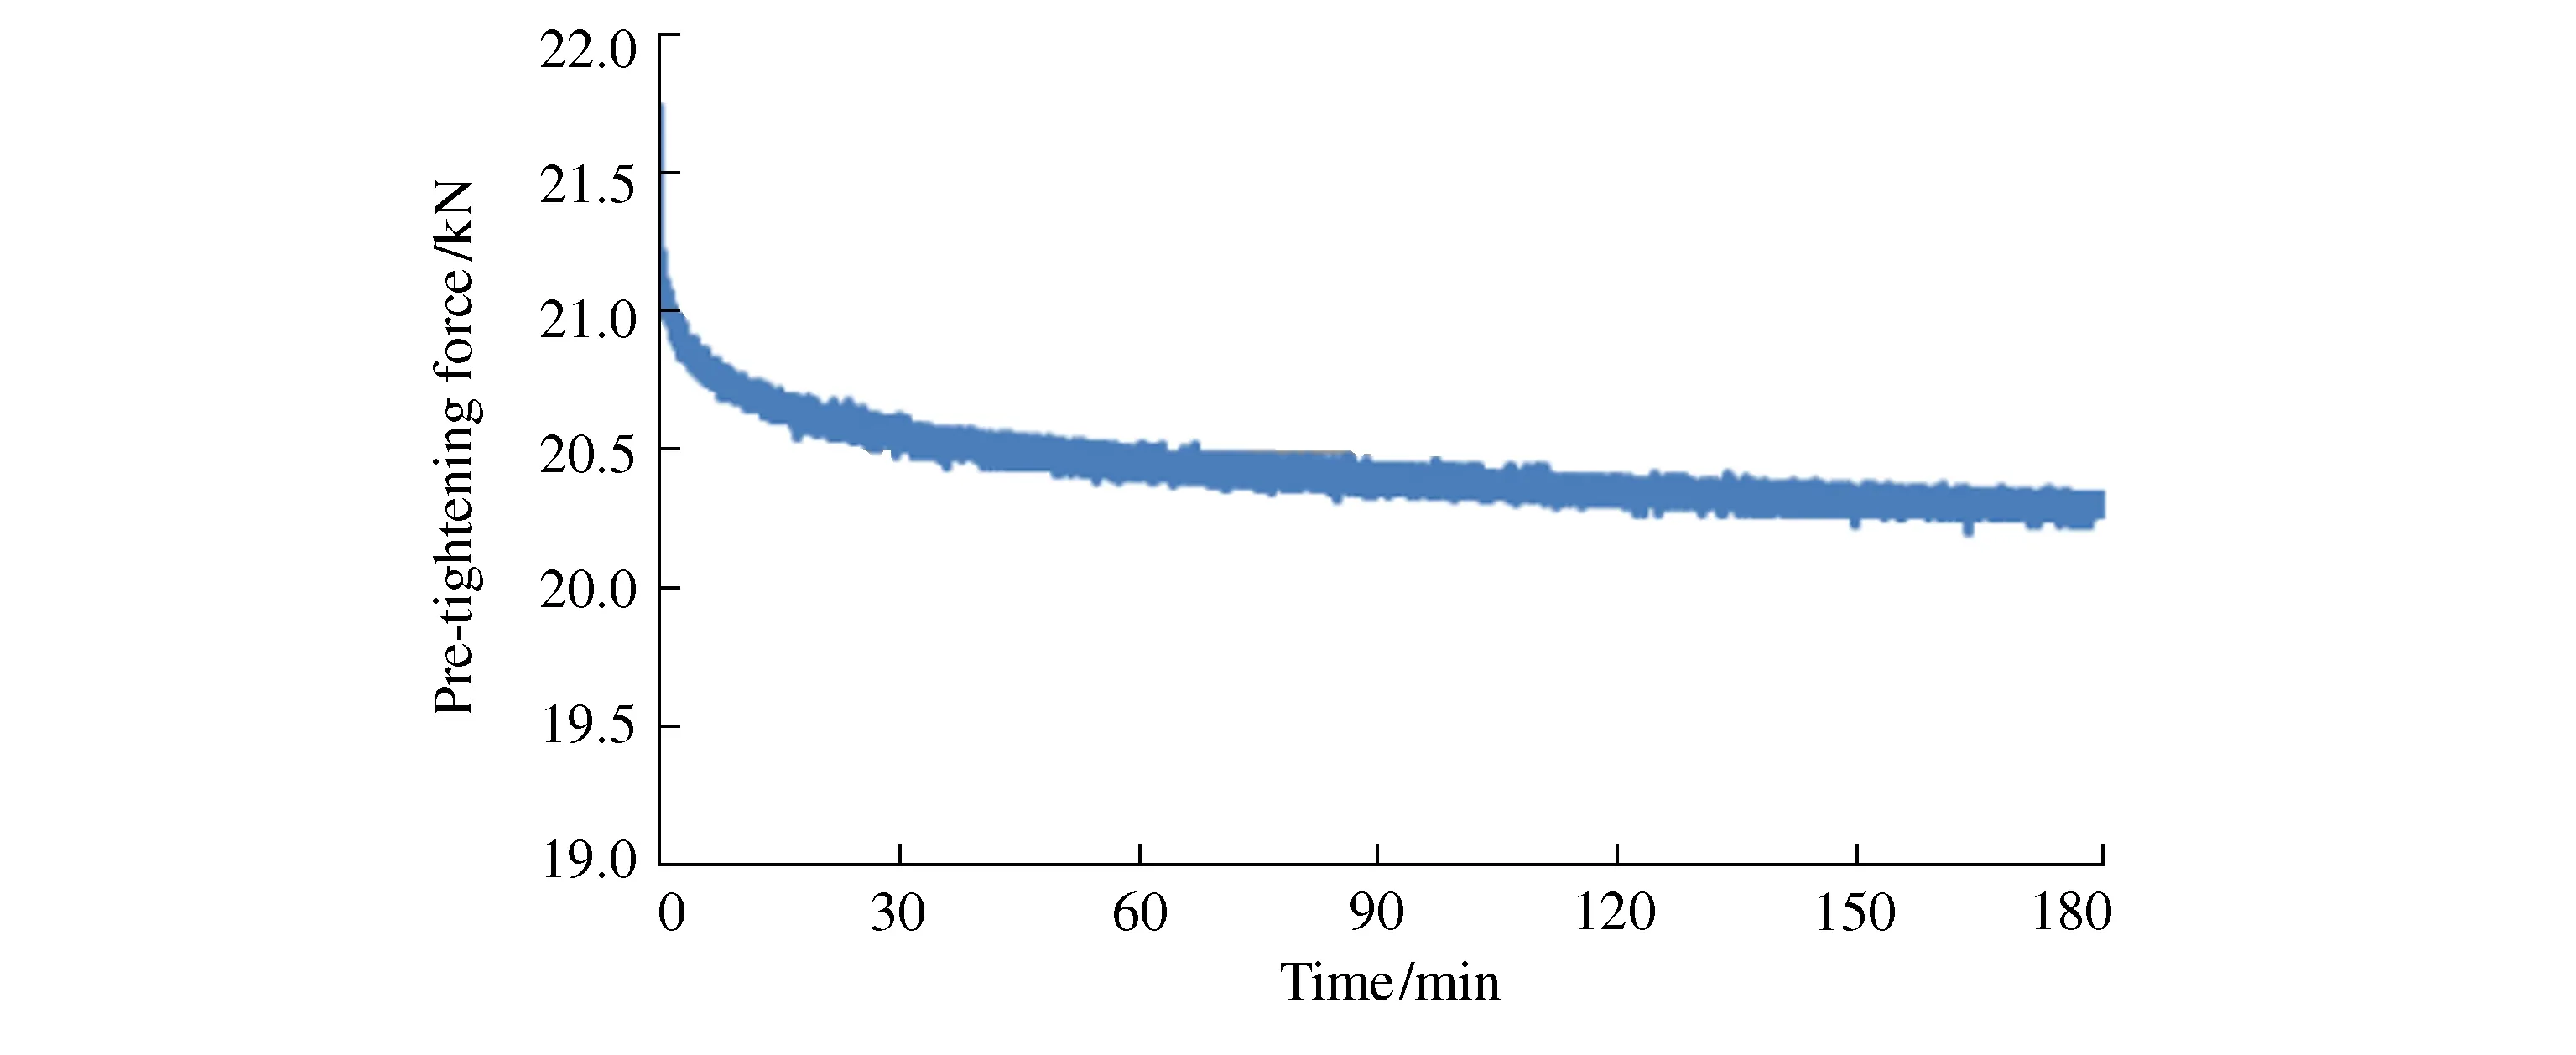
Figure 7 Pre-tightening force test curve of primer+intermediate coating+top coating coating in standing state
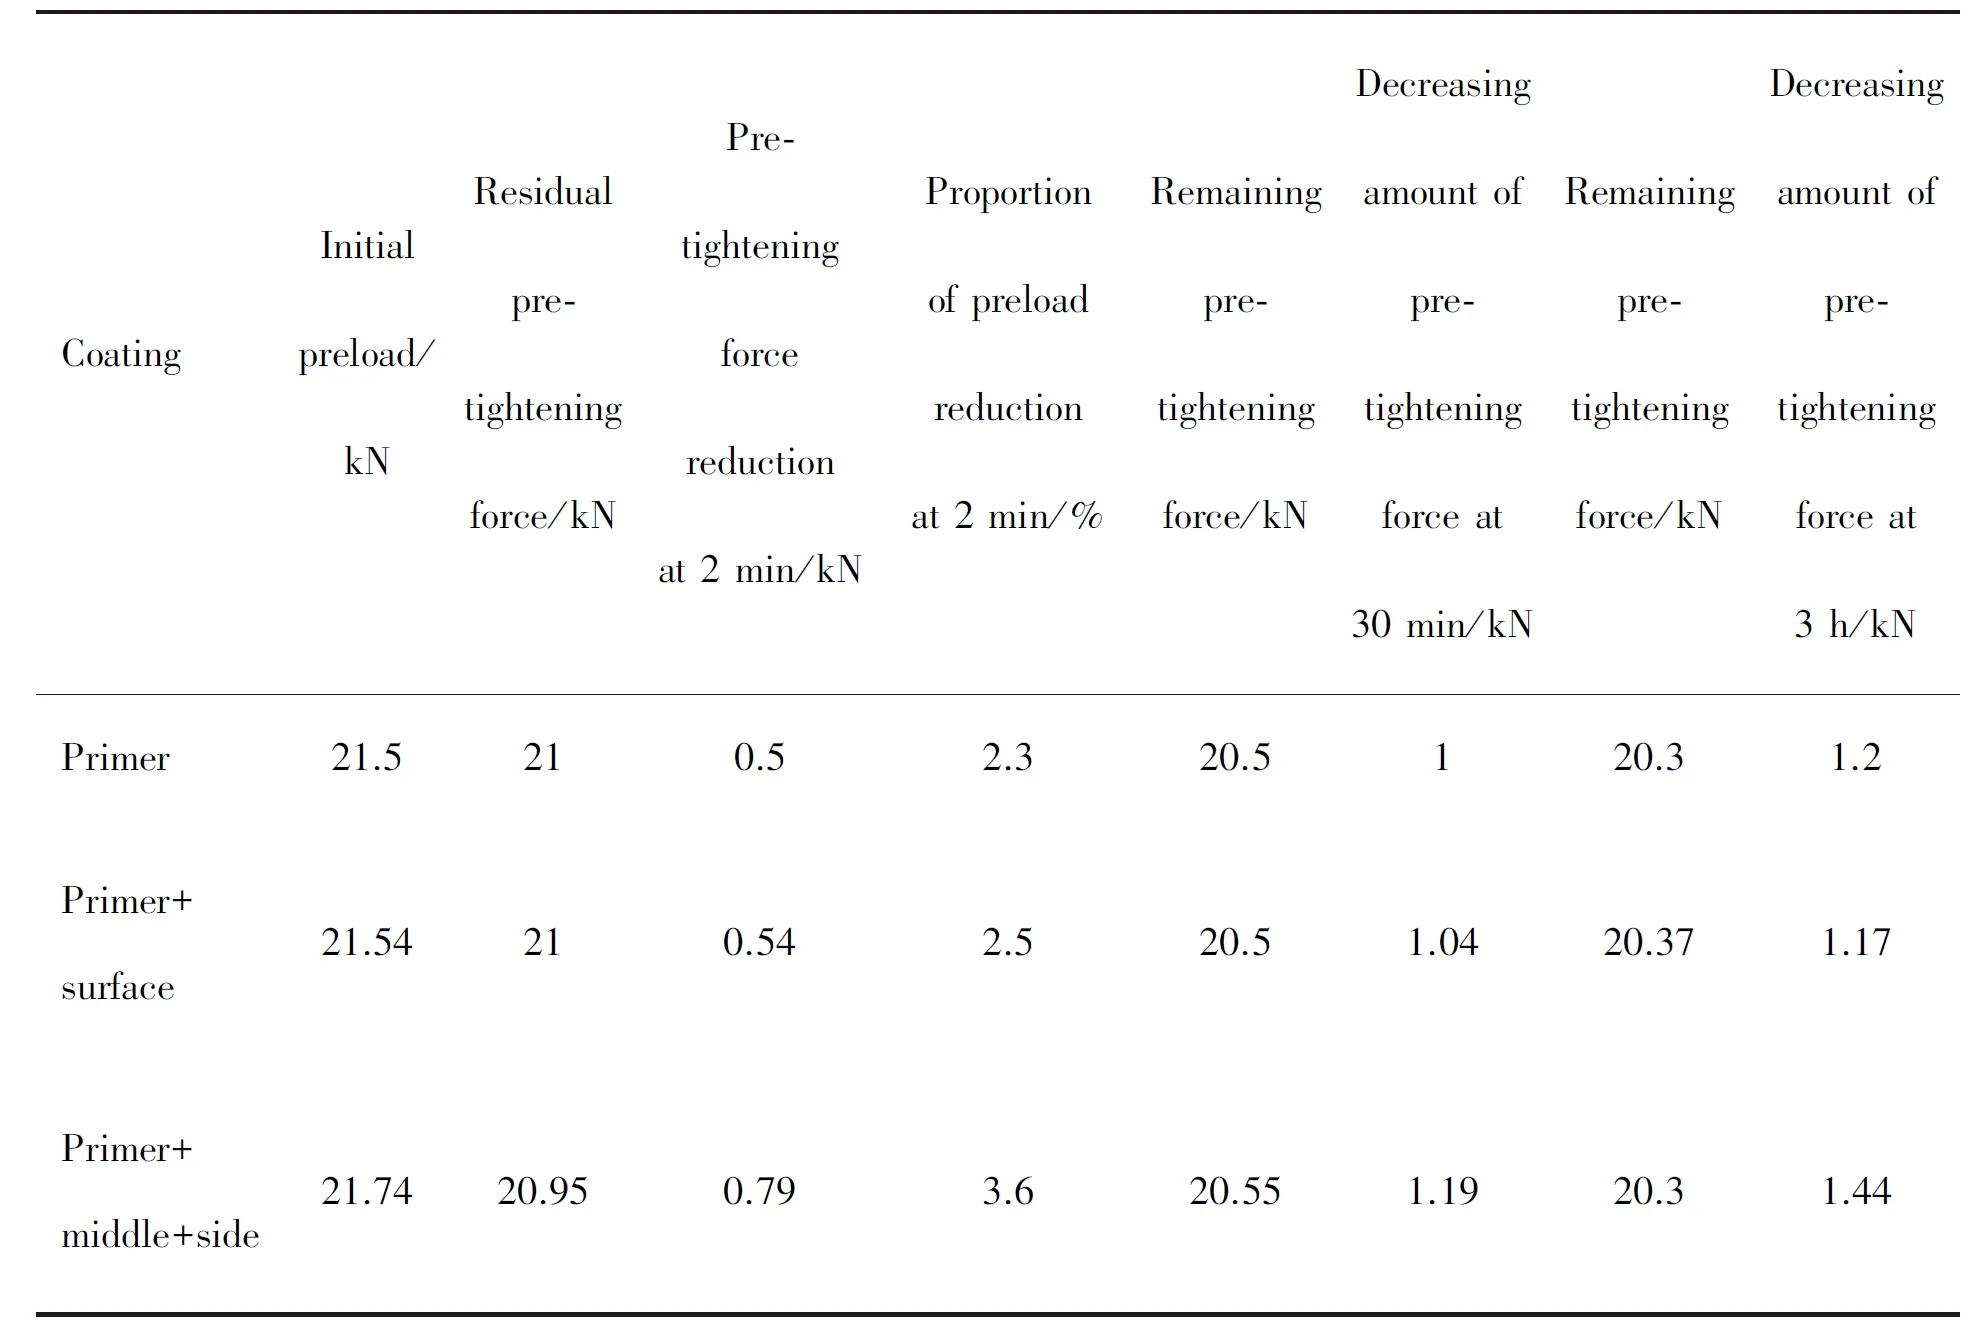
Table 1 Static test data
The data in Table 1 shows that after the three coatings are compressed by the bolts, the measured bolt pre-tightening trend is similar, and all of them are reduced, and the thicker the coating, the more obvious the pre-tightening force is reduced. The pre-tightening is 0-2 min. The force reduction is the fastest, the reduction of the pre-tightening force in 2-30 min is equivalent to the previous 2 minutes, and the reduction of the pre-tightening force in 30-180 min is less. The analysis reasons are as follows: 1) There will be a lot of roughness and ripples in the bolt thread during processing machining error, after being pre-tightened, there will be local rough collapse and corrugated plastic deformation, which will reduce the pre-tightening force[16]; 2) When the bolt is pre-tightened, it will undergo overall elastic deformation, and the threaded area will exceed the stress concentration. The yield limit will produce plastic deformation, which will cause the bolt to elongate, elastically relax, and the pre-tightening force is released[17]; 3) When the coating is compressed, plastic deformation will occur and part of its elasticity will be lost, resulting in a decrease in pre-tightening force. The reduction of the pre-tightening force caused by the three factors occurred in the whole process. From the test data, it can be seen that the degree of influence is first a short-term peak, and then tends to be flat. Assuming that the reason 1 and reason 2 of the bolt pre-tightening force drop under the three coatings are equal in each time period, from the 0-2 min test data, the thicker the coating, the influence on the pre-tightening force in the initial stage. The more obvious, that is, the greater the degree of compression of the coating. Therefore, the coating is too thick to maintain the initial pre-tightening force of the bolt connection.
3.4Vibration test
According to the above-mentioned standing test, after the bolt connection is pre-tightened and left standing for 30 minutes, the influence of the coating on the pre-tightening force is basically relatively small. Therefore, before the vibration test starts, all the test pieces are put to stand for 30 minutes.
3.4.1 Vibration test of primer coating tooling
First, perform the vibration test of the primer coating sample. During the vibration, it is found that powder coating wear debris is discharged from the test fixture (Figure 8). The pre-tightening force curve of the three sets of samples is shown in Figure 9.
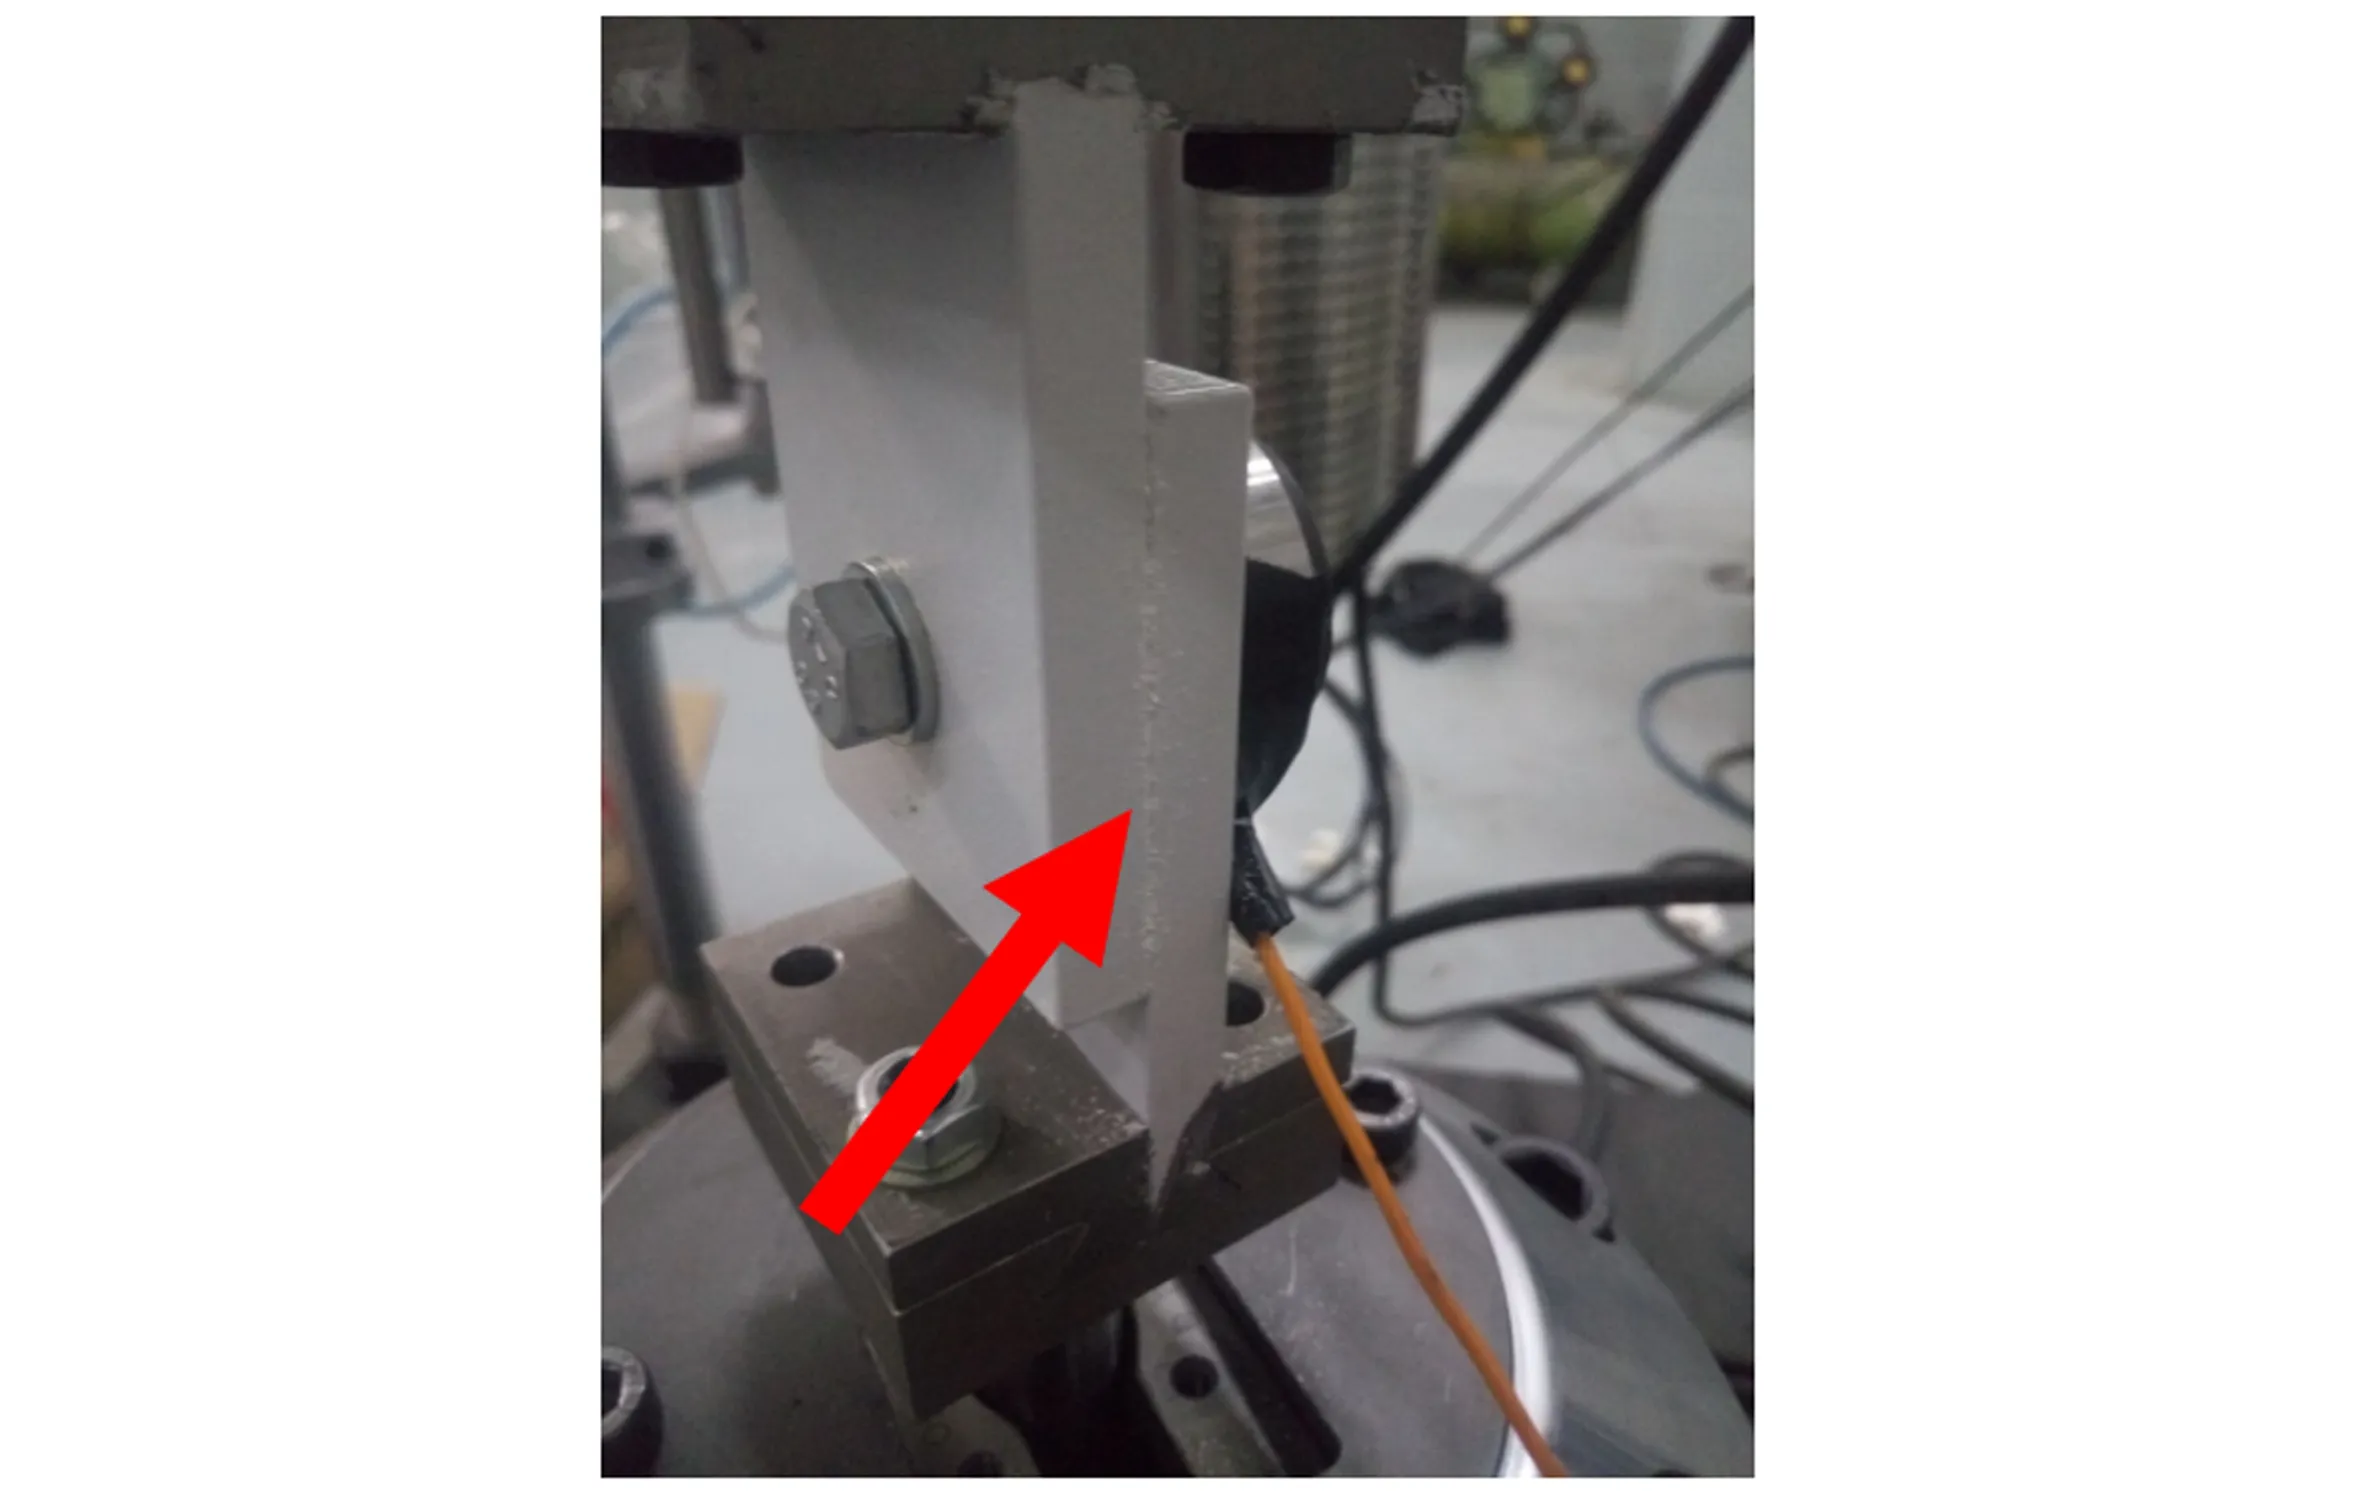
Figure 8 Powdered wear debris
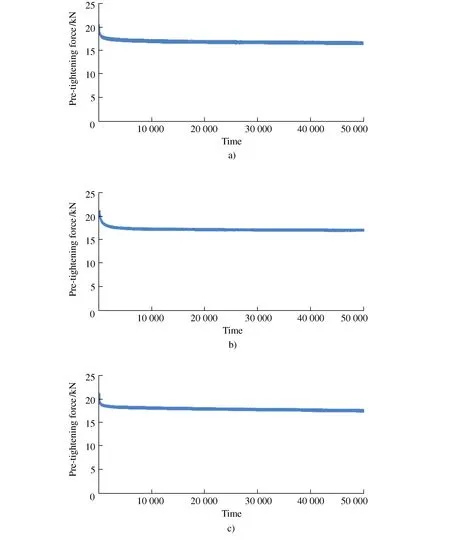
Figure 9 Test pre-tightening force curve of primer coating specimen
The three groups of samples were vibrated 50 000 times. The pre-tightening force of sample 1 was reduced from 20.63 kN to 16.34 kN, the pre-tightening force of sample 2 was reduced from 20.97 kN to 16.82 kN, and the pre-tightening force of sample 3 was reduced from 20.97 kN to 16.82 kN and 21 kN is reduced to 17.3 kN. It can be seen from the test curve that the measured pre-tightening force decreases rapidly at the beginning of the test, and then the downward trend is gentle. This is closely related to the wear of the coating. The reasons for the analysis are as follows: 1) The machining error (roughness, ripple, etc.) of the thread is vibrating It is further removed under the action, resulting in a decrease in the pre-tightening force. This effect is very obvious at the initial stage of the test; 2) The bolt continues to elongate under the action of vibration, resulting in a decrease in the pre-tightening force. This effect is more obvious in the initial stage of the test; 3) Looking at the coating state of the three groups of samples at the end of the test (Figure 10), the coating quickly wears out at the beginning of the vibration, and the pre-tightening force decreases significantly. When the coating is polished and the metal rubs against each other, the pre-tightening force decreases. Become gentle. The metal of the primer coating sample is exposed after the test, which indicates that the primer and the wear resistance are not high, which is not good for the rust prevention of the connected parts.

Figure 10 The surface state of the sample after the end of the test
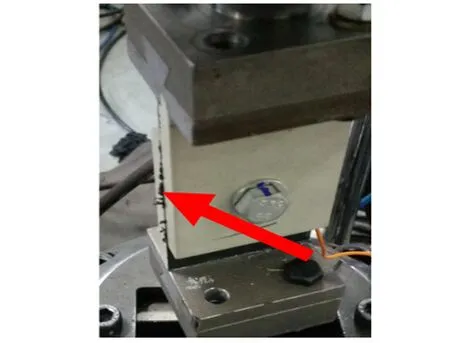
Figure 11 Flaky wear debris
3.4.2 Vibration test of primer+topcoat coating tooling
A vibration test was carried out on the primer+topcoat coating specimens. During the test, it was found that flake coating wear debris was discharged from the tooling cracks (Figure 11). The pre-tightening force curve of the three sets of samples is shown in Figure 12.
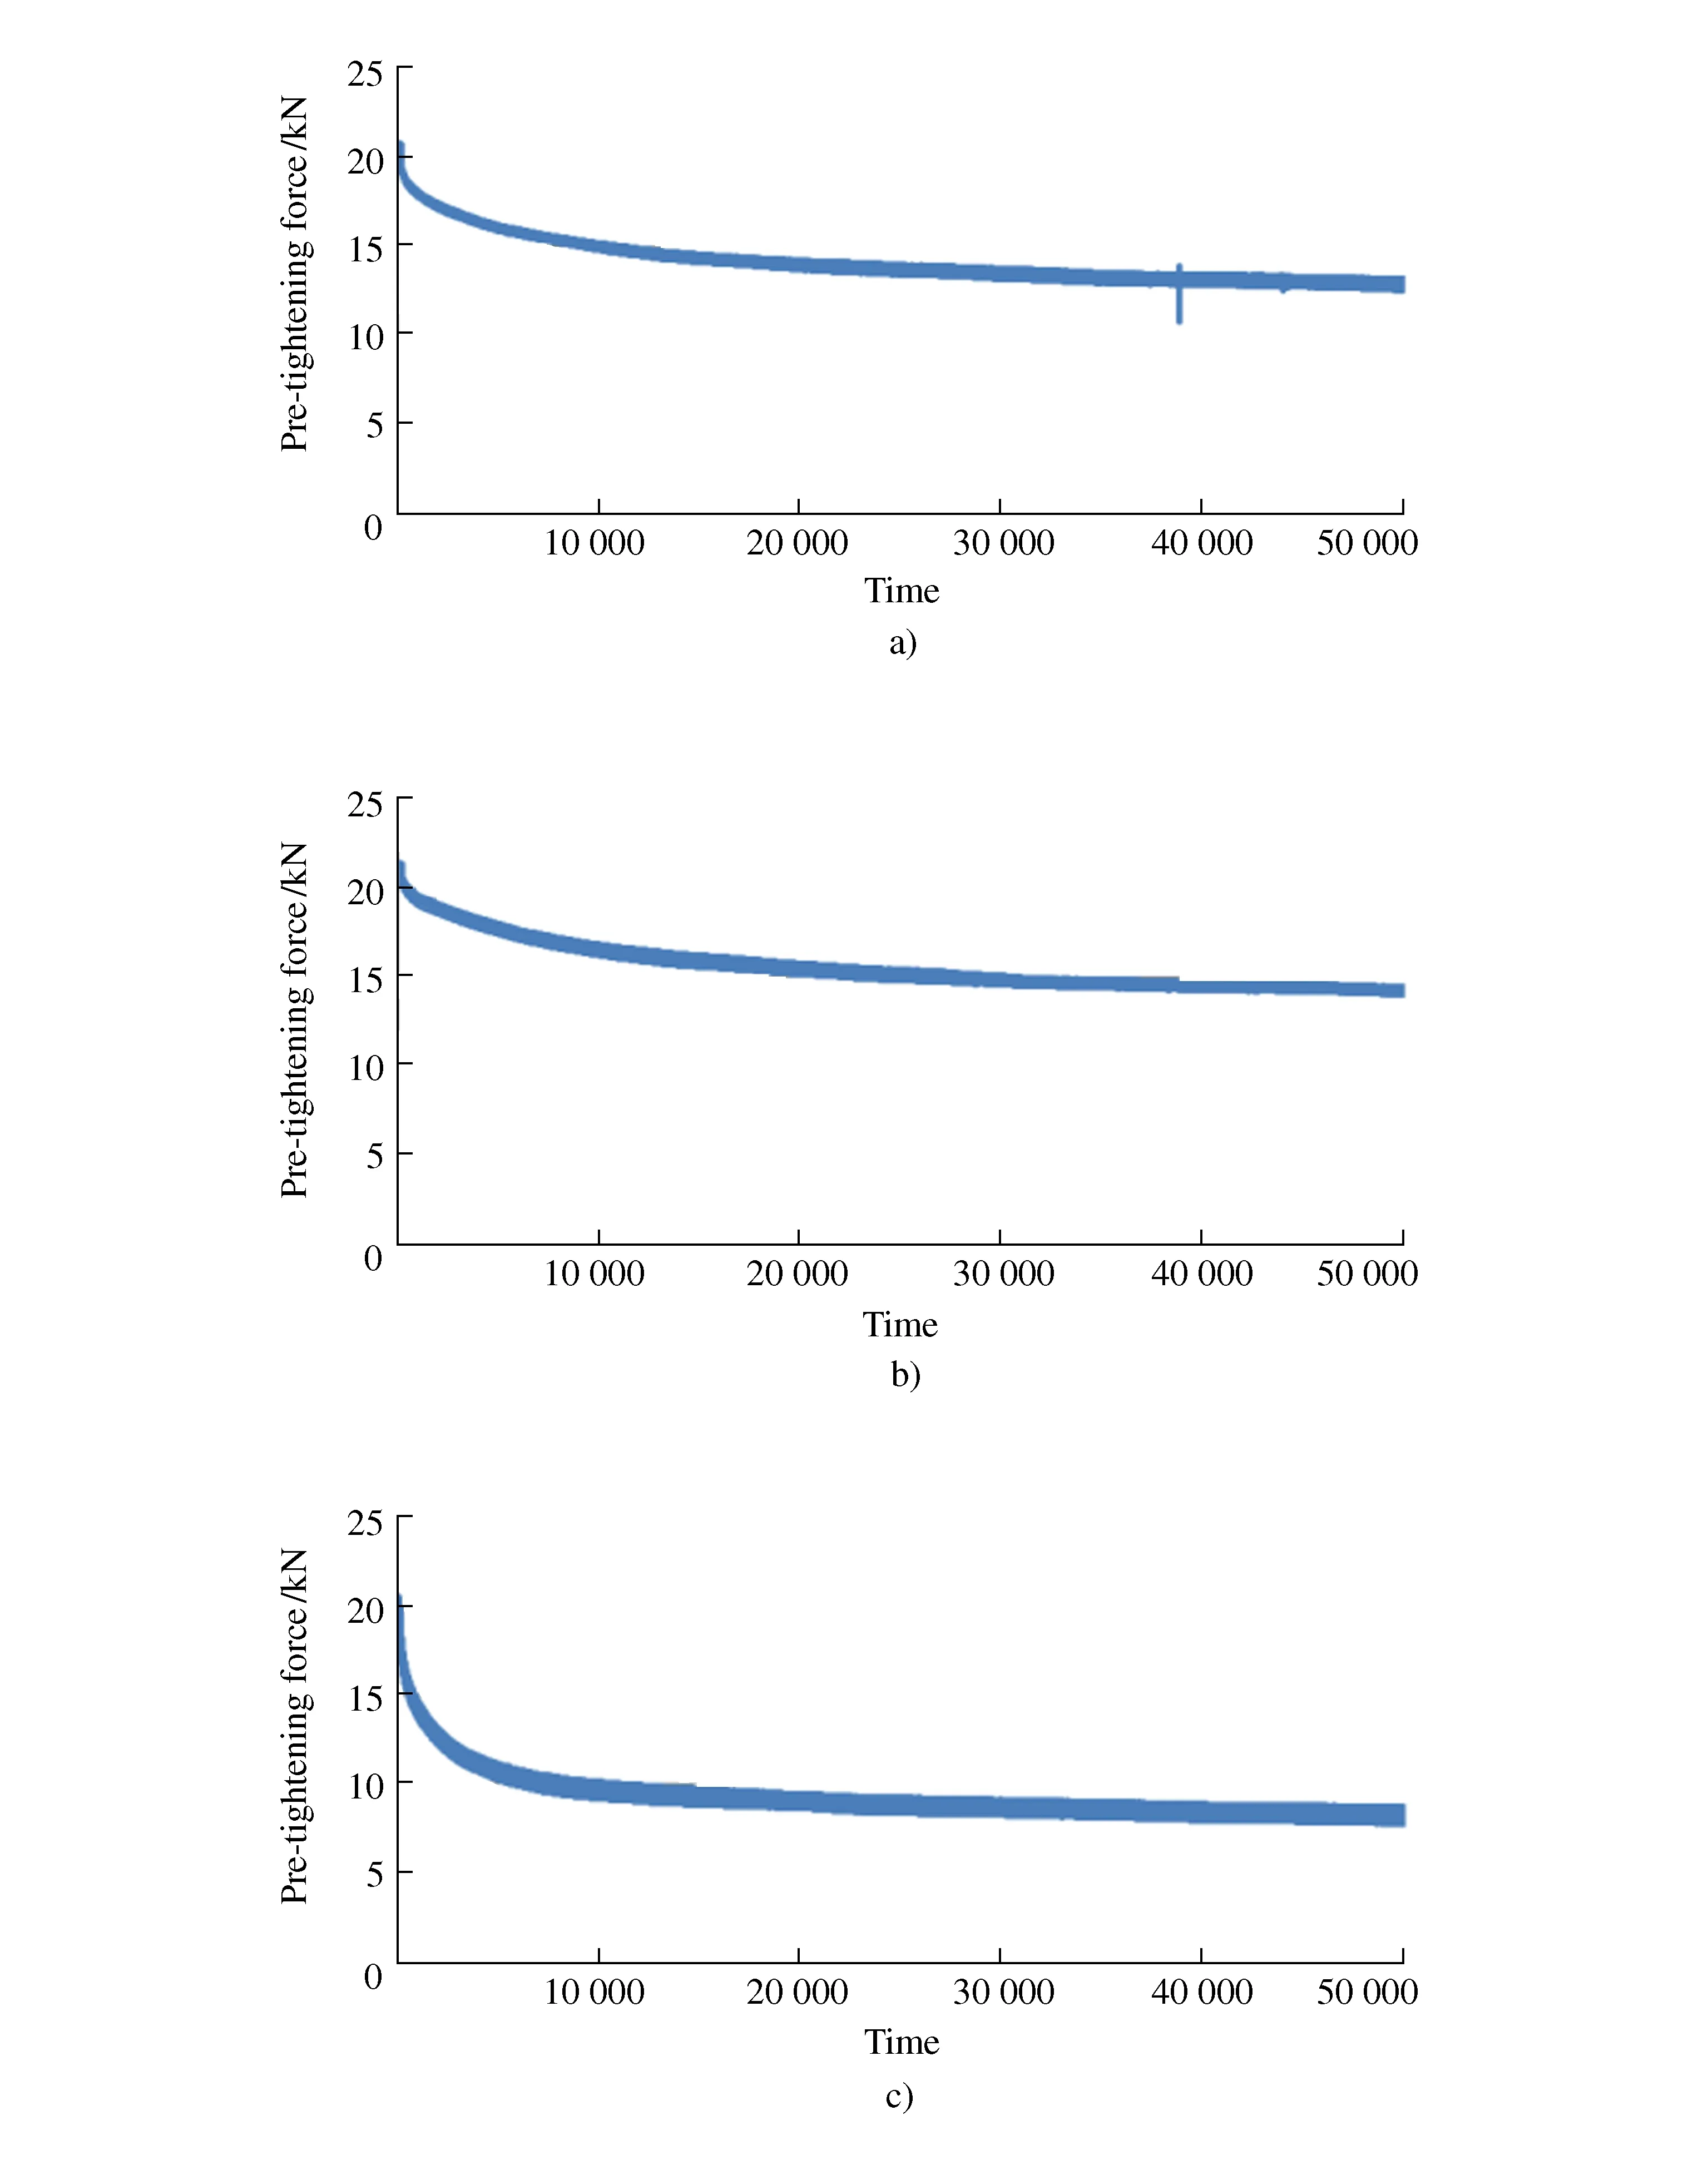
Figure 12 Test pre-tightening force curve of primer+topcoat coating specimen
The three groups of samples were vibrated 50 000 times. The pre-tightening force of sample 1 was reduced from 20.8 kN to 13.2 kN, the pre-tightening force of sample 2 was reduced from 21.3 kN to 14.5 kN, and the pre-tightening force of sample 3 was reduced from 20.8 kN to 14.5 kN, and 20.56 kN is reduced to 8.65 kN. It can be seen from the test curve that the measured pre-tightening force decreases continuously during the test, and the decrease is rapid at the beginning of the test, and then the downward trend is relatively gentle. The reasons for the analysis are as follows:
1) The decrease in the pre-tightening force caused by the bolt itself (previously carried out, the analysis is not repeated here);
2) Looking at the coating state of the three groups of samples at the end of the test (Figure 13), the topcoat of the coating has been abraded during the test, resulting in a slow drop in the pre-tightening force.
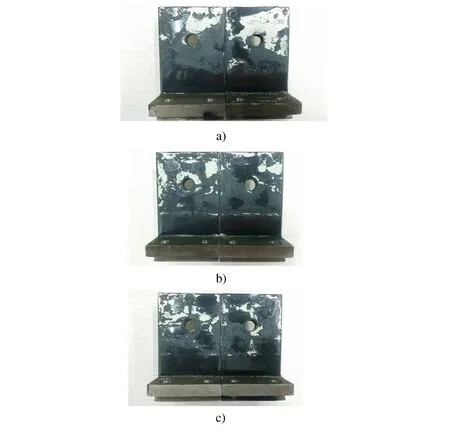
Figure 13 The surface state of the sample after the end of the test
Due to the combined effect of the heat generated by friction and the high pressure of the topcoat (Figure 14), it melts slightly and sticks (Figure 15), so that the coating is not discharged as much as the primer coating, but only discharged part of the flaky wear debris is protected to protect the primer layer from abrasion, so it has a certain ability to maintain the pre-tightening force.
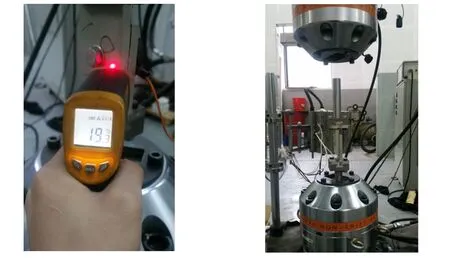
Figure 14 Temperature of test piece Figure 15 Tooling adhesion
During the test, the room temperature was 10 ℃, and the temperature of the test piece was 19.3 ℃.
After the test, the bolts were removed and the actuator was separated, and the tooling was glued together.
3.4.3 Vibration test of primer+intermediate coating+top coating coating tooling
A vibration test was performed on the primer+intermediate coating+top coating coating. During the test, it was found that a large amount of strip-shaped wear debris was discharged from the gap of the tooling (Figure 16). The pre-tightening force curve of the three sets of samples is shown in the Figure 17.
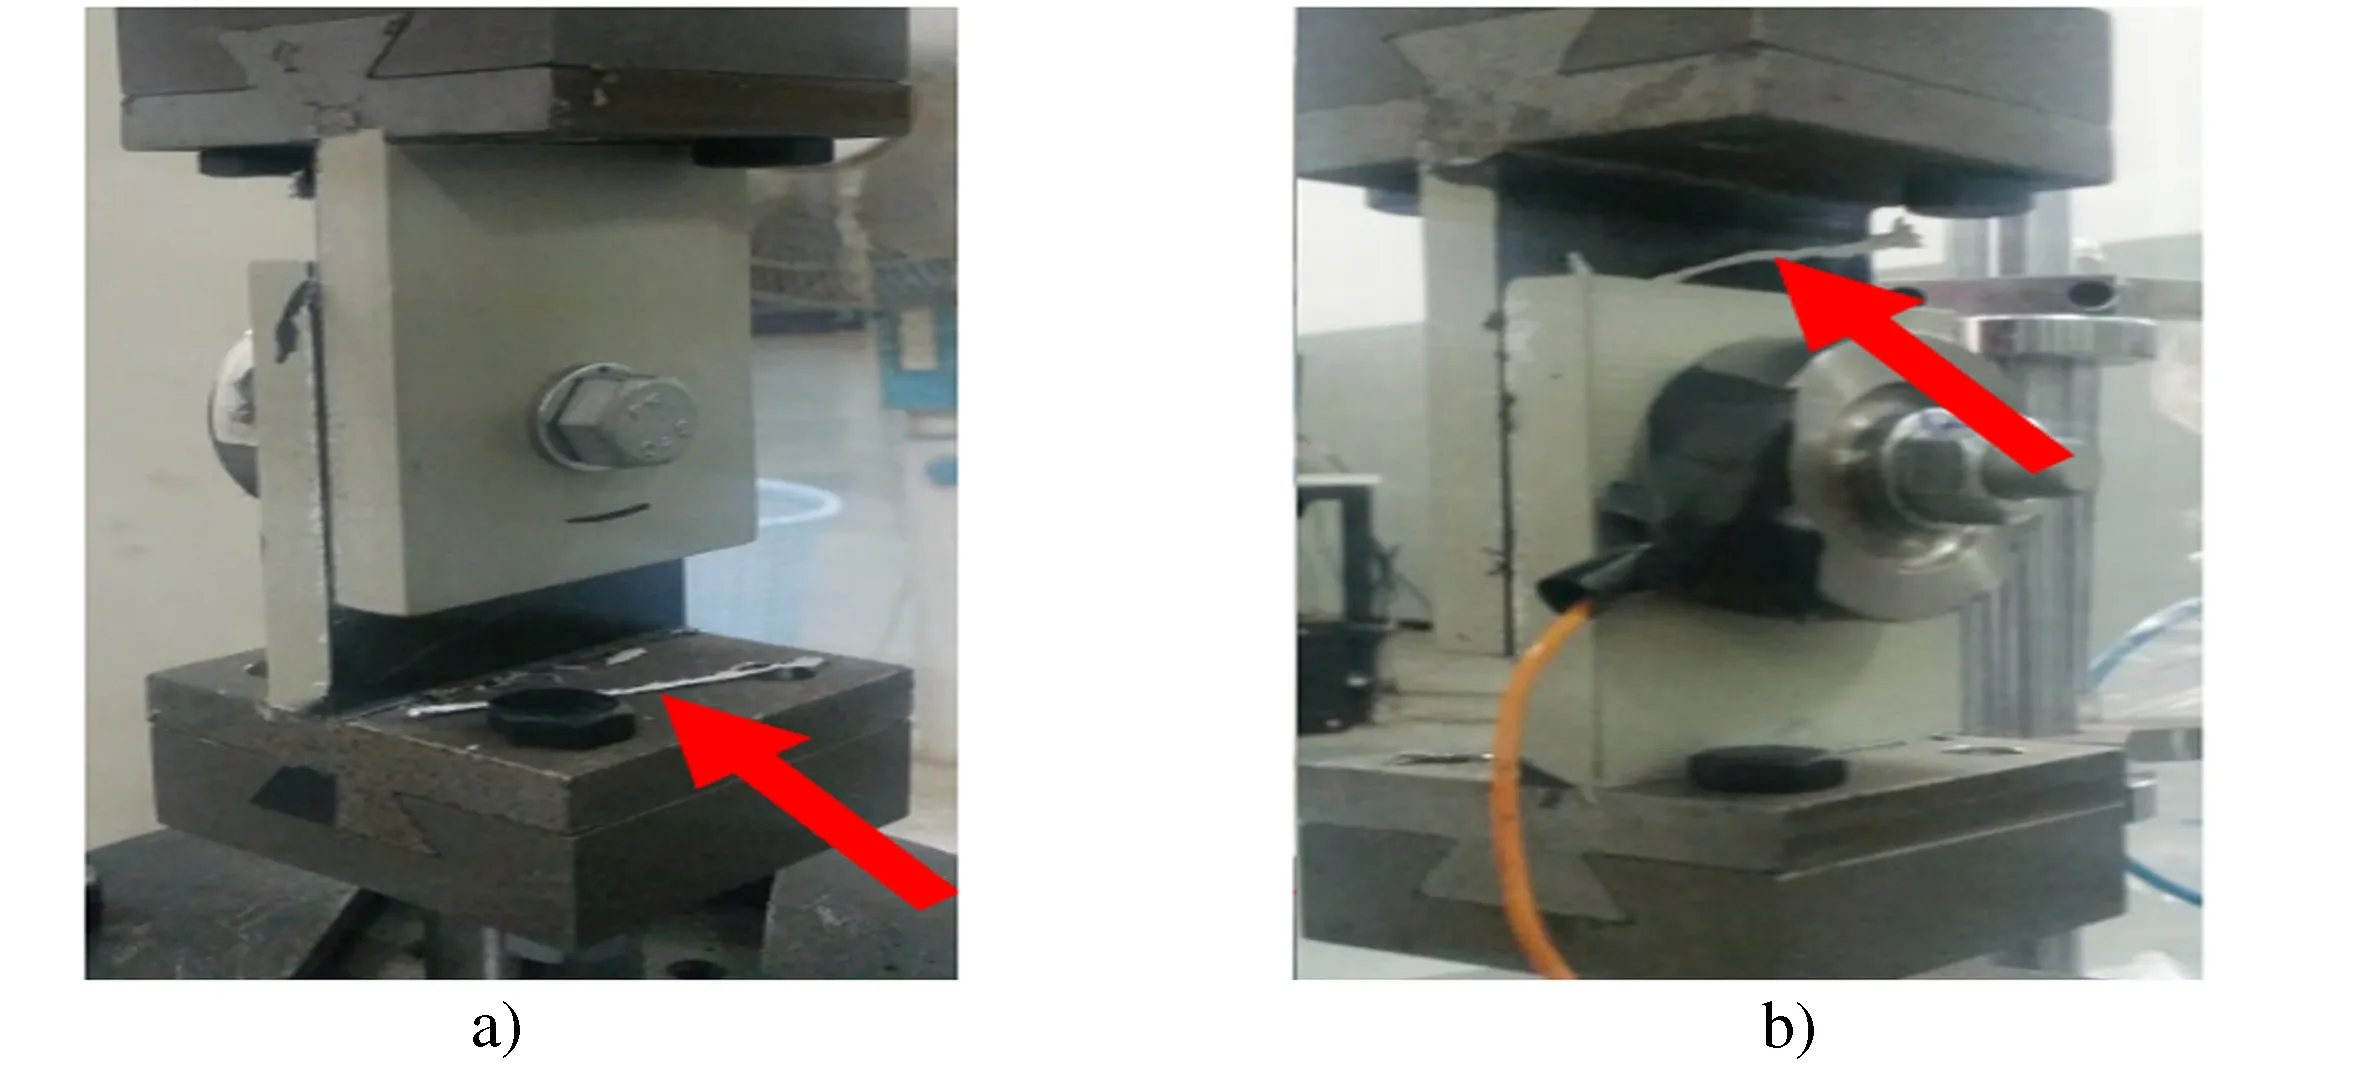
Figure 16 Striped wear debris
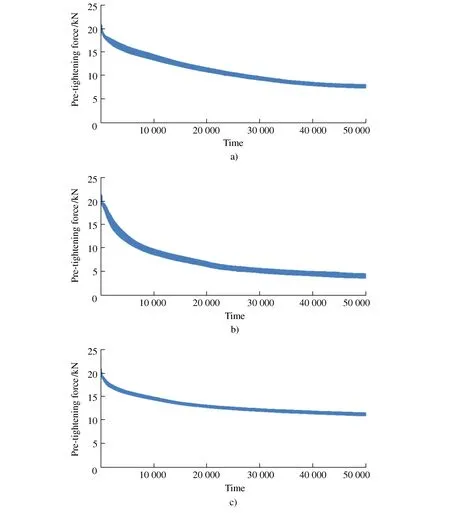
Figure 17 Test pre-tightening force curve of primer+intermediate coating+top coating coating
The three groups of samples were vibrated 50 000 times. The pre-tightening force of sample 1 was reduced from 20.83 kN to 7.58 kN, the pre-tightening force of sample 2 was reduced from 21.18 kN to 3.7 kN, and the pre-tightening force of sample 3 was reduced from 20.83 kN to 3.7 kN, and 21 kN is reduced to 11.1 kN. It can be seen from the test curve that the measured pre-tightening force decreases continuously during the test. The pre-tightening force decreases rapidly in the initial stage of the test, and the latter decreases more rapidly. The reasons for the analysis are as follows:
1) The pre-tightening force is decreased due to the bolt itself (previously It is analyzed and will not be repeated);
2) From the coating status of the three groups of samples at the end of the test (Figure 18), because the coating has three layers of paint, the paint layer has more interfaces and the overall thickness is thicker. The top coat and the middle coat. During the test, a large amount of it has been discharged (as can be seen from the strip-shaped wear debris), resulting in a rapid decrease in the pre-tightening force throughout the entire process. The same phenomenon as the previous group of experiments, the tooling adhesion occurred after the end of the experiment.
4 Conclusions
A summary of the test data is shown in Table 2.

Table 2 Summary of vibration test data
The test that the pre-tightening force of the primer coating has the smallest decrease, and the pre-tightening force of the bolt connection is maintained best, but because it is not wear-resistant, it is easy to expose the metal workpiece, which is very unfavorable to the corrosion prevention of the joint; and The coating thickness of primer+medium+finish paint is large, and the paint layer has many interfaces, which makes its stability poor. The coating will be discharged in a large amount under vibration environment. Although it can protect the primer, it cannot maintain the bolt pre-tightening force well; The primer+topcoat coating thickness is moderate, the paint interface is small, which can protect the primer and has high stability. Therefore, the primer+topcoat coating is the best coating choice for bolt connection under vibration environment.
The static test data that the thickness of the coating can affect the pre-tightening force of the bolt, and the thicker the coating, the larger the compression space after it is tightened, and the less conducive to maintaining the pre-tightening force of the connection. Therefore, primer coating is the best choice for bolt connection painting under static environment.
The use environment of bolt connection is complex, and there are many reasons for its looseness. This study clarified the influence of the surface coating of the connected part on the pre-tightening force of the bolt, which can provide certain guidance for actual production.
 International Journal of Plant Engineering and Management2022年2期
- International Journal of Plant Engineering and Management的其它文章
- Modeling Technique of the Aircraft Unsteady Aerodynamics Due to the Travelling Gust
- Design of Remote Monitoring System for Ceramic Electric Kiln
- Design on Online Fault Diagnosis System of Stealmaking Gas Dedust Fan
