
Community structure of mesopelagic fauna and the length-weight relationships of three common fishes inthe Cosmonaut Sea,Southern Ocean
2022-06-23 07:01WANGYehuiLIUChunlinDUANMiZHANGChiYEZhenjiangLIUYangTIANYongjunHEJianfeng
Advances in Polar Science 2022年2期
WANG Yehui, LIU Chunlin, DUAN Mi, ZHANG Chi, YE Zhenjiang, LIU Yang,2, TIAN Yongjun,2 & HE Jianfeng
Community structure of mesopelagic fauna and the length-weight relationships of three common fishes inthe Cosmonaut Sea,Southern Ocean
WANG Yehui1, LIU Chunlin1, DUAN Mi1, ZHANG Chi1, YE Zhenjiang1, LIU Yang1,2, TIAN Yongjun1,2*& HE Jianfeng3
1Frontiers Science Center for Deep Ocean Multispheres and Earth System and Key Laboratory of Mariculture, Ministry of Education, Ocean University of China, Qingdao 266100, China;2Laboratory for Marine Fisheries Science and Food Production Processes, Pilot National Laboratory for Marine Science and Technology, Qingdao 266237, China;3Polar Research Institute of China, Shanghai 200136, China
This study used specimens of marine organisms caught by rectangular midwater trawl in the Cosmonaut Sea, Southern Ocean, in austral summer 2019/2020, to determine species composition and spatial distributions of mesopelagic fauna in this sea. The data were also used to calculate the length-weight relationships of three common fishes captured during the survey (,, and). A total of 385 individual organisms with a total weight of 15462.2 g and representing 17 species were collected across the 11 stations visited. The small-sized crown jellyfish(order Coronatae) was the most-dominant species by number (96 individuals), and the zooplankton(Amphipoda) also showed high abundance (54 individuals). Among fishes, 81 individuals of(Paralepididae) were caught, followed by 71 individuals of(Myctophidae), 25 individuals of(Bathylagidae), and 16 individuals of(Gonostomatidae). Clustering analysis divided the mesopelagic community into “west” and “east” groups, and a greater number of individuals were collected in the western part of the sea. The length-weight relationships of the three common fishes revealed positive allometric growth for(=3.16), and negative allometric growth forand(both=2.53). Our descriptions of the mesopelagic-zone community structure and biological features of three common fishes provide basic information on the ecology of the Cosmonaut Sea, Southern Ocean, and will be useful for ecosystem-based fisheries management in this region.
Cosmonaut Sea, mesopelagic fauna, community structure, length-weight relationship,,
1 Introduction
The pelagic realm of the Antarctic is one of the least understood or studied environments on earth, and it is possibly the only area on earth that has not been greatly affected by human activities (White and Piatkowski, 1993; Hoddell et al., 2000). The Southern Ocean around Antarctica is the coldest water on earth, and the Antarctic Circumpolar Current (ACC) hinders heat exchange between the Southern Ocean and other sea areas, which has resulted in gradual cooling of the Southern Ocean over geologic time (Shevenell et al., 2004). Most marine creatures that have ever inhabited this cold environment have gradually gone extinct, and relatively few, unique species well-adapted to the extreme environment remain (Shevenell et al., 2004; Eastman, 2005).
At least 322 species of Antarctic fishes have been recorded in the Southern Ocean (Eastman, 2005). Fishes of the perciform suborder Notothenioidei comprise a dominant component in the Southern Ocean, where they are represented by more than 120 species in 8 families (Eastman and Eakin, 2000). Mesopelagic fishes play an important role in marine ecosystems, connecting the various trophic levels between small plankton and large predators. The Myctophidae (lanternfish) is a speciose mesopelagic family with high diversity and abundance, and is ubiquitous in the world’s oceans (Collins et al., 2012). To date, numerous studies of the fishery resources in the Southern Ocean have focused on species composition, distributions, abundance, and the ontogenetic vertical migration of mesopelagic fishes (Chiba et al., 2000; Nicol et al., 2000; Moteki et al., 2009; Collins et al., 2012; Christiansen et al., 2018).
One of the less-studied Antarctic sea areas is the Cosmonaut Sea, located in the Indian Ocean sector, and specifically in the western part of East Antarctica (Figure 1). The western part of the Cosmonaut Sea extends across the eastern boundary of the Weddell Gyre, and the eastern part is bordered by the cyclonic Prydz Bay gyre (van de Putte et al., 2010). The eastward-flowing ACC forms the northern boundary of the Cosmonaut Sea, and the southern part of the sea is influenced by the countercurrent, westward- flowing Antarctic Coastal Current (also known as the East Wind Drift) (Hunt et al., 2007; van de Putte et al., 2010). Compared with the warming observed in West Antarctica, a relatively stable and slightly cooling trend was observed in the hydrological environment of the Cosmonaut Sea (Armour et al., 2016). Distribution of the mesozooplankton community in the pelagic zone within this region was found to be determined by oceanographic features such as the ACC and the Antarctic Slope Current, as well as by large-scale, dynamic oceanographic processes like pack ice and chlorophyll concentrations (Swadling et al., 2010).

Figure 1 Map of the Southern Ocean, the box demarcated the Cosmonaut Sea in East Antarctic.
Though some scientific surveys were previously conducted in the Cosmonaut Sea, the mesopelagic fish resources have rarely been investigated. The first comprehensive survey of the Cosmonaut Sea was conducted in the summer of 1972/1973 and the winter of 1973, and mainly described the composition of phytoplankton and the distributions of mesopelagic species (Chimitza, 1976). The second large-scale survey was conducted in the summer of 1984, and mainly described the oceanography and biology of Prydz Bay (Lubimova et al., 1988). Surveys of large zooplankton in the sea were conducted in the austral summers (January/February) of 1987, 1988, 1989 and 1990; the main subjects of those surveys included the chaetognath, and the krill speciesand(Hunt et al., 2007). Subsequently, Pakhomov (1995) studied the demographics of Antarctic krill. Moteki et al. (2009) investigated the horizontal and vertical distributions of mesopelagic fishes near Lützow-Holm Bay (Indian Ocean sector) in 2008. van de Putte et al. (2010) studied the distribution of squid and fish fauna in the pelagic zone during the Baseline Research on Oceanography, Krill and the Environment (BROKE)-West survey in 2006. However, in comparison with other sea areas of Antarctica, the Cosmonaut Sea has received less attention to uncover the species composition and ecosystem structure. Because all these investigations were conducted before 2010, we lack knowledge of the latest state of the mesopelagic zone.
Here, we report on the composition and distributions of mesopelagic fauna in the Cosmonaut Sea based on survey results of the thirty-sixth Chinese National Antarctic Research Expedition (CHINARE) in austral summer 2019/2020. In addition, we calculated the length-weight relationships of three common fishes collected during the survey (i.e., Antarctic lanternfish, Antarctic deep-sea smelt,and Veiled anglemouth). Our study provides the most-recent basic information and lends scientific support for further studies on the fish biology and oceanic ecosystem of the Cosmonaut Sea.
2 Materials and methods
2.1 Sample collection
Samples of mesopelagic fauna were collected in the Cosmonaut Sea during a one-month cruise, from 7 December 2019 to 7 January 2020, during the 36th CHINARE, carried out with the polar icebreaker R/V. Trawls at 11 stations in the Cosmonaut Sea were conducted between 33°E–69°E and 60°S–66°S (Figure 2). Mesopelagic species were captured using a rectangular midwater trawl with an 8-m2mouth. The sampling records used temperature–depth (TD) profiles, and the measured sampling depths ranged from 220 m to 1200 m. Each trawl lasted approximately 3 h, and most were done at night or early in the morning. Trawler speeds ranged from 1.5 knots to 1.7 knots. The organisms captured were initially identified on board and frozen, and then transported to a laboratory for further species identification and biological measurements.

Figure 2 Numbers of individuals, species composition, and stations visited in a survey of mesopelagic fauna in the Cosmonaut Sea (Southern Ocean), in summer of 2019/2020.
2.2 Sample measurement
Specimens were identified following the works of Llano and Wallen (1971), Gon and Heemstra (1990), Siegel (2016), Cherel (2020), and Xavier et al. (2020). Organisms were identified to the lowest-possible taxon level. The total length (TL) or standard length (SL) of fish specimens was measured with a ruler accurate to 1 mm. For squids, the TL and mantel length were measured. The weight of each specimen was measured with an electronic balance accurate to 0.1 g.
2.3 Data analysis
Bray-Curtis similarity was used to compare the species composition (Field et al., 1982) at the 11 stations. After the total analysis, the stations were divided into six groups according to longitudinal differences between stations; stations less than 1.5° apart were placed in the same group. Species abundance data were log10(+1)-transformed to smooth the large abundance values of a few species (Hunt et al., 2007). Analyses were conducted using the software PRIMER 6 (Clarke and Gorley, 2006).
The average TL or SL, length range, average weight, and weight range for three common mesopelagic fishes (,and) were calculated. The length and weight distributions of these fishes were analyzed according to frequency distributions of groups at increments of 10 mm or 0.5 g. Owing to caudal-fin damage, we measuredfor SL.
The length-weight relationship (LWR) was calculated using the equation:
=×L
whereis weight (g),is length (mm), andandare parameters to be determined. The parameteris the growth condition factor, which reflects the quality of the environment in which the population is located and represents biological fullness to a certain extent. The parameteris the allometric growth factor, which reflects the non-uniformity of growth and development. A-test was used to analyze the difference betweenand the value of 3, to determine whether fish growth was positive allometric (>3), isokinetic (=3), or negative allometric (<3) (Froese, 2006). Accurate biological data could not be obtained for the Antarctic jonasfishbecause of physical damage to the specimens in the trawl, therefore this species was excluded from the analysis.
3 Results
3.1 Species composition
A total of 385 individuals, belonging to 5 classes, 12 orders, 14 families, and 17 species, were collected in the Cosmonaut Sea.The total weight of the whole samples was 15462.2 g. The most-abundant group was fish, with 5 families and 8 species, followed by jellyfish and squid, both of which contain 3 species that belonging to 3 separate families (Table 1). In terms of quantity, the crown jellyfishwas dominant, comprising 24.9% of the total specimens, followed by(21.0%),(18.4%), the amphipod(14.0%), and(9.1%) (Figure 3). The number of individuals was less than 16 among other species/taxa collected.

Table 1 Summary of mesopelagic species collected by rectangular midwater trawl in the Cosmonaut Sea, Southern Ocean, across 11 stations surveyed in austral summer 2019/2020
Note: Dashes (–) indicate no data.

Figure 3 Proportion of mesopelagic species by number of individuals captured by rectangular midwater trawl in the Cosmonaut Sea in summer 2019/2020. The top-six mesopelagic species with the highest abundance and their individual numbers are labelled in the figure.
Species that occurred more often did not necessarily have higher abundance. For mesopelagic fishes,andwere captured at 10 of the 11 stations, and both species occurred at the most stations, but the numbers of individuals were not the largest (but rather the second- and third-largest, respectively). For groups other than fish,, which was dominant in number, occurred in 9 stations, andoccurred in 4 stations (Table 1).
Station C2-7 in the western part of the Cosmonaut Sea had the largest number of species, with 11 species (total of 46 individuals). Station C9-6, a nearshore station in the easternmost part of the Cosmonaut Sea, had the largest number of individuals, up to 76, but was the station with the least number of species (Figure 2).
3.2 Spatial distribution
Cluster analysis of mesopelagic species composition revealed two clusters (A and B) and three outliers (C, D, E) (Figure 4). Cluster A comprised six stations in the western part of the Cosmonaut Sea (i.e. C1/2-11, C2-7, C3-2, C3-11, C4-2, C4-7). Cluster B together with the outliers C, D, and E comprised five stations in the eastern part of the Cosmonaut Sea (i.e. C7-1, C7-4, C8-2, C8-4, C9-6). Thus, the results of cluster analysis divided the mesopelagic community into ‘west’ and ‘east’ areas of the sea. We next analyzed the cluster of mesopelagic species composition after stations were divided into different groups based on the longitudinal differences. The results were similar to the total analysis: the groups in the west area clustered first, and then clustered with the groups in the east area (Figure 5).
In the west Cosmonaut Sea,was the dominant species with the largest number of individuals (74), followed byand(each > 50 individuals). The abundance of fish species was higher than that of other major groups. In contrast, in the east area,had the largest number of individuals (37), though it only occurred at one station (C9-6). The second-largest number of individuals was for, which occurred at three stations. The abundance of fish species was low. The number of total individuals captured was larger in the west than in the east (261 vs 124), but the number of species was fewer in the west (11 vs 15).
Figure 6 depicts the distributions of the top-six species (four fishes, one jellyfish, and one shrimp) based on having the largest numbers of individuals. The fishesanddid not occur in all stations in the west area, yet their abundance was higher there than in the east area. In contrast,,, andoccurred in all stations in the west, and were also dominant in their abundances in that area. Althoughoccurred at proportionately more stations in the west, their abundance was dominant (37 individuals) in the east. Five other species were also more distributed in the west area than in the east area of the Cosmonaut Sea.

Figure 4 Dendrogram (left) representing the classification of sampling stations based on Bray-Curtis similarity for the fish assemblage, and the mesopelagic species composition and abundance at each station (right) sampled by rectangular midwater trawl. Numbers beside the horizontal bars indicate the number of individuals.
Figure 5 The classification of groups of stations based on Bray-Curtis similarity for the fish assemblage. G1 includes stations C1/2-11 and C2-7; G2 includes stations C3-2 and C3-11; G3 includes stations C4-2 and C4-7; G4 includes station C7-1; G5 includes stations C7-4, C8-2 and C8-4; and G6 includes station C9-6.

Figure 6 Spatial distribution of the six-most-abundant mesopelagic species in the Cosmonaut Sea, Southern Ocean, sampled across all stations; circle size represents the number of individuals, and different colors represent different species. The figure includes four teleost fish: a,b,c,d,; e, one species of Coronata,f, one amphipod,.
3.3 Size composition and length-weight relationships of three common fishes
A total of 45, 25, and 11were measured for length.ranged from 20 mm to 114 mm SL, with an average (±SD) length of 37.38 ± 20.44 mm SL; the dominant length group was 20–29 mm SL, with 13 individuals.ranged from 26 mm to 150 mm TL, with an average length of 57.68 ± 25.81 mm TL; the dominant group was 30–49 mm TL, with 10 individuals.was 51.82 ± 10.43 mm TL on average, ranged 32–68 mm TL, and the dominant group was 50–59 mm TL, with 6 individuals (Figure 7).
By body weight,ranged from 0.06 g to 12.60 g, average 1.30 (±2.52) g, and the dominant weight group was 0–0.5 g, with 29 individuals. The weight ofranged from 0.10 g to 32.40 g, average 2.15 (±6.24) g, and the dominant weight group was 0–0.5 g, with 11 individuals. The weight ofranged from 0.30 g to 1.51 g, average 0.80 (±0.44) g, and the dominant weight group was 0–1.0 g, with 8 individuals (Figure 7).
There was a significant relationship between length and weight for all three common fishes considered (<0.05). The LWR equations for the three fish species were as follows (Figure 8; Table 2):
:= 6 × 10−52.53(2= 0.786), (1)
:= 2 × 10−63.16(2= 0.945), (2)
:= 3 × 10−52.53(2= 0.783), (3)
Thevalues were significantly less than 3 forand, indicating negative allometric growth. Thevalue was significantly greater than 3 for, indicating positive allometric growth.
4 Discussion
The results of our analyses using samples collected in the upper 1200 m of the Cosmonaut Sea, in austral summer 2019/2020, provided basic information on the composition and distribution of mesopelagic fauna in this region of East Antarctic. A total of 8 mesopelagic fish species were found in this survey. When compared with that of marine communities at even lower latitudes in the Southern Ocean, the diversity of mesopelagic fishes in the Cosmonaut Sea appears to be lower (Iwami and Kubodera, 1990; Moteki et al., 2009). Furthermore, fish diversity was also lower in the Cosmonaut Sea than in other Antarctic sea areas, such as the Scotia Sea (43 species: Collins et al., 2012), Dumont d’Urville Sea (27 species: Moteki et al., 2011), and Davis Sea (21 species: Hoddell et al., 2000). A total of 13 fish species was reported from the 2005 survey of Lützow-Holm Bay (Moteki et al., 2009), and 17 species from a survey of the Cosmonaut Sea and Prydz Bay in 2006 (van de Putte et al., 2010). Fewer sampling stations in our study might be responsible for these differences—the other studies all used more sampling stations over a larger area.

Figure 7 Frequency histograms of fish lengths and weights for(a, d);(b, e);(c, f).represents the sample size.
In terms of mesopelagic fish species composition,,,, andwere dominant, as similarly found in the study of Moteki et al. (2009). van de Putte et al. (2010) reported that the Antarctic silverfishwas dominant, yet it rarely occurred in the study of Moteki et al. (2009) wherein only four individuals were captured at two stations, and it did not occur in our study. Interestingly, noand none of the lanternfish species,, andwere captured in the study of van de Putte et al. (2010), though these fishes are known to have circum-Antarctic distributions; therefore, that finding may be related to insufficient sampling stations as well. In our study,andoccurred at the most stations (both species at 10 of 11 stations), indicating a possibly wide distribution in the Cosmonaut Sea.was captured at all stations except for the nearshore, shallow-water station C1/2-11, indicating that the species may have a preference for deeper habitat.
In terms of horizontal distribution of mesopelagic species, the number of individuals captured in the west area of the Cosmonaut Sea was larger than in the east area, but fewer species were recorded in the west. Cluster analysis identified the “west” and “east” differences in the sea based on clustering of the stations in the west, while the stations in the east were scattered. The horizontal distribution of the six-most-abundant mesopelagic species showed that these species occurred more frequently in the west area than in the east area, where their abundance was also greater (except for, with 37 individuals captured at station C9-6). High fish diversity has been recorded in the Prydz Bay shelf-break region (van de Putte et al., 2010), which may be due to the earlier onset of melting in the east and the stronger influence of the southern perimeter of the ACC bringing warmer and higher-salinity water into Prydz Bay (Meijers et al., 2010). Our survey did not extend to Prydz Bay, therefore our findings would be less affected by the ACC, and in general there may be low abundances of mesopelagic fishes in the eastern Cosmonaut Sea. At its southern boundary, the AAC connects to the eastern part of the Weddell Sea and the western part of the Cosmonaut Sea (Hunt et al., 2007); inorganic nutrients and chlorophyll from the Weddell Sea will be transported to the western part of the Cosmonaut Sea, allowing for higher productivity and biomass. However, this inference could not be validated in the present study because of a lack of corresponding oceanographic data (such as water temperature, salinity, and chlorophyll concentration) and data on lower-trophic level species.
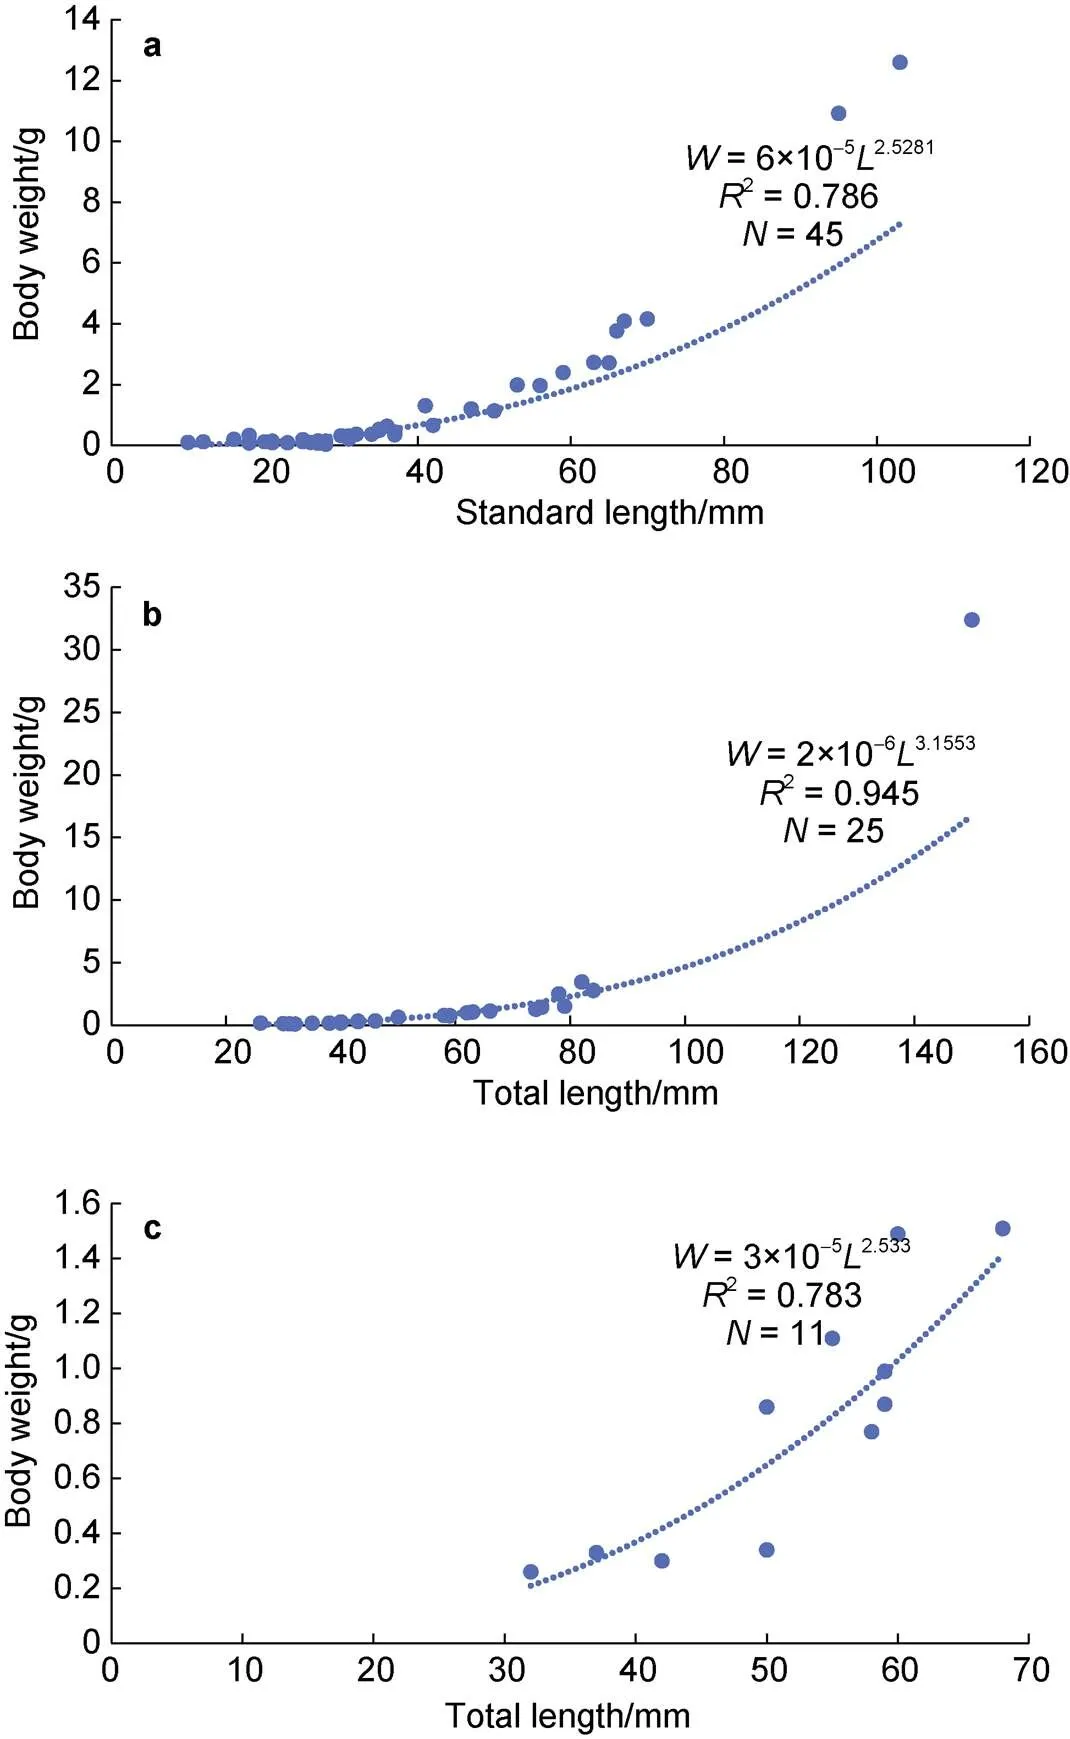
Figure 8 length-weight relationships for(a),(b), and(c)represents sample size.
We also determined the length-weight relationships for three common mesopelagic fishes, by means of a commonly used formula in fishery ecology (Anderson and Neumann, 1996). The condition factoris generally used as an index to assess the growth conditions and biological fullness (Tesch, 1968). In this study, the valuefor(= 6) was larger than that for the other two species (0.2 and 3, respectively); this is understandable based on the species’ higher fat content and shallower distribution wherein fish can potentially make better use of the zooplankton food resources.
There are many reasons for differences invalues, including sex, population, environment, developmental stage, and fishing intensity (Froese, 2006; Muchlisin et al., 2010; Sani et al., 2010; Zhu et al., 2015). In addition, the direction of the deviation and the value ofare affected by the growth environment and biological productivity of prey organisms. High productivity tends to promote positive allometric growth, while low productivity tends to promote negative allometric growth (Philip and Mathew, 1996; Thomas et al., 2003). In this study,showed positive allometric growth (>3), whereasandshowed negative allometric growth (<3), indicating that the body weight ofincreases faster than its length, while in the other two species the body length increases faster than the weight. This result suggests that the Cosmonaut Sea is more suitable to the growth and development of.
5 Conclusions
In conclusion, our study provides basic information on the composition and community structure of mesopelagic fauna in the Cosmonaut Sea, Southern Ocean. The dominant species were,,,, and. The number of individuals caught in rectangular midwater trawls in austral summer was larger in the western part of the sea than in the eastern part; however, fewer species were recorded in the west—some species otherwise captured in the east area were not recorded there. We also used the samples to estimate the size distributions and length-weight relationships of three common mesopelagic fishes in the Cosmonaut Sea. This study makes an important contribution to research on the fishery resources of the rarely surveyed Cosmonaut Sea, and provides basic information for understanding the ecological characteristics of this polar sea.

Table 2 Descriptive statistics and estimated parameters of the length-weight relationships of the mesopelagic fishes Electrona antarctica,Bathylagus antarcticus and Cyclothone microdon
Acknowledgments We thank the scientific staff and crew aboard the 36th CHINARE for their assistance with sampling. Great thanks to two anonymous reviewers and Guest Editor Dr. Jianmin Pan whose comments greatly improved the manuscript. This work was financially supported by National Polar Special Program “Impact and Response of Antarctic Seas to Climate Change” (Grant no. IRASCC 01-02-05C).
Note: This paper is a solicited manuscript of Special Issue “Marine Ecosystem and Climate Change in the Southern Ocean” published on Vol.33, No.1 in March 2022.
Anderson R O, Neumann R M. 1996. Length, weight, and associated structural indices//B R Murphy, D W Willis (eds). Fisheries techniques. 2nd edition. American Fisheries Society, Bethesda, Maryland, 447-482.
Armour K C, Marshall J, Scott J R, et al. 2016. Southern Ocean warming delayed by circumpolar upwelling and equatorward transport. Nat Geosci, 9(7): 549-554, doi:10.1038/ngeo2731.
Cherel Y. 2020. A review of Southern Ocean squids using nets and beaks. Mar Biodivers, 50(6): 1-42, doi:10.1007/s12526-020-01113-4.
Chiba S, Hirawake T, Ushio S, et al. 2000. An overview of the biological/oceanographic survey by the RTV Umitaka-Maru III off Adelie Land, Antarctica in January–February 1996. Deep Sea Res Part II Top Stud Oceanogr, 47(12-13): 2589-2613, doi:10.1016/S0967- 0645(00)00037-0.
Chimitza V A, 1976. Investigation of geostrophic currents in the Antarctic zone of the Indian Ocean. Oceanology, 16: 234-238.
Christiansen H, Dettai A, Heindler F M, et al. 2018. Diversity of mesopelagic fishes in the Southern Ocean – A phylogeographic perspective using DNA barcoding. Front Ecol Evol, 6: 120, doi:10.3389/fevo.2018.00120.
Clarke K, Gorley R. 2006. PRIMER v6, User Manual/Tutorial, Plymouth Routine in Multivariate Ecological Research.
Collins M A, Stowasser G, Fielding S, et al. 2012. Latitudinal and bathymetric patterns in the distribution and abundance of mesopelagic fish in the Scotia Sea. Deep Sea Res Part II Top Stud Oceanogr, 59-60: 189-198, doi:10.1016/j.dsr2.2011.07.003.
Eastman J T, Eakin R R. 2000. An updated species list for notothenioid fish (Perciformes; Notothenioidei), with comments on Antarctic species. Arch Fish Mar Res, 48(1): 11-20.
Eastman J T. 2005. The nature of the diversity of Antarctic fishes. Polar Biol, 28(2): 93-107, doi:10.1007/s00300-004-0667-4.
Field J G, Clarke K R, Warwick R M. 1982. A practical strategy for analysing multi species distribution patterns. Mar Ecol Prog Ser, 8: 37-52, doi:10.3354/meps008037.
Froese R. 2006. Cube law, condition factor and weight-length relationships: history, meta-analysis and recommendations. J Appl Ichthyol, 22(4): 241-253, doi:10.1111/j.1439-0426.2006.00805.x.
Gon O, Heemstra P C. 1990. Fishes of the Southern Ocean. J. L. B. Smith Institute of Ichthyology, Grahamstown, South Africa.
Hoddell R J, Crossley A C, Williams R, et al. 2000. The distribution of Antarctic pelagic fish and larvae (CCAMLR division 58.4.1). Deep Sea Res Part II Top Stud Oceanogr, 47(12-13): 2519-2541, doi:10.1016/S0967-0645(00)00034-5.
Hunt B P V, Pakhomov E A, Trotsenko B G. 2007. The macrozooplankton of the Cosmonaut Sea, east Antarctica (30°E-60°E), 1987–1990. Deep Sea Res Part I Oceanogr Res Pap, 54(7): 1042-1069, doi:10.1016/j.dsr.2007.04.002.
Iwami T, Kubodera T. 1990. Mesopelagic fishes collected with 10-foot IKPT in the Indian sector of the Antarctic Ocean and its neighboring waters during the JARE-28 cruise, 1987. Proc NIPR Symp Polar biol, 3: 64-70.
Llano G A, Wallen I E. 1971. Biology of the Antarctic Seas IV. Vol. 17. American Geophysical Union, doi:10.1029/ar017.
Lubimova T G, Makarov R R, Maslennikov V V, et al. 1988. Interdisciplinary investigations of pelagic ecosystem in the Commonwealth and Cosmonauts seas. Collected Papers. Moscow: VNIRO Publishers, 1-241 (in Russian).
Meijers A J S, Klocker A, Bindoff N L, et al. 2010. The circulation and water masses of the Antarctic shelf and continental slope between 30° and 80°E. Deep Sea Res Part II Top Stud Oceanogr, 57(9-10): 723-737, doi:10.1016/j.dsr2.2009.04.019.
Moteki M, Horimoto N, Nagaiwa R, et al. 2009. Pelagic fish distribution and ontogenetic vertical migration in common mesopelagic species off Lützow-Holm Bay (Indian Ocean sector, Southern Ocean) during austral summer. Polar Biol, 32(10): 1461-1472, doi:10.1007/s00300- 009-0643-0.
Moteki M, Koubbi P, Pruvost P, et al. 2011. Spatial distribution of pelagic fish off Adélie and George V Land, East Antarctica in the austral summer 2008. Polar Sci, 5(2): 211-224, doi:10.1016/j.polar. 2011.04.001.
Muchlisin Z A, Musman M, Siti Azizah M N. 2010. Length-weight relationships and condition factors of two threatened fishes,and, endemic to Lake Laut Tawar, Aceh Province, Indonesia. J Appl Ichthyol, 26(6): 949-953, doi:10.1111/j.1439-0426.2010.01524.x.
Nicol S, Pauly T, Bindoff N L, et al. 2000. “BROKE” a biological/ oceanographic survey off the coast of East Antarctica (80°–150°E) carried out in January–March 1996. Deep Sea Res Part II Top Stud Oceanogr, 47(12-13): 2281-2297, doi:10.1016/S0967-0645(00)00026- 6.
Pakhomov E A. 1995. Demographic studies of Antarctic krillin the Cooperation and Cosmonaut Seas (Indian sector of the Southern Ocean). Mar Ecol Prog Ser, 119(1): 45-61, doi:10.3354/meps119045.
Philip K P, Mathew K. 1996. Length-weight relationships and relative condition factor in(Forsskal). Fish Tech, 33(2): 79-83.
Sani R, Gupta B K, Sarkar U K, et al. 2010. Length-weight relationships of 14 Indian freshwater fish species from the Betwa (Yamuna River tributary) and Gomti (Ganga River tributary) rivers. J Appl Ichthyol, 26(3): 456-459, doi:10.1111/j.1439-0426.2009.01388.x.
Shevenell A E, Kennett J P, Lea D W. 2004. Middle Miocene Southern Ocean cooling and Antarctic cryosphere expansion. Science, 305(5691): 1766-1770, doi:10.1126/science.1100061.
Siegel V. 2016. Biology and ecology of Antarctic krill. Cham, Switzerland: Springer, doi:10.1007/978-3-319-29279-3.
Swadling K M, Kawaguchi S, Hosie G W. 2010. Antarctic mesozooplankton community structure during BROKE-West (30°E–80°E), January–February 2006. Deep Sea Res Part II Top Stud Oceanogr, 57(9-10): 887-904, doi:10.1016/j.dsr2.2008.10.041.
Tesch F W. 1968. Methods for sssessment of fish production in fresh waters. Oxford: Blackwell Scientific Press, 93-123.
Thomas J, Venu S, Kurup B M. 2003. Length-weight relationship of some deep-sea fish inhabiting the continental slope beyond 250 m depth along the West Coast of India. NAGA, 26(2): 17-21.
van de Putte A P, Jackson G D, Pakhomov E, et al. 2010. Distribution of squid and fish in the pelagic zone of the Cosmonaut Sea and Prydz Bay region during the BROKE-West campaign. Deep Sea Res Part II Top Stud Oceanogr, 57(9-10): 956-967, doi:10.1016/j.dsr2.2008. 02.015.
White M G, Piatkowski U. 1993. Abundance, horizontal and vertical distribution of fish in eastern Weddell Sea micronekton. Polar Biol, 13(1): 41-53, doi:10.1007/BF00236582.
Xavier J C, Cherel Y, Boxshall G, et al. 2020. Crustacean guide for predator studies in the Southern Ocean. Scientific Committee on Antarctic Research, 1-253.
Zhu L X, Hou G, Liang Z L. 2015. Parameter estimation of the weight-length relationship of Japanese anchovy in the north Yellow Sea using Bayesian methods. J Fish Sci China, 22(4): 757-769, doi: 10.3724/SP.J.1118.2015.140386.
10.13679/j.advps.2021.0048
Wang Y H, Liu C L, Duan M, et al. Community structure of mesopelagic fauna and the length-weight relationships of three common fishes in the Cosmonaut Sea, Southern Ocean. Adv Polar Sci, 2022, 33(2): 181-191,doi:10.13679/j. advps.2021.0048
13 October 2021;
26 May 2022;
30 June 2022
Corresponding author, ORCID: 0000-0003-2798-0638, E-mail: yjtian@ouc.edu.cn
 Advances in Polar Science2022年2期
- Advances in Polar Science的其它文章
- Numerical simulation of the dynamic effects of grounding icebergs on summer circulation in Prydz Bay,Antarctica
- Comparison of ship-based CTD measurement of Circumpolar Deep Water in the Amundsen Sea based on World Ocean Database
- Bacterial community diversity of meltwater runoff and soil in Midre Lovénbreen glacier in Ny-Ålesund,Arctic
- Inventory of unintentional POPs emission from anthropogenic sources in Antarctica
- Development of the International Polar Years and their benefits for China
- The evaluation of biological productivity by triple isotope composition of oxygen trapped in ice-core bubbles and dissolved in ocean:a review