
Trimetallic FeCoNi disulfide nanosheets for CO2-emission-free methanol conversion
2022-06-18 03:00YunnYiJunshnLiChunhuCui
Chinese Chemical Letters 2022年2期
Yunn Yi, Junshn Li, Chunhu Cui,b,*
a Molecular Electrochemistry Laboratory, Institute of Fundamental and Frontier Sciences, University of Electronic Science and Technology of China, Chengdu 610054, China
b Yangtza Delta Region Institute (Huzhou), University of Electronic Science and Technology of China, Huzhou 313001, China
c Department of Mechanical Engineering, National University of Singapore, Singapore 117575, Singapore
ABSTRACT The electrocatalytic methanol conversion is of importance in direct methanol fuel cell, biomass reforming, and hydrogen generation.To achieve a “carbon-neutral” target, CO2 byproducts derived from biofuels should be mitigated.In contrast to the complete oxidation of methanol to CO2, the selective oxidation of methanol to formate is a CO2-emission-free route without the generation of toxic CO intermediates.Herein, we present a highly active catalyst based on transition-metal disulfide nanosheet arrays supported on Ni foam for methanol conversion.Through composition screening, we find that the FeCoNi disulfide nanosheet exhibits a highly efficient and selective methanol-to-formate conversion.The surface reconstruction of this catalyst allows us to produce 0.66 mmol cm-2 h-1 of formate at low potential(1.40 V) with high faradaic efficiency of >98%.This work offers a substantial composition tuning strategy to construct noble-metal-free active multi-metal sites for CO2-emission-free conversion of methanol to value-added formate.
Keywords: Nanosheet Trimetallic catalyst Transition-metal sulfide Electrocatalysis Methanol oxidation Formate
Selective electrocatalysis nowadays is very crucial in the field of small molecule conversions.Driven by renewable electricity,this technique allows reducing protons and CO2to useful fuels and chemicals on which human society depends [1].On the other hand, selective electrochemical oxidation of renewable hydrocarbon resources such as methane and biofuels to vectored chemicals has not been fully established by now [2].As major biomass-derived intermediates, methanol is a widely used commodity chemical, with a large energy density (6.13 kWh/kg), next to that of hydrogen.Besides, it is cheap, abundant, renewable [3],and easy to be transported and stored [4,5].Based on these advantages, methanol has been used as a raw material or precursor for the synthesis of a few upgraded chemicals.
Formate is an essential chemical used in various fields, including chemical, printing and dyeing, agricultural and food industries[6].Furthermore, formate can be used as feedstock to obtain higher valuable formic acid under low-cost, and eco-friendly conditions[7].Methanol-to-formate conversion is a cost-effective process because the market value of formic acid/formate (>539 €/ton) is much higher than that of methanol itself (~350 €/ton) [8,9].In industry, the current technology for producing formic acid/formate is to hydrolyze the methyl formate that is pre-prepared by a combination of methanol with CO under high temperature (80 °C) and high pressure (4 MPa) [7].This route requires harsh conditions involving hazardous and flammable CO.In contrast, the electrochemical methanol oxidation reaction (MOR) is a mild and facile route,which also can couple with electrochemical hydrogen evolution reaction on cathode [8–11].
The development of an efficient and durable electrocatalyst for the MOR remains a challenge.Pt-based materials demonstrated doable catalytic activity for the MOR but the Pt sites are susceptible to CO poisoning [12–15].Besides, the high cost and scarcity of Pt limit their wide applications [16–19].In general, Pt-based catalysts could not realize selective methanol-to-formate conversion[18].Among the various noble metal-free alternatives, Ni-based materials are shown to be promising [18,20].However, monometallic Ni catalysts showed low MOR activity, while bimetallic Nibased catalysts lead to improved MOR performance in alkaline media, such as bimetallic alloys [21,22], oxides [23,24], hydroxides[10,25], carbides [26], phosphides [27] and chalcogenides [28,29].Among them, the chalcogenides-derived materials experience surface structure and composition reconstructions under anodic polarization, leading to the formation of unique metal coordinated sites[30,31].The chalcogenide-derived hydroxide surface layer with an amorphous structure shows better catalytic activity relative to the directly synthesized amorphous materials.In our previous works[32,33], we demonstrated that the charged Ni are active sites for the MOR, and the electronic structure of Ni sites can be tuned by introducing second or/and third metals [34].In chalcogenidederived hydroxides, the dynamic existence of trace sulfur species in the amorphous layer is proposed to further modify the coordination environments.However, to the best of our knowledge, it remains a major challenge to mediate Ni sites for selective methanolto-formate with tailored composition and coordinations.
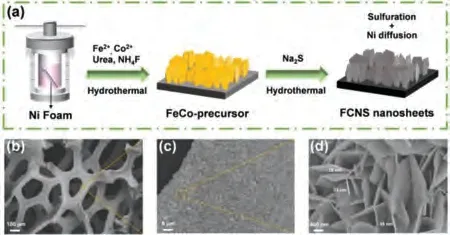
Fig.1.(a) Schematic illustration of the synthesis process of FCNS@NF.(b–d) SEM images of FCNS@NF at different scales.
Herein, we present a composition screening method to obtain a trimetallic FeCoNi disulfide nanosheet catalyst on Ni foam (FCNS@NF) that presents higher MOR activity relative to monometallic Ni disulfide and bimetallic NiFe and NiCo disulfide on Ni foam in alkaline media.By characterizing the morphology,structure, chemical state and intermediate, the origin of the improved MOR activity on FCNS@NF has been clarified.
The FCNS@NF electrode was synthesized through a facile twostep hydrothermal process, as shown in Fig.1a.To compare the MOR activity, the monometallic Ni disulfide (Ni3S2@NF), and bimetallic Fe-Ni disulfide (FNS@NF) and Co-Ni disulfide (CNS@NF)on NF were synthesized by a similar method.The details of experiments are available in supporting information.The scanning electron microscopy (SEM) images of FCNS@NF show vertically aligned nanosheet arrays on the surface of the porous NF (Figs.1b–d).The average thickness of the nanosheets is ~30 nm.The SEM images of control samples are shown in Fig.S1 (Supporting information).The FNS and CNS exhibit similar nanosheet morphology relative to FCNS@NF, which can preclude the effect of structure.The SEM-EDS mapping results indicate the uniform distribution of Fe, Co, Ni and S elements on the FCNS@NF (Fig.S2 in Supporting information).
The crystal structures of the as-prepared electrodes were initially analyzed by X-ray diffraction (XRD), as shown in Fig.2a.For all electrodes, except for the three strong peaks are belong to the metallic Ni from the NF, the diffraction peaks at 21.9°, 31.3°, 38.1°,50.2° and 55.4° are assigned to the (101), (110), (003), (113) and(122) lattice planes of Ni3S2, respectively [30,35–37].The incorporation of Fe or/and Co into Ni3S2for the formation of FNS@NF,CNS@NF and FCNS@NF leads to lattice distortion, reflected as slight shifts compared to Ni3S2@NF [35,38,39].Raman spectroscopy was performed to analyze the crystal structure of FCNS@NF (Fig.S3 in Supporting information).The six vibrational bands at 185 (Ag),195 (Eg), 216 (Eg), 299 (Eg), 321 (Ag), and 345 cm-1(Eg) are ascribed to the Ni3S2phase [30,40].The transmission electron microscopy (TEM) images further confirm the nanosheet structure for FCNS@NF (Figs.2b and c), and the corresponding high-resolution TEM (HRTEM) images show the lattice spacing of 2.38, 2.91 and 4.08, which are attributed to the (003), (110), and (101) planes of Ni3S2phase.The XRD, Raman and HRTEM (Figs.2d–f) results show the Ni3S2phase in FCNS@NF, and the incorporation of Fe or/and Co does not change the crystal phase of Ni3S2.The highangle annular dark-field scanning transmission electron microscopy(HAADF-STEM) and corresponding element mapping results show the homogeneous distribution of Fe, Co, Ni and S elements at the nanoscale in FCNS@NF (Figs.2g and h).In addition, the element ratio in Fe-Ni-Co disulfide nanosheets was analyzed by STEM energy dispersive X-ray spectrum (STEM-EDS), and it is Fe0.45Co1.08Ni1.47S2(Fig.2i).The result further confirms the Ni3S2phase, and the element ratio of (Fe + Co + Ni)/S is exactly 1.5.Note that the Ni is the dominant component although without adding any Ni precursors in the synthesis process.It is probably due to the strong etching ability of Na2S enables the leaching of Ni from NF [30].
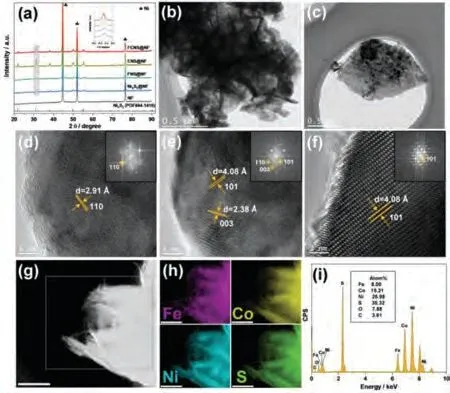
Fig.2.(a) XRD patterns of the Ni foam and as-prepared electrodes.Inset shows the specific XRD patterns of the selected region.(b, c) TEM images, (d-f) HRTEM images, (g, h) HAADF-STEM image and corresponding elements mapping, and (i)EDS spectrum of FCNS@NF.The scale bar in (g, h) is 500 nm.

Fig.3.XPS spectra of (a) Fe 2p, (b) Co 2p, (c) Ni 2p and (d) S 2p for FCNS@NF.
The surface chemical compositions of the as-prepared electrodes were determined by X-ray photoelectron spectroscopy(XPS).The XPS survey spectra for Ni3S2@NF and FCNS@NF are shown in Fig.S4a (Supporting information).The additional Fe and Co peaks for FCNS@NF further confirm the incorporation of Fe and Co into Ni3S2.The high-resolution XPS spectra of Fe 2p, Co 2p, Ni 2p and S 2p region for electrodes are shown in Fig.3 and Fig.S4 (Supporting information).The Fe 2p spectra of FNS@NF and FCNS@NF exhibit Fe 2p3/2and Fe 2p1/2peaks at 713.5 and 725.7 eV with two satellites at 718.2 and 733.4 eV (Fig.3a and Fig.S4b).The two main peaks could be deconvoluted into two doublets at 710.8,723.3 eV; and 713.7, 726.3 eV, which are assigned to Fe2+and Fe3+,respectively [41–43].Fig.3b and Fig.S4c exhibit the Co 2p spectra of CNS@NF and FCNS@NF, their Co 2p3/2and Co 2p1/2peaks were also fitted into two doublets with the characteristics of Co3+(781.6 and 797.4 eV); and Co2+(785.6 and 799.9 eV) [44–47].The results demonstrate two kinds of chemical states (Fe2+/3+and Co2+/3+)in the FCNS@NF surface.As shown in Figs.3c and 4d–f, the Ni 2p3/2and Ni 2p1/2peaks at 856.2 and 873.8 eV, with two satellite peaks, indicate the surface Ni2+species, and the small peak at 853.1 eV is attributed to metallic Ni0[30,35,48,49].The intensity of the Ni0peak in Ni3S2@NF is weaker than those of FNS@NF,CNS@NF, and FCNS@NF.We propose that the S may diffuse to a deeper layer in the absence of deposited Co and Fe.Besides, the FNS@NF, CNS@NF, and FCNS@NF present a free-standing nanosheet structure, vertically on the Ni foam surface, exposing more metallic Ni.The deconvoluted XPS spectra of S show the 2p3/2peak at 162.1 eV, and 2p1/2peak at 163.1 eV correspond to the sulfur-metal bonds, where the former peak reflects the terminal S2-, and the latter peak arises from the bridging S22-(Figs.3c and Figs.S4g–i)[40,50,51].Compared to Ni3S2@NF, the larger peak of bridging S22-in FCNS@NF indicates the strong interaction between the crossed nanosheets.In addition, the peak at 168.6 eV is contributed to the surface SO42-from partial oxidation of surface S [30,40,52].These S-derived anions should modify the coordination environments.
The electrochemical performance of the as-prepared electrodes was first evaluated by cyclic voltammetry (CV) at a scan rate of 10 mV/s in a 1.0 mol/L KOH electrolyte (Fig.S5a in Supporting information).During the forward scan, the oxidation peaks at~1.39 V can be observed on all electrodes, and these peaks are ascribed to the oxidation of surface Ni(OH)2to NiOOH in alkaline media, indicating that the surface Ni sulfide was firstly oxidized to Ni(OH)2and subsequently to NiOOH [32,53,54].The incorporation of Fe and Co into the Ni3S2increased the oxidation current density.This result suggests that the Fe and Co mediate the electronic structure and favor the formation of high valence metal sites.For the backward scan, the reduction current peak from NiOOH to Ni(OH)2appeared at ~1.29 V [33].The increased area of surface redox couples for FCNS@NF implies the abundant surface active sites.To preclude the effect of capacitive current on MOR performance (Fig.S5b in Supporting information), the MOR was evaluated by linear sweep voltammetry (LSV) at a low scan rate of 2 mV/s in a 1.0 mol/L KOH electrolyte with or without 1.0 mol/L methanol.As shown in Fig.4a, except for the oxidation current peaks, there is no appreciable current until the potential was increased to 1.50 V in 1.0 mol/L KOH solution.When adding 1.0 mol/L methanol into the 1.0 mol/L KOH solution, a sharp increase in current density was observed with an onset potential the same as that of the Ni2+/Ni3+during the anodic scan.However,other electrodes exhibited higher onset potential than those of the corresponding onset potential of redox couple.Thus, the FCNS@NF showed the lowest onset potential at 1.33 V for the MOR, indicating fast reaction kinetics (Fig.S5c in Supporting information).We exhibited the MOR activity order, with FCNS@NF>CNS@NF>FNS@NF>Ni3S2@NF.Fig.S5d (Supporting information) illustrates the comparison of the MOR and OER current density at 1.50 V.The FCNS@NF presents the highest MOR current density of 265 mA/cm2, much higher than those of CNS@NF (149 mA/cm2),FNS@NF (99 mA/cm2) and Ni3S2@NF (77 mA/cm2).The MOR current density of 100 mA/cm2was achieved at 1.53, 1.50, 1.46 and 1.42 V for Ni3S2@NF, FNS@NF, CNS@NF, and FCNS@NF, respectively.This FCNS@NF demonstrates improved MOR activity, among the state-of-the-art transition-metal-based electrocatalysts reported recently (Table S1 in Supporting information).The MOR activity tested at a higher scan rate (50 mV/s) is a little bit higher (Fig.S5e in Supporting information), meaning that the activity is somehow affected by the scan rate.In addition, the MOR activity of the FeCo precursor@NF is inferior to that of FCNS@NF (Fig.S5f in Supporting information).
The electrochemically active surface areas (ECSAs) of electrodes were calculated based on the double-layer capacitance (Cdl) from the CVs tested at different scan rate in the non-faradaic potential range (Fig.S6 in Supporting information).Fig.4b displays the current density difference (Δj/2) at the center of the scanning potential range (0.975 V) as a function of the scan rate.The slopes of their linear fitting plots multiplied by the geometric area of the working electrode (1.0 cm2) equal theCdl[41], and the results were summarized in Table S2 (Supporting information).The FCNS@NF has the largest ECSA (134.75 cm2), indicating that increased active sites for the MOR [55].Furthermore, the charge transfer is a key parameter evaluating electrocatalytic kinetics.Potentiostatic electrochemical impedance spectroscopy (PEIS) of the electrodes was tested at 1.425 V, and the corresponding Nyquist plots are shown in Fig.4c.Impedance responses were fitted using an equivalent circuit (Fig.4c, inset) consisting of a series resistance (Rs),a charge transfer resistance (Rct), and a constant phase element(CPE) [56].The fitting results suggest a faster charge transfer on FCNS@NF with a smallerRctof 1.07Ω(Table S3 in Supporting information), suggesting an enhanced electronic transport at the electrode/electrolyte interface [8,36,57].
In general, the electrochemical oxidation of methanol in alkaline solution on Ni-based catalysts proceeds with generated surface Ni3+sites.The proposed reaction mechanism is shown as follows[32,58]:
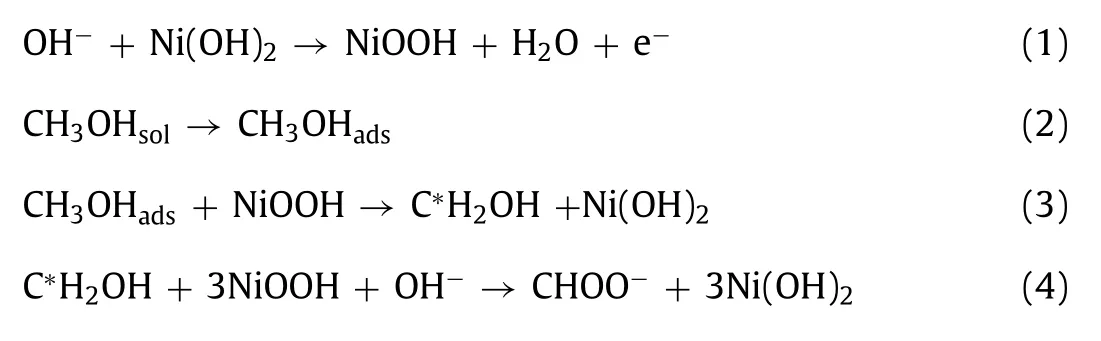
The overall reaction:

Therefore, the analysis of the redox Ni(OH)2⇌NiOOH process is shown to understand the mechanism of improved MOR activity.Fig.4d and Figs.S7a–d (Supporting information) display the CVs of the as-prepared electrodes in 1.0 mol/L KOH solution at different scan rates (10–100 mV/s).With the increase of the scan rate, the anodic/cathodic peak current (Ip) increases, the distance of coupled redox peaks increase.We show that theIpis proportional to the scan rate, the surface coverage of Ni(OH)2/NiOOH redox species (Γ*) and the proton diffusion coefficient (D) can be calculated using the previously reported methods [21,32,49,59–61].TheΓ*was calculated from the slope of the fitted line forIpvs.scan rate in low scan rate range, 10–50 mV/s (Fig.4e and Figs.S7e–h in Supporting information).TheD, as a controlled parameter for a diffusion-limited Ni(OH)2⇌NiOOH reaction, could be derived from the slope of the fitted line forIpvs.the square root of scan rate in a higher scan rate range, 60–100 mV/s (Fig.4f and Figs.S7i–l in Supporting information).The results were summarized in Table S4 (Supporting information), and the details of calculations are shown in Supporting information.TheΓ*value of FCNS@NF was estimated as 2.40 × 10⁻⁶mol/cm2, which is more than three times than that of Ni3S2@NF (7.54 × 10⁻⁷mol/cm2), and a little bit higher than that of FNS@NF (1.56 × 10⁻⁶mol/cm2) and FNS@NF(2.02 × 10⁻⁶mol/cm2).Furthermore, theDvalue of FCNS@NF is highest (3.56 × 10⁻⁶cm2/s), indicating a faster diffusion of the redox limiting species on the surface [32].These results show that FCNS@NF has favorable surface redox behaviors.

Fig.4.(a) LSVs in a 1.0 mol/L KOH solution with (solid line) and without (dotted line) 1.0 mol/L methanol at 2 mV/s.(b) Linear fitting of current density difference (Δj/2)vs. the scan rate.(c) Nyquist plots of PEIS for Ni3S2@NF, FNS@NF, CNS@NF and FCNS@NF.inset: equivalent circuit.(d) CVs in a 1.0 mol/L KOH solution at different scan rates(10–100 mV/s).(e) Linear fitting of the anodic and cathodic peak current with the scan rate in the low scan rate range (10–50 mV/s).(f) Linear fitting of the anodic and cathodic peak current densities with the square roots of the scan rate in the higher scan rate range (60–100 mV/s).(g) CVs with different cycles at 50 mV/s in the ADT.(h)CA curve at 1.40 V, inset: SEM images of the catalyst after CA test.(i) Calculated faradaic efficiency of methanol-to-formate conversion with three independent tests after 10 h CA test for FCNS@NF in a 1.0 mol/L KOH solution containing 1.0 mol/L methanol.
The CVs of FCNS@NF at 50 mV/s in 1.0 mol/L KOH solution containing 0.1 mol/L to 3.0 mol/L methanol were shown in Fig.S8a(Supporting information).Increasing the concentration of methanol increases the MOR current density, thus the oxidation peak of Ni2+to Ni3+and the MOR current peak are overlapped.Fig.S8b (Supporting information) displays the current density at 1.50 V as a function of methanol concentration.Based on the MOR reaction equation, at a lower concentration of methanol, the active Ni sites,and the interfacial OH-are adequate.At a higher concentration of methanol above 1.3 mol/L, the mass transfer of OH-is limited,which restricts the formation of active Ni sites and the oxidation of methanol [62].The linear fitting of the logarithmic dependence of the current densityvs.the methanol concentration in a low concentration range reveals an apparent methanol reaction order (RO)of FCNS@NF is approximately equal to 0.2 at 1.50 V (Fig.S8c in Supporting information), which is close to that of the (110)-faceted Ni nanoparticles (RO = 0.3) [61].
The stability of FCNS@NF was evaluated by the accelerated durability test (ADT) and chronoamperometry (CA) in a 1.0 mol/L KOH solution containing 1.0 mol/L methanol.In Fig.4g, CVs exhibited a slight increase in current density within 600 cycles, then the current density gradually decreased.The current density at 1.50 V just exhibited a 21.8% loss after 1000 cycles.CA test at 1.40 V also showed an increase in current density in the first hour, whereafter the current density dropped slowly and still remained 56.2%of its initial value after 10 h (Fig.4h).At the beginning, the surface of FeCoNi disulfide nanosheets transformed into highly active metal oxyhydroxides under the MOR.Thus, the initial increase in current density during the ADT and CA test is likely due to this surface reconstruction.SEM insets in Fig.4h imply that the morphology and size of the nanosheet remained unchanged after the long-term MOR (10 h CA at 1.40 V).The analysis of MOR products was performed on an ion chromatography (IC) after the CA test.IC profiles of three independence measurements were shown in Fig.S9a (Supporting information), the dominant peaks at 5.15 min belong to HCOO-[32,63].Faradaic efficiency of the methanol-toformate was calculated to 98.08% by averaging the results of the three measurements (Fig.4i).After the test, the product of formate is 6.62 mmol through the injection of 2600 C of charge, with a yield of 0.66 mmol cm-2h-1.
To further understand the origin of the superior MOR activity,the transformation of crystal structure and surface chemical composition for FCNS@NF after the MOR process were analyzed by Raman and XPS.The Raman spectrum of the post-FCNS@NF was shown in Fig.S10 (Supporting information), the vibrational bands of Ni3S2are weak, implying the hydroxylation of Ni3S2during the MOR.The two intense bands at 476 and 553 cm-1are ascribed to the Eg(Metal-O) bending vibration mode and A1g(metal-O)stretching vibration mode, indicating the generation of -OOH on the catalyst surface [64–66].The XPS spectra of FCNS@NF after the MOR as shown in Fig.S11 (Supporting information).The Fe 2p spectrum of post-FCNS@NF shows a similar chemical state to that of the initial one, and the intensity of the peaks decreased due to the leaching of Fe element during the MOR (Fig.S11a).The Co 2p spectra show an increased Co3+/Co2+ratio in the surface layer, indicating the partial oxidation of Co2+to Co3+(Fig.S11b).Concerning the Ni 2p spectra (Fig.S11c), the increased intensity of Ni3+relative to Ni2+implies a highly increased concentration of Ni3+species.These results verify that the incorporation of Co and Fe into Ni3S2favors the formation of active Ni3+.There no clear S 2p peak can be observed after the MOR owing to the S leaching under anodic polarization, suggesting that the surface metal disulfide was converted into metal oxyhydroxides (Fig.S11d) [45,67].For the O 1s spectra, the increase of surface hydroxyl further confirms the formation of metal oxyhydroxides after the MOR (Fig.S11e) [44].These Raman and XPS results demonstrate that the FeCoNi disulfide was transformed to metal oxyhydroxides, Ni(FeCo)OOH, during the MOR, and then the reconstructed Ni(FeCo)OOH triggered the highly effective and selective methanol-to-formate conversion.
In summary, we demonstrated an electrochemical reconstruction of trimetallic FeCoNi disulfide to Ni(FeCo)OOH, where the concentration of active Ni3+was highly improved owing to the incorporation of Fe and Co, and the interplay between metals andin situformed FeCoNi disulfide/Ni(FeCo)OOH interfaces.The developed FCNS@NF achieved a current density of 265 mA/cm2for the MOR at 1.50 V in a 1.0 mol/L KOH electrolyte containing 1.0 mol/L methanol, and it can produce 0.66 mmol cm-2h-1of formate at 1.40 V with a high faradaic efficiency above 98%.This low-cost and easily available noble-metal-free MOR catalyst enables a highly efficient and CO2-emission-free methanol-to-formate conversion,providing a promising approach to convert biomass into valueadded chemicals on a large scale under environmental-friendly condition.
Declaration of competing interest
The authors report no declarations of interest.
Acknowledgments
C.Cui acknowledges the support from the Recruitment Program of Thousand Youth Talents.Y.Yi acknowledges the support from the program of China Scholarships Council (No.202006070158).J.Li obtained International Postdoctoral Exchange Fellowship Program (Talent-Introduction Program, No.YJ20190126) in 2019 and is grateful for the project (No.2019M663468) funded by the China Postdoctoral Science Foundation.
Supplementary materials
Supplementary material associated with this article can be found, in the online version, at doi:10.1016/j.cclet.2021.07.005.
 Chinese Chemical Letters2022年2期
- Chinese Chemical Letters的其它文章
- Comment on “Acid-induced tunable white light emission based on triphenylamine derivatives”
- Strategies for efficient photothermal therapy at mild temperatures:Progresses and challenges
- Liposome-based delivery of biological drugs
- Macrophage-targeted nanomedicine for chronic diseases immunotherapy
- Advances, opportunities, and challenge for full-color emissive carbon dots
- Fluorine-containing agrochemicals in the last decade and approaches for fluorine incorporation