
Tuning the shell thickness of core-shell α-Fe2O3@SiO2 nanoparticles to promote microwave absorption
2022-06-18 03:00HonghongFuYueGuoJinYuZhenShenJieZhoYuXieYunLingShengOuyngShiqiLiWeiZhng
Chinese Chemical Letters 2022年2期
Honghong Fu, Yue Guo, Jin Yu, Zhen Shen, Jie Zho,,*, Yu Xie, Yun Ling,Sheng Ouyng, Shiqi Li, Wei Zhng
a Department of Materials Chemistry, School of Environment and Chemical Engineering, Nanchang Hangkong University, Nanchang 330063, China
b Instrumental Analysis Center of Nanchang Hangkong University, Nanchang 330063, China
c School of Chemistry and Chemical Engineering, Nanjing University, Nanjing 210023, China
d Research Institute of Aero-Engine, Beihang University, Beijing 100191, China
e School of Ecology and Environment, Zhengzhou University, Zhengzhou 450001, China
ABSTRACT Various advanced microwave absorbing materials have been developed for reducing/avoiding the harm of microwave radiation.Among them, core-shell structural nanomaterials have been widely fabricated for microwave absorption.However, the “structure-performance” relationship between shell thickness and microwave absorption performance is rarely reported.In this paper, we first explored the “structureperformance” relationship between shell thickness and microwave absorption performance, based on the core-shell α-Fe2O3@SiO2 nanoparticles with a constant α-Fe2O3-core size and changeable SiO2-shell thickness.With increasing the SiO2-shell thickness, the microwave absorption ability first increased, then decreased.Under a proper SiO2-shell thickness of 35 nm, α-Fe2O3@SiO2 sample achieved the strongest microwave absorbing ability with a reflection loss minimum value of –4.3 dB, better than that of pure α-Fe2O3 (–3.8 dB).This enhanced microwave absorption performance was mainly derived from the dielectric loss.Although the absolute value of the reflection loss was relatively low (–4.3 dB), this study shed an important reference on designing next-generation advanced iron oxide-based materials for microwave absorption.
Keywords:α-Fe2O3@SiO2 Core-shell structure Microwave absorption Dielectric loss Interfacial polarization Conductivity loss
With more and more electronic products into life, the microwave radiation generated by electronic devices has caused harm to human health and the environment.In order to reduce/avoid the harm of microwave radiation, intensive efforts have been made to develop advanced microwave absorbing materials [1-5].At present,the widely used microwave absorbing materials are mainly divided into ferrites (Fe3O4,α-Fe2O3and BaFe12O19,etc.) [6-8], magnetic metals (Ni, Co,α-Fe) [9-11], non-iron-based metal oxides (TiO2,NiO, CaBiNb2O4, ZnO and MoS2,etc.) [12-16], carbon-based materials (graphene, carbon nanotube and porous carbon,etc.) [17-20],polymers (polyaniline, polypyrrole, and polythiophene,etc.) [21-23], and other composites [24-31].Among them, ferrites have attracted extensive interest owing to their abundant resources, low cost, and good absorption performance [32,33].
Usually, ferrites have three structures,i.e., Fe3O4,γ-Fe2O3andα-Fe2O3.Among them, Fe3O4andγ-Fe2O3belong to ferromagnetic materials, which have large saturation magnetization and high relative complex permeability suiting for microwave absorption.However, these two ferrites are easy to oxidization and agglomerate, leading to poor microwave absorption performance[2,34].By contrast,α-Fe2O3provides more options for the microwave absorber design due to its stable chemical properties,environment-friendly feature, and controllable morphology.
Various morphologies ofα-Fe2O3have been widely reported,such as microspheres, microcubes, nanoparticles, and nanorods[35-42].Coating an insulating layer onα-Fe2O3particle surface is an effective strategy to adjust the particle-particle distance, enhance the anti-oxidation capability, reduce the density of particles,and improve the impedance matching between particles and free space.As a surface modification material, SiO2is an ideal candidate due to its excellent chemical stability, nontoxicity, and easy conjugation with various functional groups.Various structures withα-Fe2O3as the core and SiO2as the shell have been fabricated for microwave absorption, such as core-shell structure, and yolkshell structure [43-46].However, the “structure-performance” relationship between shell thickness and microwave absorption performance is rarely reported.
Herein, we have synthesized the core-shell structuralα-Fe2O3@SiO2nanoparticles with a constant core size and changeable shell thickness to explore the “structure-performance”relationship between shell thickness and microwave absorption performance.The dependence of shell thickness on microwave absorption performance and the corresponding mechanisms were revealed and explained, respectively.The results indicated thatα-Fe2O3@SiO2of 35 nm shell-thickness presented a significant enhancement of absorption performance compared with that of pureα-Fe2O3.Although the absolute value of the reflection loss was relatively low (–4.3 dB), this study has shed an important reference on the design of next-generation advanced iron oxidebased materials for excellent microwave absorption by tuning the shell-thickness.Meanwhile, based on the “structure-performance”relationship between shell-thickness and microwave absorption performance, the Fe@SiO2,γ-Fe2O3@SiO2, Fe3O4@SiO2, and FeNx@SiO2with excellent absorption performance will also be fabricated/developed from the core-shell structuralα-Fe2O3@SiO2nanoparticles by phase conversion ofα-Fe2O3through heat treatment.
The core-shell structuralα-Fe2O3@SiO2nanoparticles were synthesized through the Stöber method (Fig.S1 in Supporting information) [47,48].By controlling the mass of tetraethyl orthosilicate(TEOS) during this reaction, the shell-thickness of SiO2was finely regulated in the range of 0-190 nm (Fig.1).Pureα-Fe2O3cores present a uniformly dispersed size with 50 ± 10 nm (Figs.1a and b, Fig.S2 in Supporting information).The lattice space of 0.27 nm corresponds to the (104) lattice plane ofα-Fe2O3(Fig.1b).With increasing the mass of TEOS from 30 to 2000 mg, the shellthickness of SiO2increases from 6 ± 2 nm to more than 190 nm (Figs.1a-t).Specifically, when the TEOS mass is less than 200 mg, theα-Fe2O3@SiO2nanoparticles are granular (Figs.1c-j).Then with increasing TEOS from 200 to 500 mg, the morphology ofα-Fe2O3@SiO2tends to be a sphere with a single core (Figs.1k-n).And further increasing TEOS mass to 2000 mg, the agglomeration ofα-Fe2O3cores would be induced inα-Fe2O3@SiO2particles(Figs.1o-t, Fig.S3 in Supporting information).Based on the relationship between shell-thickness and TEOS mass, we can infer the shell growth rate is 0.091 nm/mg(TEOS),i.e., each 1 mg TEOS can increase the shell-thickness by 0.091 nm (Fig.S4 in Supporting information).This SiO2shell growth rate maybe provides an important data reference for the fine synthesis of other core-shell structural M@SiO2(M = metal oxides, metal particles, carbon materials,etc.)nanomaterials.
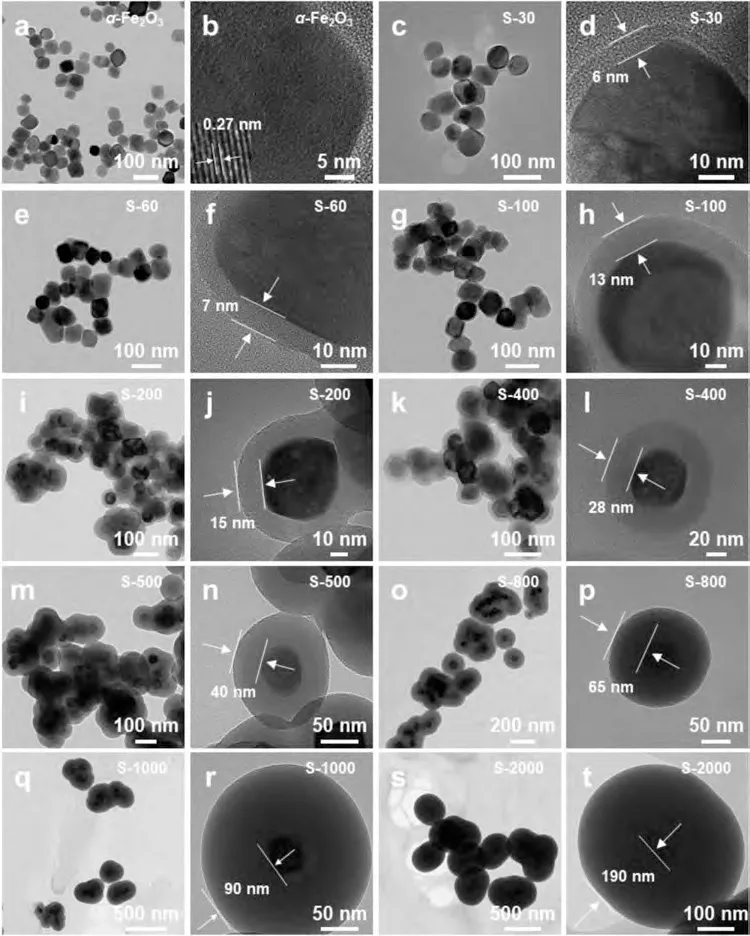
Fig.1.Regulation of shell-thickness in core-shell structural α-Fe2O3@SiO2 nanoparticles: (a, b) α-Fe2O3, (c, d) S-30, (e, f) S-60, (g, h) S-100, (i, j) S-200, (k, l) S-400, (m, n)S-500, (o, p) S-800, (q, r) S-1000, (s, t) S-2000.
Typically, the structure and components ofα-Fe2O3, S-30, S-500, and S-1000 were characterized in detail (Fig.2).Pristineα-Fe2O3nanoparticle presents a series of X-ray diffraction (XRD)peaks at 24.1°, 33.1°, 35.6°, 40.9°, 49.5°, 54.09°, 57.59°, 62.45°,63.99°, 71.94°, and 75.43°, corresponding to the (012), (104), (110),(113), (024), (116), (018), (214), (300), and (1010) lattice planes(JCPDS No.33-0664) (Fig.2a).These sharp and strong diffraction peaks indicate that the pristineα-Fe2O3nanoparticles have high crystallinity and purity.When the added mass of TEOS was less than 500 mg, the as-prepared samples,i.e., S-30 and S-500, exhibit similar diffraction peaks with pristineα-Fe2O3, and no obvious SiO2characteristic peak appeared due to the amorphous form of SiO2shell.When the TEOS mass was 1000 mg, the amorphous SiO2characteristic peak around 20°~30° began to appear in the corresponding sample,i.e., S-1000.The existence of SiO2in S-500 and S-30 samples could be confirmed by Fourier transform infrared spectroscopy (FT-IR), X-ray photoelectron spectroscopy (XPS), and elemental mappings (Figs.2b-j, Fig.S5 in Supporting information).For the S-500 sample, FT-IR absorption peaks at 1097, 949, and 789 cm–1were caused by Si-O-Si, Si-OH, and Si-O vibrations from the SiO2shell (Fig.S5 in Supporting information).After coating of the SiO2shell, Fe 2p and Fe 3p peaks in XPS full spectra almost disappeared, but Si 2p and Si 2s appeared (Figs.2b and c).Compared with pristineα-Fe2O3, the Fe 2p3/2, and Fe 2p1/3peaks of S-500 all shifted to higher binding energy byca.0.4 eV in XPS fine spectra,confirming the interaction betweenα-Fe2O3core and SiO2shell(Fig.2d).These results indicate the presence of SiO2-shell layers in S-500 [49,50].In order to further visually observe the core-shell structure, the S-30 sample with thin SiO2layers was selected for elemental mapping characterization (Figs.2e-j).Element mappings demonstrated that the outer shell layers were dominated by Si and O, and the inter cores by Fe and O (Figs.2f-j).
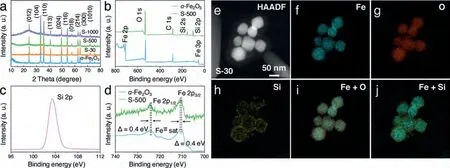
Fig.2.Structure and components characterization.(a) XRD patterns.(b) XPS full spectra.(c,d) XPS fine spectra of Si 2p and Fe 2p.(e) High-angle annular dark-field (HAADF)image.(f-j) Elemental mappings of Fe, O, Si, Fe + O, and Fe + Si.
The static magnetic properties of as-preparedα-Fe2O3@SiO2nanoparticles were measured using a vibrating sample magnetometer (VSM).For pureα-Fe2O3, it does not reach saturation magnetization even under a very high applied magnetic field of–80~80 kOe, suggesting its weak ferromagnetic behavior [35,37,51](Fig.S6 in Supporting information).Therefore, theα-Fe2O3@SiO2samples also do not reach saturation magnetization, and only possess narrow hysteresis features (Fig.S7 in Supporting information).Among them, the S-500 sample has a maximum area indicating higher hysteresis loss of energy.The detailed remanent magnetization (Mr) and coercivity(Hc) values of these samples were summarized in Table S1 (Supporting information).With increasing SiO2-shell thickness,MrandHcfirst increase and then decrease.TheMrvalue increases from 0.030 emu/g (for pureα-Fe2O3) to 0.045 emu/g (for S-500), then decreases to 0.022 emu/g (for S-1000).Similarly, theHcvalue increases from 71 Oe to 1100 Oe, then decreases to 458 Oe (Table S1).The first increment resulted from the internal stress on the core generated by the shell, which hindered the rotation of the magnetic domain during the magnetization process [7,52].The subsequent decline was attributed to the fact that quite large amount of non-magnetic SiO2shell layer reduced the content ofα-Fe2O3core.Besides, whether the agglomeration ofα-Fe2O3cores in single particles leads to the deterioration ofHcstill needs further study (Fig.S7 in Supporting information).
For microwave absorbing materials, the electromagnetic parameters,i.e., relative complex permittivity (ɛr=ɛr′ +ɛr′′) and relative complex permeability (μr=μr′+μr′′), directly influence their microwave absorbing performances.The real parts (ɛr′ andμr′) represent the storage capability of electric and magnetic energy, and the imaginary parts (ɛr′′ andμr′′) represent the loss ability of electric and magnetic energy [21,53].Specifically, with increasing thickness of the SiO2shell, theɛr′ values of these four samples gradually decreased fromca.5.7 toca.3.5, in the order ofα-Fe2O3>S-30>S-500>S-1000 (Fig.3a).Finally, theɛr′value of S-1000 was close to that of bulk SiO2(ca.4.0), due to the ~90 nm thick insulating layer of SiO2[54].However, with the increase of SiO2-shell thickness, theɛr′′ values first increased and then decreased (Fig.3b).The corresponding dielectric loss tangent(tanδɛ=ɛr′′/ɛr′) values also presented a similar evolution, from 0.02 (α-Fe2O3) to 0.08 (S-500), then to 0.06 (S-1000) (Fig.3c).The evolutions ofɛr′ and tanδɛmay be due to the influence of SiO2-shell thicknesses, which was explained in the section for relationships of “structure-performance”.For relative complex permeability, with increasing the SiO2-shell thickness, theμr′values in these four samples ranged from 0.99 to 1.13 (Fig.3d), and theμr′′values presented a gradually decreasing trend from 0.08 to 0.02 (Fig.3e).The corresponding magnetic loss tangent (tanδμ=μr′′/μr′) values gradually decreased from 0.08 (α-Fe2O3) to 0.02 (S-1000), indicating the decrease of magnetic loss capability (Fig.3f).Compared with the electromagnetic parameters,i.e., relative complex permittivity and relative complex permeability, the values ofɛr′,ɛr′′ and tanδɛwere all higher than those ofμr′,μr′′and tanδμ.This result indicated that the contributions of dielectric loss were more than that of magnetic loss in the microwave absorption process.
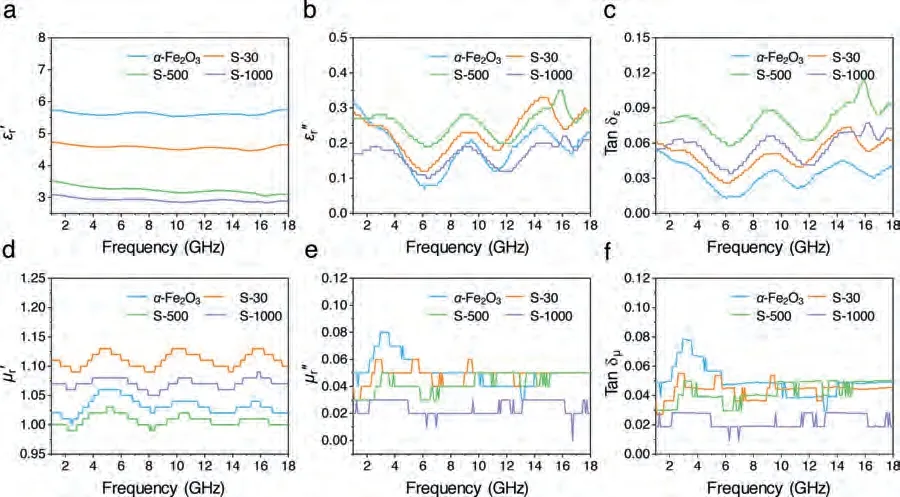
Fig.3.Electromagnetic parameters: (a) ɛr′, (b) ɛr′′, (c) tan ɛɛ, (d) ɛr′, (e) μr′′, (f) tan δμ.
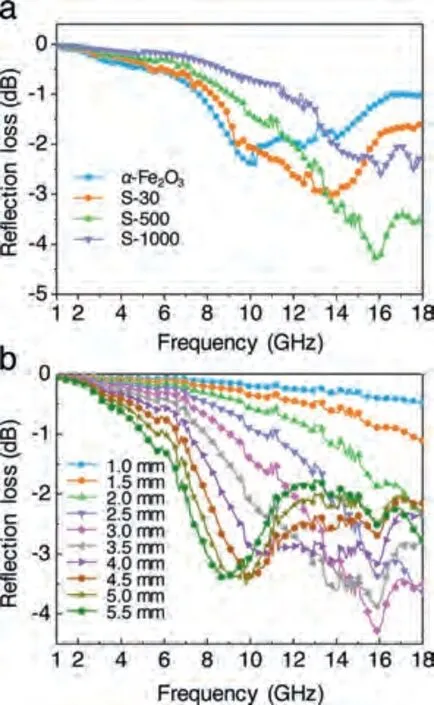
Fig.4.Microwave absorption performances.(a) RL curves of α-Fe2O3, S-30, S-500,and S-1000 under d of 3.0 mm.(b) RL curves of S-500 with different d in the range of 1.0~5.5 mm.
In general, the dielectric loss of material stems from conduction loss and polarization loss (e.g.ionic polarization, electric polarization, dipolar polarization, and interfacial polarization) [55,56].In our case, the ionic polarization and electron polarization would be excluded, because they generally exist in a much higher frequency region (103~106 GHz) [54].Wave-like shapes of the curves were a typical behavior of dielectric relaxation (Figs.3a-c), which was responsible for intrinsic dipolar polarization of the core structure [55,57].Generally, the insulator SiO2possesses lower conductivity than that of the semiconductorα-Fe2O3.With the increase of SiO2content, the reduced conductivity ofα-Fe2O3@SiO2led to the degradation ofɛr′ (Fig.3a).According to the equation (ɛr′′ ≈σ/(2πɛ0f), whereσis the conductivity,ε0is the permittivity in the free space, andfis the frequency), theɛr′′ theoretically should also decrease with the reduced conductivity [3,34].However, theɛr′′ of core-shell structuralα-Fe2O3@SiO2nanoparticles (S-30 and S-500)was higher than that of pureα-Fe2O3(Fig.3b).The phenomena may be possibly attributed to the compensation effect from the interfacial polarization, which originates from the charge buildup around the core-shell interface [7,53,55].Therefore, the variations feature of dielectric loss ofα-Fe2O3@SiO2samples came from the dipolar polarization of the core structure, decrease of overall conductivity, and introduction of interfacial polarization.
Microwave absorption performances ofα-Fe2O3@SiO2nanoparticles can be evaluated by the reflection loss (RL), which is derived from the following formulas [58,59].

whereZ0is the characteristic impedance of free space,Zinis the input impedance of the microwave absorber,dis the thickness of the absorber,cis the speed of light, andfis the frequency of the microwave.Using the measured electromagnetic parameters in Fig.3, theRLof core-shell structuralα-Fe2O3@SiO2nanoparticles with different shell thicknesses can be calculated from formulas 1and 2.
To more clearly reflect the influence of SiO2-shell thickness,theRLofα-Fe2O3@SiO2nanoparticles with fixedd(sample thickness) of 3.0 mm were evaluated in Fig.4a.With increasing the SiO2-shell thickness, the minimum value ofRLfirst decreased and then increased (Fig.4a).S-500 sample possessed the strongest microwave absorption with the lowestRLvalue of –4.3 dB.Thus, the microwave absorption performance ofα-Fe2O3@SiO2would be enhanced under proper SiO2-shell thickness.Fig.4b shows the performances of S-500 under different d of 1.0~5.5 mm.Asdwas in the range of 1.0~2.0 mm, theRLdecreased monotonously with the increase of frequency from 1~18 GHz.In the range of 2.5~5.5 mm,each curve presented a sharp or broad peak.Asdwas 3.0 mm, theRLachieved the minimum value of –4.3 dB at 16 GHz, which was superior to that of pureα-Fe2O3(Fig.4b and Fig.S8 in Supporting information).Additionally, it is interesting to note that most of the strong peaks were constrained in 6~11 and 13~17 GHz.This phenomenon may be generated from the wave character of dielectric loss (Figs.3b, c and 4b).
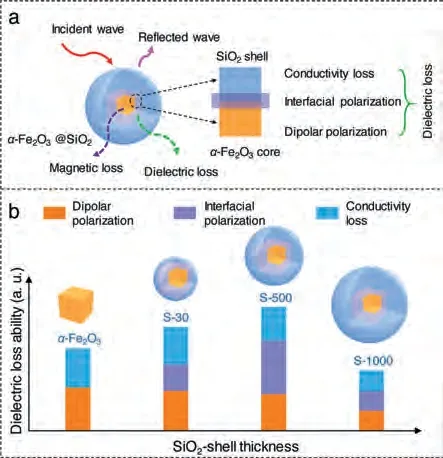
Fig.5.The “structure-performance” relationships.(a) Schematic of the possible microwave absorbing mechanism.(b) The evolution of the dielectric loss ability with the increase of SiO2-shell thickness.
Fig.5 illustrates the analysis of “structure-performance” relationships in the core-shell structuralα-Fe2O3@SiO2nanoparticles.Based above results, the microwave absorption performances for theα-Fe2O3@SiO2nanoparticles mainly come from the dielectric loss rather than the magnetic loss.The evolution of dielectric loss is mainly influenced by three factors: dipolar polarization of theα-Fe2O3core, interfacial polarization betweenα-Fe2O3core and SiO2shell, and conductivity loss from theα-Fe2O3core (Fig.5a).The former factor may lead to the wave-like shapes of curvesɛ′,ɛr′′ and tanδɛ, and the others will be conducive for the microwave absorption enhancement.Therefore, the microwave absorption performance ofα-Fe2O3@SiO2can be adjusted by tuning the SiO2-shell thickness, and achieve the best under a proper SiO2-shell thickness (Fig.5b).
Specifically, for the pureα-Fe2O3nanoparticle, there are dipolar polarization and conductivity loss contributing to the dielectric loss.Although the dipolar polarization interaction and conductivity loss slightly decrease with the slight increase of the SiO2-shell thickness, the appearances of interfacial polarization lead to an enhancement of the overall dielectric loss ability,e.g., the case of S-30(Fig.5b).With the continuous increase of the SiO2-shell thickness,e.g., the case from S-30 to S-500, the contributions of both dipolar polarization and conductivity loss all gradually decrease.But the interfacial polarization continuously increases so that the dielectric loss ability reaches the optimum level at a proper SiO2-shell thickness,i.e., in the case of S-500 (Fig.5b).Further increasing the thickness of SiO2shells,e.g., the case from S-500 to S-1000, the dipolar polarization, interfacial polarization, and conductivity loss all gradually decrease to the minimum,e.g., the case of S-1000.It is due to the mismatched thickness of SiO2insulation layers resulting in that the overall dielectric loss ability presents a decreased trend and unlimitedly approaches to that of pure SiO2nanoparticles (Fig.5b) [54].Therefore, at the proper SiO2-shell thickness of 35 nm, the S-500 sample achieved the strongest microwave absorbing ability.
In summary, we have synthesized the core-shell structuralα-Fe2O3@SiO2nanoparticles with a constantα-Fe2O3-core size and changeable SiO2-shell thickness to explore the “structureperformance” relationship between shell thickness and microwave absorption performance.The shell thickness increases nearly linearly as the TEOS addition increases, with a slope of about 0.091 nm/mg(TEOS).There is a strong “structure-performance” dependence between microwave absorption performance and SiO2-shell thickness.With increasing the SiO2-shell thickness, the microwave absorption ability first increase and then decrease.This indicates that the microwave absorption performance ofα-Fe2O3@SiO2can be enhanced under proper SiO2-shell thickness.With a proper SiO2-shell thickness of 35 nm, the S-500 sample achieved the strongest microwave absorbing ability with a minimumRLvalue of –4.3 dB under a sample thickness of 3 mm, higher than that of pureα-Fe2O3(–3.8 dB with 2.5 mm).This enhanced microwave absorption performance is mainly derived from dielectric loss including conductivity loss, interfacial polarization, and dipolar polarization.Although the absolute value of the reflection loss was relatively low (–4.3 dB), this study shed an important reference on designing next-generation advanced iron oxide-based materials for microwave absorption by tuning the shell thickness.Meanwhile, based on the “structure-performance” relationship between SiO2-shell thickness and microwave absorption performance, the M@SiO2(M = Fe,γ-Fe2O3, Fe3O4and FeNx) with excellent absorption performance will also be fabricated/developed from the coreshell structuralα-Fe2O3@SiO2nanoparticles by phase conversion ofα-Fe2O3through heat treatment.
Declaration of competing interest
The authors declare no conflict of interest.
Acknowledgments
This work was financially supported by the National Natural Science Foundation of China (Nos.21667019, 22066017, 52001156,and 52000163), the Key Project of the Natural Science Foundation of Jiangxi Province (No.20171ACB20016), the Jiangxi Province Major Academic and Technical Leaders Cultivating Object Program (No.20172BCB22014), the Science and Technology Department of Jiangxi Province (Nos.20181BCB18003, 20181BAB216012,20181ACG70025, CK202002473, and 20192BAB216003), the Key Laboratory of Photochemical Conversion and Optoelectronic Materials, TIPC, CSA (No.PCOM201906), and the Key Project of Science and Technology Research of the Jiangxi Provincial Department of Education (Nos.DA201602063, GJJ191044), the Aviation Science Foundation of China (No.2017ZF56020) and the Program B for Outstanding Ph.D.Candidate of Nanjing University(No.202002B076), and the Natural Science Foundation of Henan Province (No.202300410423).
Supplementary materials
Supplementary material associated with this article can be found, in the online version, at doi:10.1016/j.cclet.2021.07.027.
 Chinese Chemical Letters2022年2期
- Chinese Chemical Letters的其它文章
- Comment on “Acid-induced tunable white light emission based on triphenylamine derivatives”
- Strategies for efficient photothermal therapy at mild temperatures:Progresses and challenges
- Liposome-based delivery of biological drugs
- Macrophage-targeted nanomedicine for chronic diseases immunotherapy
- Advances, opportunities, and challenge for full-color emissive carbon dots
- Fluorine-containing agrochemicals in the last decade and approaches for fluorine incorporation