Investigation on the Resistance of Planing Hulls Based on a New Mathematical Model
,-,,,-
(State Key Laboratory of Ocean Engineering,School of Naval Architecture,Ocean and Civil Engineering,Shanghai Jiao Tong University,Shanghai 200240,China)
Abstract: When a planing craft is advancing at high speed, obvious sinkage and trim angle changes will occur due to the imbalance of dynamic pressure distribution.The resistance of the planing hull al⁃so changes with the running attitude.To investigate the resistance variation,a new mathematical model based on the Morabito pressure distribution formulas is proposed to estimate the attitude and resis⁃tance of planing hulls advancing in calm water. The reliability of the present method is validated by comparison with the experimental data.The effect of speed,deadrise angle,and trim angle on the longi⁃tudinal pressure distribution of the centerline is investigated by the new method.Moreover,Savitsky’s method and CFD method are adopted to compute the attitude, resistance, lift force and wake flow dis⁃tribution aft of the transom stern of the planing craft at different speeds. The comparison of results shows that the results of the present method are in good agreement with the experimental results and the simulation results of the CFD method.The proposed method has a higher accuracy than Savitsky’s method.
Key words:planing hull;pressure distribution;parametric effect;Savitsky’s method;CFD method;resistance
0 Introduction
High-speed planing crafts have been widely utilized due to high speed and excellent hydrody⁃namic performance[1]. When a planing craft is advancing at high speed, the pressure distribution on the bottom is closely related to the running attitude and resistance in calm water. Accurate predic⁃tion of the pressure distribution is significantly important for investigating the resistance perfor⁃mance of the planing hull.
Smiley[2]carried out the model test of planing hull to study the pressure distribution and he pro⁃posed an empirical formula for computing the maximum pressure at the root of the stagnation.Kapryan and Boyd[3]systematically investigated the pressure distribution of the planing craft with a trim angle ranging from 4° to 30°. They analyzed the effect of the trim angle, deadrise angle, and wetted length on the pressure distribution. Savitsky[4]performed a series of model tests on prismatic hulls to study the hydrodynamic characteristics, and developed semi-empirical formulas to predict the resistance of planing hulls. Fridsma[5]performed the model tests of prismatic planing hull in calm water and waves,and studied the effects of the length-beam ratio,deadrise angle and trim an⁃gle on the resistance. Morabito[6]proposed a mathematical model for evaluating the pressure distri⁃bution on the bottom of the planing boat.Ghadimi et al[7]introduced a mathematical model to obtain the three-dimensional pressure distributions on the planing hulls based on Morabito’s model.
The computational fluid dynamics (CFD) method based on RANS equations is powerful and has been widely used for simulating motions of planing crafts in calm water. Bakhtiari et al[8]pre⁃sented the results of steady simulations of the flow around a stepped planing hull in calm water.Wake profiles obtained by CFD method were compared with those computed by Savitsky’s empiri⁃cal equations at different speeds. Khazaee et al[9]studied the hydrodynamic performance of a plan⁃ing hull using CFD method and Savitsky’s method. Wang et al[10]performed simulations of wavemaking, navigation attitudes and hydrodynamic characteristics of a planing hull from the displace⁃ment mode and the transition to the planing mode by CFD method with overset grid technology.They found that the accurate attitudes, wave-making and spray of the planing hull can be obtained in detail from CFD simulations.
In this paper, a new mathematical model based on the pressure distribution is developed to compute the resistance and attitude of planing hulls in calm water. The total resistance, wetted length, sinkage, trim angle, lift force and wake flow obtained by the present method are compared with the available experimental data by Savitsky’s method, and CFD method over a wide range of Froude numbers.The contents in this paper are arranged as follows:Savitsky’s method is described in Chapter 1. Then the Morabito pressure distribution formulas and computational processes of the new mathematical model and CFD method are introduced in Chapter 2. The validation is carried out with experimental data and results obtained by Savitsky’s formula in Chapter 3.Then the influ⁃ences of parameters on pressure distribution are studied in Chapter 4. The systematic analyses and comparisons of results by different methods are presented in Chapter 5.Finally, the main conclu⁃sions obtained from this study are summarized in Chapter 6.
1 Savitsky’s method
Savitsky[4]developed empirical equations to determine the lift force of the planing hull based on a series of prismatic hull form model tests. For the implementations of Savitsky’s method, Ref.[11]by Faltinsen can be referred to. It is noted that in the present study, the whisker spray effect on the total resistance has been taken into consideration.

whereλwis the aspect ratio,Bis the breadth of the hull,CVis the Froude number based on breadth,βis the deadrise angle,CLβis the lift coefficient when the deadrise angle is equal toβ,CL0repre⁃sents the lift coefficient when the deadrise angle is equal to zero.τdegis the dynamic trim angle. An iterative solution to solve the above equations is carried out to obtain the value ofλw,CLβandτdeg.
The total resistance of the planing hull is given as follows:

2 Mathematical formulas
2.1 Longitudinal centerline pressure distribution
The spray occurs when a planing hull advances with high speed in calm water.The main spray occurs near the intersection of the chine with the spray root.And the whisker spray is a thin sheet of spray at the spray root line.The maximum pressure on the planing hull occurs at the stagnation line.Smiley[2]proposed an empirical equation for computing the maximum pressure along the spray root line:

wherePMAXrepresents the maximum pressure,Vis the speed of the planing hull,τdenotes the trim angle,andβdenotes the deadrise angle.
Savitsky and Morabito[13]presented equations to obtain the stagnation pres⁃sure by swept wing analogy. The planar representation of the velocity compo⁃nents is plotted in Fig.1,and the veloci⁃ty is divided along the stagnation line and normal to the stagnation line.
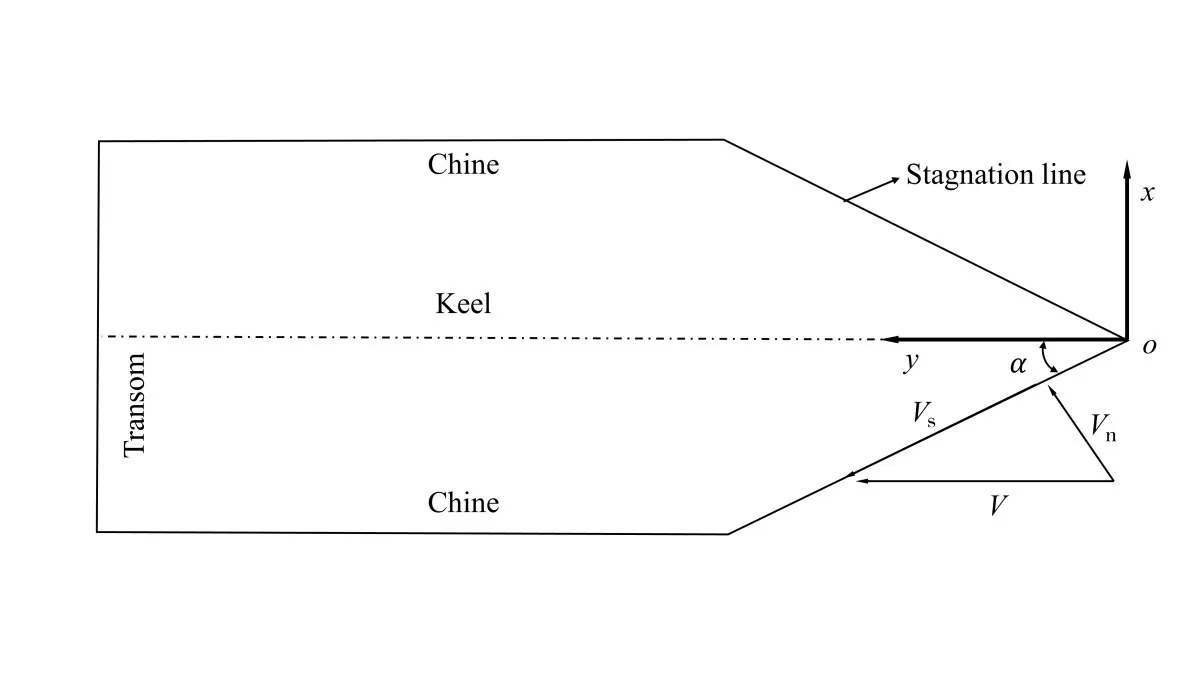
Fig.1 Velocity components of a planing hull

By expanding equations,it can be found that the equations proposed by Savitsky and Morabito are consistent with the empirical equation developed by Smiley.

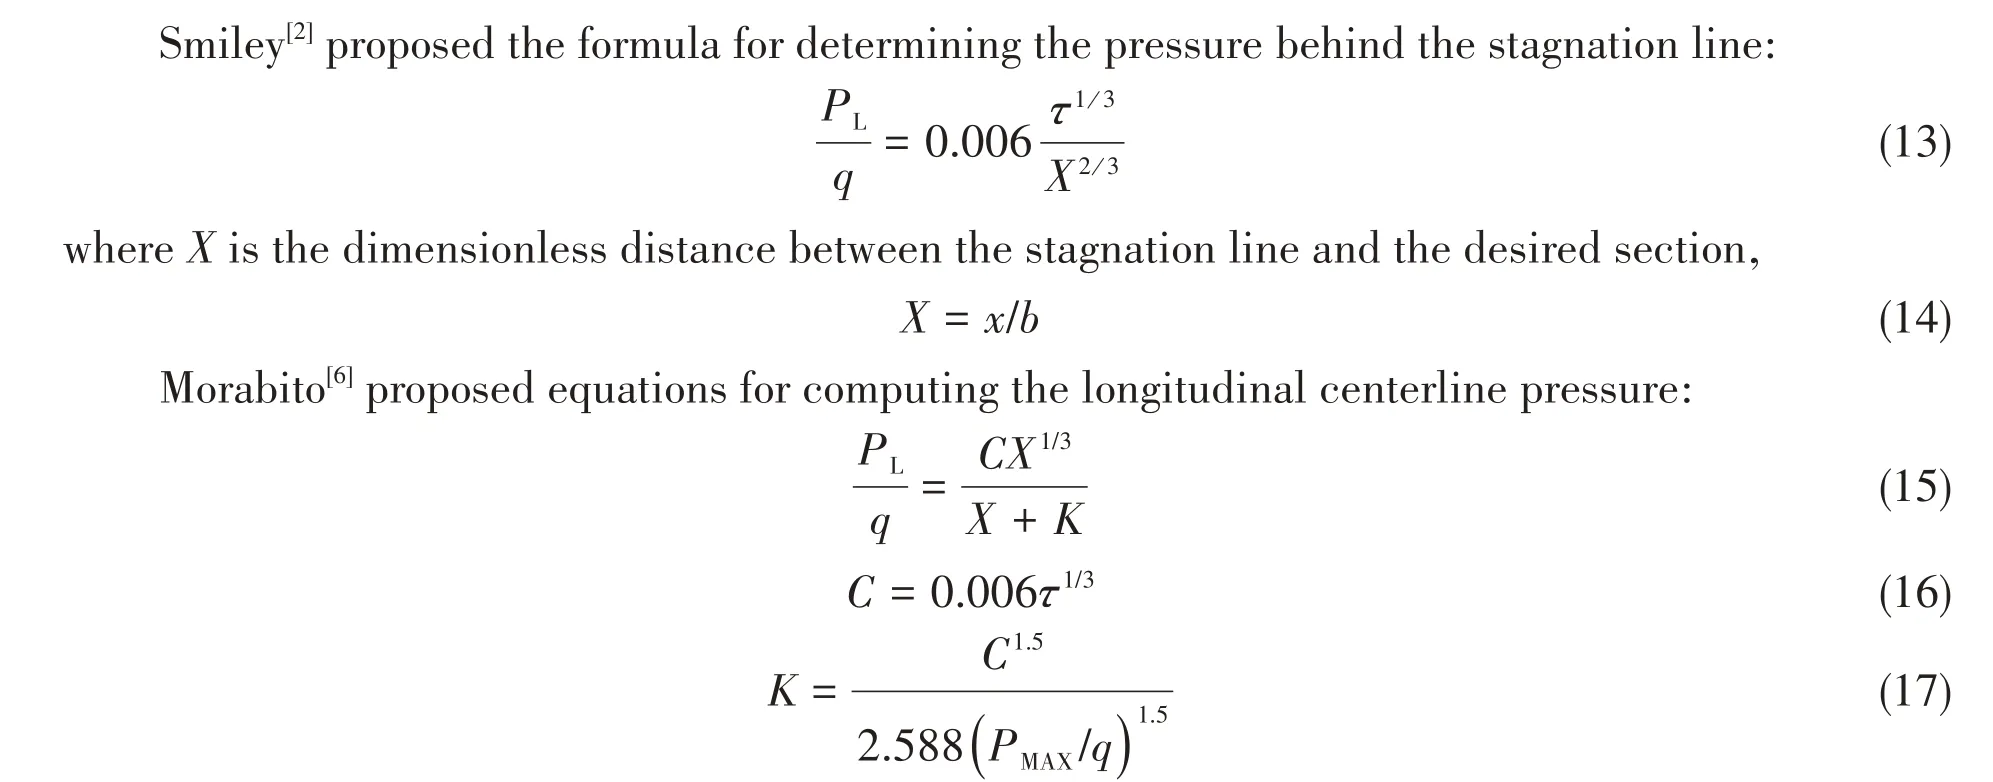
The transom correction factor was used to take into consideration the effect of the transom stern,which equals zero at the transom and approaches 1.0 far from the transom.

2.2 Transverse pressure distribution
The maximum pressure is at the centerline and decreases to atmospheric pressure at the chine.Korvin-Kroukovsky[14]introduced a factor of the transverse pressure distribution. And the factor expressed the ratio of the transverse section with a fixed length to the centerline.The pressure distribution over the bottom of a planing hull is shown in Fig.2.

The ratio of the stagnation pressure to the dynamic pressure at each longitudinal section is introduced:

Fig.2 Schematic diagram of pressure distribution

By substituting the pressure distribution for planes parallel to the stagnation line, the coeffi⁃cientsCandKcan be modified taking into account the effect of distance from the stagnation line.


2.3 Hydrostatic and total pressure
With the effect of transom stern and the losses at the chine taken into account, the hydrostatic pressure at a given point on the bottom of the planing hull can be determined:

Finally,the total pressure acting on the bottom can be determined by the summation of the hy⁃drodynamic and hydrostatic pressures,

The hydrodynamic and hydrostatic lift force can be obtained by the integration of the dynamic and hydrostatic pressure,and the lift coefficient can be expressed as:

wherelPrepresents the longitudinal center of pressure.
2.4 New mathematical model
A computer code is developed to obtain the pressure distribution of a planing hull.The compu⁃tation is performed from the stagnation (X=0)to the transom stern (X=LAMDA_Y)when theYvalue is fixed in the first loop. While the second loop is carried out from the centerline (Y=0 ) to the half of the beam(Y=0.5).
Assuming that all the forces acting on the planing hull pass through the center of gravity, the following formula is obtained according to the force balance:


whereCLBis the load coefficient,CLis the lift coefficient,LCGdenotes the longitudinal center of gravity,respectively.
In this paper, the solution of nonlinear equations of Eq. (34) is transformed into the minimum value of the following function of Eq. (35). The empirical formula proposed by Morabito combined with a genetic algorithm is used to find the minimum value of the function, and the trim angle and wetted aspect ratio that satisfy the equilibrium conditions are obtained. Then the total resistance can be computed by the procedure of Savitsky’s method. A new mathematical model based on the pressure distribution and genetic algorithm is developed. The specific computational process is shown in Fig.3.


Fig.3 Schematic of computational procedure
2.5 CFD method
The fluid flow around the planing hull is assumed as incompressible transient and fully turbu⁃lent. The flow field is modeled by the unsteady Reynolds-Average Navier-Stokes equations which are solved by the software Star CCM+.The Navier-Stokes equations can be expressed as follows:


wherekdenotes the turbulent kinetic energy,ωdenotes the dissipation rate,Γk,Γω,Gk,Gw,Yk,Yω,andSωdenote the production,dissipation and cross-diffusion term ofkandωrespectively.
The semi-implicit method for pressure linked equation (SIMPLE) algorithm was considered to solve the pressure-velocity coupling. The volume of fluid (VOF) approach was applied to track the free surface of the two-phrase flow involving water and air.
3 Validation
3.1 Dynamic pressure distribution
To validate the accuracy of the mathematical model,the results obtained in this paper are com⁃pared with the experimental results of Kapryan and Boyd[3]. The results of four different conditions are compared,as shown in Fig.4.The results by the present method are in good agreement with the experimental data under different conditions, which proves that the present method has a superior accuracy.The peak of longitudinal pressure occurs near the stagnation point,which matches the ac⁃tual physical phenomena.


Fig.4 Comparison of the longitudinal dynamic pressure distributions
3.2 Lift coefficients of planing plates

Fig.5 shows the comparison between the results by the present method and Savitsky’s method at different Froude numbers. The comparison of lift force coefficients by two methods shows good satisfaction,which indicates that the present method can obtain efficient and accurate results.


Fig.5 Comparison of the lift force coefficients by two methods
4 Parameter effects on the pressure distribution
In this chapter, the effects of speed, deadrise angle and trim angle on the pressure distribution of the Fridsma planing hull are investigated. The principal geometrical characteristics of the plan⁃ing hull are shown in Tab.1.

Tab.1 Principal geometrical characteristics
4.1 Effect of speeds
Fig.6 shows the comparison of the longitudinal distributions of static pressure, dynamic pres⁃sure, and total pressure on the centerline of the bottom at three different speeds. As the speed in⁃creases, the peak value of the static pressure coefficient increases. However, the dynamic pressure coefficient does not change with speed. The static pressure accounts for a large proportion at low speeds,and the dynamic pressure accounts for a large proportion at high speeds.

Fig.6 Longitudinal pressure distribution of the centerline at different speeds
4.2 Effect of deadrise angles
The comparison of the longitudinal distributions of static pressure, dynamic pressure and total pressure at three deadrise angles is plotted in Fig.7.At a given trim angle,as the deadrise angle in⁃creases, the peak of the dynamic pressure coefficient decreases. The comparison implies that the deadrise angle has a less influence on the pressure coefficient distribution except for the position of the stagnation and transom stern.

Fig.7 Longitudinal pressure distribution of the centerline at different deadrise angles
4.3 Effect of trim angles
The comparison of the longitudinal distributions of static pressure, dynamic pressure and total pressure on the centerline at different trim angles is shown in Fig.8.As the trim angle increases,the peaks of both the static pressure and the dynamic pressure coefficients increase,and the peak posi⁃tion of the static pressure coefficient shifts toward the direction of the stagnation line.

Fig.8 Longitudinal pressure distribution of the centerline at different trim angles
5 Results and discussion
5.1 Hydrodynamic lift coefficient
Fig.9 and Fig.10 show the comparison of the hydrodynamic lift results computed by the mathe⁃matical model in this paper and obtained by Savitsky’s formula and nonlinear nu⁃merical solutions developed by Zhao and Faltinsen[16]. The lift coefficient computed by the present method is in better agree⁃ment with the nonlinear numerical solu⁃tion compared with the lift coefficient ob⁃tained by Savitsky’s formula. The hydro⁃dynamic lift coefficient decreases with the deadrise angle increasing. And the lift co⁃efficient increases as the wetted aspect ra⁃tio increases.

Fig.9 Lift coefficients at different wetted aspect ratios

Fig.10 Lift coefficient at different deadrise angles
5.2 Attitude and resistance
Numerical and experimental results of the running attitudes are plotted in Fig.11. The results of the sinkage show good agreement between the present mathematical model and experimental data in Fig.11(a).However,the trim angle obtained by the present method has a larger deviation from ex⁃periments compared with Savitsky’s method. It implies that the present method can give accurate results of the vertical lift force,but the trim moment obtained by the present method may have some errors from the actual value. Since the viscous and nonlinear effect can be considered in the CFD method,the results of sinkage and trim angle computed by the CFD method are in better agreement with those of the experiments.

Fig.11 Comparison of running attitudes
Fig.12 shows the results of the wetted length and resistance.The wetted length of the keel,the chine and the average wetted length decrease with the speed increasing. And the wetted length of the keel has little change when theCVis greater than 4. The resistance obtained by the present method is more accurate than that by Savitsky’s method compared wtih the experimental data. The resistance computed by the CFD method is in better agreement with that of the experiments com⁃pared to the present method.This is because the present method cannot take into account the effect of viscosity.

Fig.12 Comparison of wetted lengths and resistances
5.3 Component of lift force
The hydrostatic lift force generated by hydrostatic pressure contribution is evaluated by consid⁃ering the planing hull volume below the intersection between the hull and the calm water in its plan⁃ing condition[11].It should be noted that the correction for the effect of a dry transom stern on the ver⁃tical force is neglected in the current study.

whereFhsdenotes the hydrostatic lift force,andFhddenotes the hydrodynamic lift force,respectively.
Fig.13 shows the comparison of hydrody⁃namic and hydrostatic lift forces by different methods.Overall,the lift forces obtained from the present method and Savitsky’s method have a similar tendency to the results com⁃puted by the CFD method.It can be seen that the results of the present method appear to be closer to the results of the CFD method compared with the results of Savitsky’s method. This phenomenon is consistent with the results of sinkage,which is related to vertical lift force.WhenCVis equal to 2.7,the hydrodynamic lift force is approximately equal to the hydrostatic lift force.

Fig.13 Comparison of hydrodynamic and hydrostatic lift forces
5.4 Wake behind the transom stern
The empirical formula developed by Savitsky[17]is used to compute the centerline free surface profile behind the transom stern of a planing hull. The local coordinate system (X,Z) is defined in Fig.14,and the free surface profile can be expressed as following:

whereBrepresents the beam of the planing hull,τdegis the trim angle in degrees, andλwis defined as the mean wetted length to beam ratio.
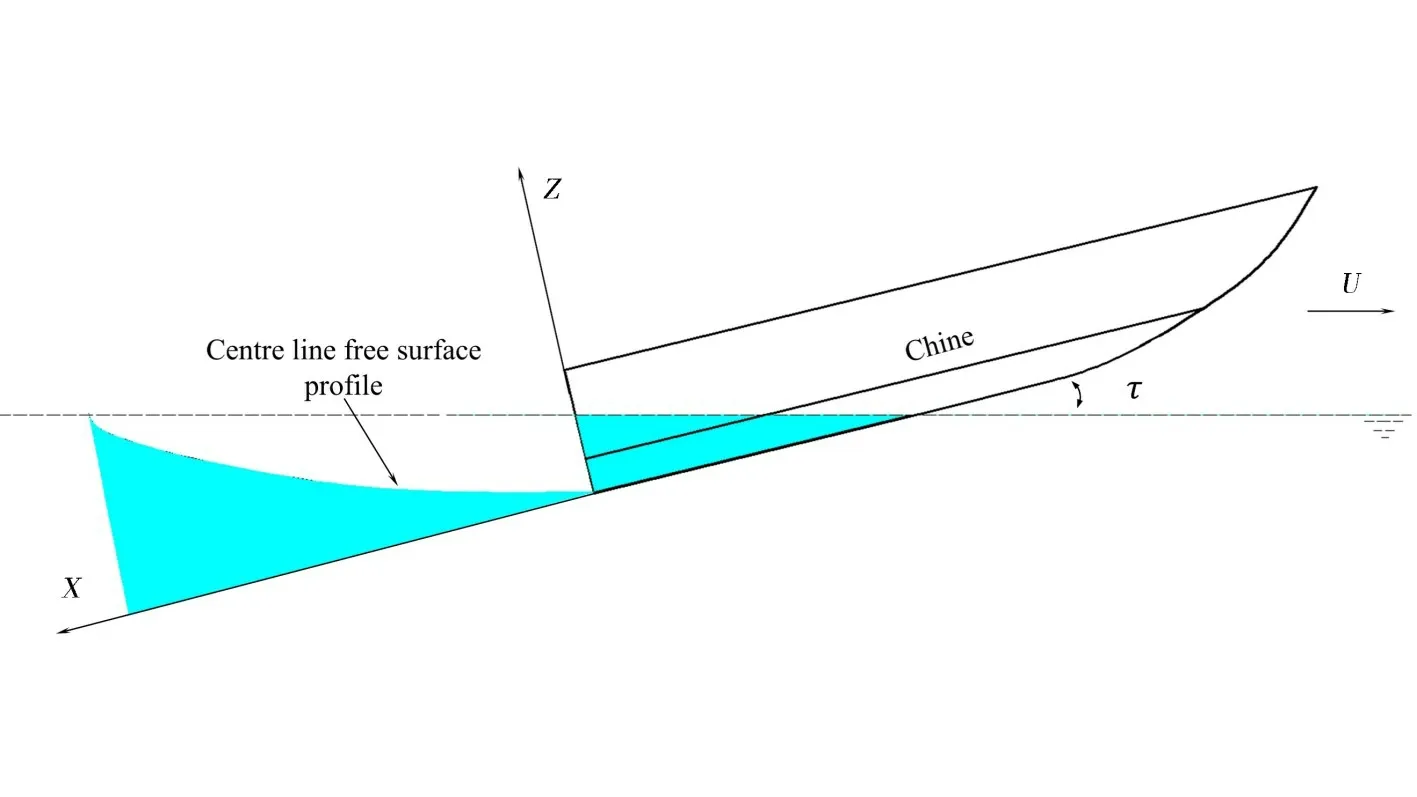
Fig.14 Coordinate system in the analysis of the centerline free surface behind the transom stern of a planing hull
According to the local coordinate system definition of Savitsky’s method, the result of the free surface profile of the centerline is converted into the result in the reference coordinate system, as shown in the following expression:

wherezrepresents the vertical coordinate in the reference coordinate system,ddenotes the draught in the static floating condition,andLkis the wetted length of the keel.
Fig.15 shows the numerical results of the centerline free surface profile behind the transom stern.The results computed by the present method are consistent with those of Savitsky’s method at low speed. However, the deviation appears with the speed increasing, which is related to the trim angle.The results of both the present method and Savitsky’s method have a certain difference from the results of the CFD method.

Fig.15 Centerline free surface profile behind the transom stern
5.5 Contours of pressure distribution
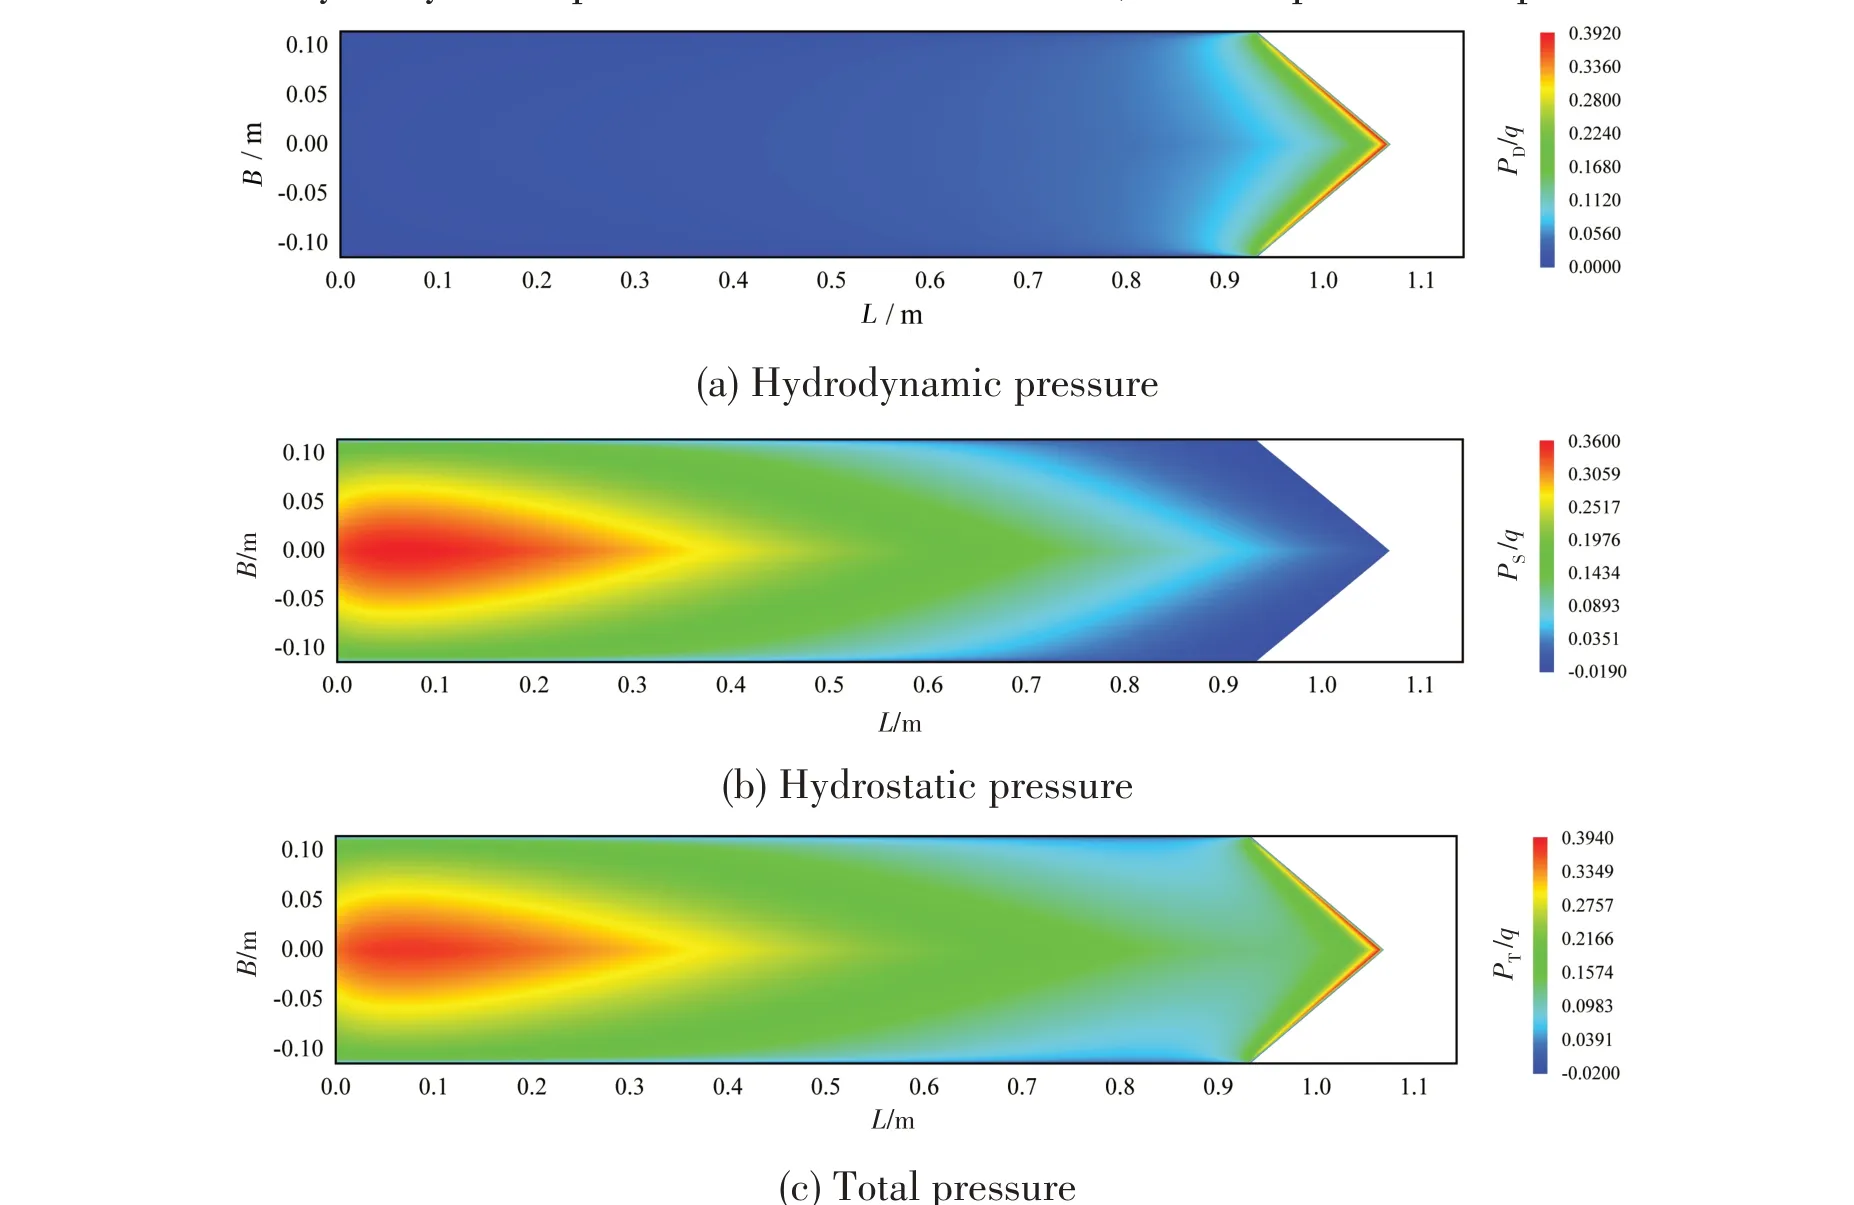
Fig.16 Contours of pressure at Cv=1.4

Fig.17 Contours of pressure at Cv=3.7

Fig.18 Contours of pressure at Cv=5.4
Figs.16-18 illustrate the contours of hydrodynamic pressure coefficients, hydrostatic pressure coefficients and total pressure coefficients at different speeds.With the speed increasing,the values of the maximum hydrodynamic pressure coefficient decrease,and the positions of peak move towards the midship gradually. The peak area of hydrostatic pressure coefficients appears near the transom stern, which is due to the effects of sinkage and trim. Moreover, it can be seen that the ratio of hy⁃drodynamic pressure to total pressure is increasing as the speed increases.WhenCvis equal to 5.4,the weight of the planing hull is almost supported by the hydrodynamic pressure.
6 Conclusions
A new mathematical model is proposed in this paper based on the pressure distribution for evaluating the hydrodynamic performance of planing hulls in calm water.A computer program is de⁃veloped and validated. Good agreement between the results obtained by the present method and those computed by Savitsky’s method shows the accuracy of the proposed method. The following conclusions can be drawn from the current study:
(1) Compared with the experimental data, both the CFD method and semi-empirical method can obtain good results of attitude and resistance, while the present method gives slightly better re⁃sults of resistance than Savitsky’s method.
(2) The present method can give the contours of the pressure, and obtain more physical details compared with Savitsky’s method.
(3)As the speed increases,the hydrodynamic pressure is more significant for the distribution of pressure.While the present method and Savitsky’s method are efficient and acceptable for predict⁃ing the resistance of planing hulls in calm water,there are some limits to their application.The CFD method is more suitable for simulating the motion of planing hulls if there are enough computational resources.
(4) The present method has the potential to be extended to predict the resistance of stepped planing hulls with variable deadrise angles,which will be further studied in the future.
- 船舶力学的其它文章
- An Approach for Connector Arrangement of Very Large Floating Structures
- Structural Redundancy Verification for Side Shell Frame of Single Side Skin Bulk Carriers
- Dynamic Mechanical Behavior and Constitutive Relation of Shipbuilding E36 Steel
- Buckling Characteristics and Influencing Factors of Composite Grid Sandwich Plates with Soft Core
- Application of Computational Methods for Hydrodynamic Pressure Caused by Supercritical Ship in Shallow,Finite or Deep-depth Waters
- Ship Local Path Planning Based on Improved Q-Learning

