
Noninvasive imaging of hepatic dysfunction: A state-of-the-art review
2022-06-11 07:35:34TingDuanHanYuJiangWenWuLingBinSong
World Journal of Gastroenterology 2022年16期
Ting Duan,Han-Yu Jiang, Wen-Wu Ling, Bin Song
Abstract Hepatic dysfunction represents a wide spectrum of pathological changes, which can be frequently found in hepatitis, cholestasis, metabolic diseases, and focal liver lesions. As hepatic dysfunction is often clinically silent until advanced stages, there remains an unmet need to identify affected patients at early stages to enable individualized intervention which can improve prognosis. Passive liver function tests include biochemical parameters and clinical grading systems (e.g.,the Child-Pugh score and Model for End-Stage Liver Disease score). Despite widely used and readily available, these approaches provide indirect and limited information regarding hepatic function. Dynamic quantitative tests of liver function are based on clearance capacity tests such as the indocyanine green (ICG)clearance test. However, controversial results have been reported for the ICG clearance test in relation with clinical outcome and the accuracy is easily affected by various factors. Imaging techniques, including ultrasound, computed tomography, and magnetic resonance imaging, allow morphological and functional assessment of the entire hepatobiliary system, hence demonstrating great potential in evaluating hepatic dysfunction noninvasively. In this article, we provide a state-of-the-art summary of noninvasive imaging modalities for hepatic dysfunction assessment along the pathophysiological track, with special emphasis on the imaging modality comparison and selection for each clinical scenario.
Key Words: Hepatic dysfunction; Ultrasound; Computed tomography; Magnetic resonance imaging
INTRODUCTION
Hepatic dysfunction is a common result of a wide variety of diseases, including hepatobiliary disorders and systemic diseases. The clinical symptoms of hepatic dysfunction (e.g., jaundice, anorexia, and abdominal pain) are varied and nonspecific[1 ]. Liver biopsy is the gold standard for hepatic dysfunction currently. Accurate as it is, liver biopsy is invasive, and susceptible to sampling errors and interobserver variation. Besides, liver biopsy is limited by various complications and operator expertise.Therefore, the introduction of noninvasive diagnostic approaches is pivotal to addressing the above limitations of liver biopsy. Hepatic dysfunction usually manifests as biochemical abnormalities of serum markers, typically involving hepatocyte damage, cholestasis, bilirubin, synthesis function, and liver fibrosis[2 ,3 ]. Nevertheless, it is worth noting that not all patients with abnormalities in the above markers have primary liver disease, highlighting the wide differential diagnosis spectrum of abnormal liver chemistry and metabolic functions[2 ]. Considering the limited value of single serum markers in hepatic dysfunction evaluation, clinical grading systems integrating biochemical parameters and clinical symptoms have been developed to reveal impaired liver function. Among them, the Child-Pugh score is a widely adopted clinical scoring system that is particularly useful in selecting surgical candidates with hepatocellular carcinoma (HCC) and cirrhosis[4 ]. The Model for End-Stage Liver Disease score was initially developed to predict short-term survival in patients undergoing transcutaneous intrahepatic portosystemic shunt procedures and has been later expanded to stratify patients with end-stage liver disease awaiting transplantation[5 ]. Nevertheless, the performances of these clinical grading systems are suboptimal in mild liver injuries. Furthermore, despite widely used and readily available, biochemical parameters and clinical grading systems only provide indirect information about the hepatic function[6 ]. In contrast, dynamic quantitative tests, such as the indocyanine green (ICG) clearance test[7 ], allows direct measurements of liver clearance capacity and hence has become a routine test in preoperative liver function evaluation. However, discrepancies have been reported on the performances of ICG clearance test in clinical outcome prediction[8 ]. In addition, the accuracy of ICG clearance is affected by operator’s proficiency and the concentration of blood oxygen and other competitive agents[9 ].
Noninvasive imaging techniques, including ultrasound (US), computed tomography (CT), and magnetic resonance imaging (MRI), allow morphological and functional assessment of the entire hepatobiliary system (Table 1 ). These techniques permit qualitative and quantitative evaluation of hepatocyte quantity and function, fibrosis degree, type and severity of metabolic disorders, and excretory function of the biliary system. Therefore, through accurate hepatic dysfunction measurement and identification of affected individuals at early diseases stages, noninvasive imaging modalities offer appeal in individualized clinical decision-making and improving patient prognosis. Therefore, this review provides a state-of-the-art summary of noninvasive imaging modalities for assessing hepatic dysfunction along the pathophysiological track in various clinical situations.
HEPATITIS-INCLUDED HEPATIC DYSFUNCTION
Hepatitis is a major global public health problem affecting hundreds of millions of people. The common causes are the virus, bacteria, amoeba, and other infections. Other relatively rare causes include drug and food poisoning. Most deaths from viral hepatitis are due to hepatitis B and hepatitis C. An estimated 257 million people were living with hepatitis B and 71 million people were living with hepatitis C[10 ].
Acute hepatitis
In mild hepatitis, edema of hepatocytes and inflammatory cells gather in the portal area at pathology. Atthis stage, the imaging findings are generally nonspecific, such as enhanced echo on US, slightly decreased density on CT, or increased signals on T2 -weighted imaging.

Table 1 Noninvasive imaging modalities for hepatic dysfunction
With the aggravation of inflammation, histologic changes become more pronounced, including lobular disarray, acidophilic degeneration of hepatocytes, focal lobular necrosis, disruption of bile canaliculi with cholestasis, and portal and parenchymal infiltration of inflammatory cells (predominantly lymphocytes and macrophages)[11 ], as well as hypertrophy and hyperplasia of Kupffer cells and macrophages. These changes can lead to heterogeneous appearances of the liver parenchyma on precontrast imaging. Meanwhile, the microcirculation in the liver deteriorates, causing patchy enhancement or wedge-shaped enhancement pattern of the liver parenchyma on contrast-enhanced imaging. In addition, the “halo-ring sign” or “track sign” appears around the portal vein as a result of increased lymph inflow and blocked lymph backflow[12 ]. The transient portal hypertension (PH) leads to increased pressure in the gallbladder vein, causing subsequent subserosal edema of the gallbladder wall. With the gallbladder wall thickening and protruding into the cavity, a typical sign of “centripetal edema” appears[13 ]. Enlarged lymph node can be detected on US, CT, or MRI[14 ].
A high proportion of severe acute hepatitis cases can result in significant liver failure[15 ,16 ]. In these cases, extensive hepatocyte necrosis can lead to substantial bridging. Irregular necrosis is depicted as map-like low density on CT images. On contrast-enhanced images in the portal venous phase, the necrotic areas usually become hyper-attenuating compared with adjacent liver parenchyma due to infiltrates of inflammatory cells, increased arterial blood supply, and widened intercellular space. This sign is called “reverse enhancement”, which is a characteristic manifestation of severe hepatitis. In addition, ascites can be detected frequently[15 ] (Figure 1 ). Grillet et al[15 ] reported that heterogeneous liver parenchyma on CT would be particularly beneficial for patients with acute severe autoimmune hepatitis as histological examinations could be technically challenging due to complications. They also reported heterogeneous CT features of severe alcoholic hepatitis, indicating that these imaging features were mainly associated with transient heterogeneous steatosis and liver perfusion disorders[15 ].Furthermore, Tanaet al[17 ] used texture analysis to quantify the heterogeneity of the liver parenchyma,and showed that texture features of the liver could provide important quantitative information in predicting the severity and outcomes of patients with acute alcohol-associated hepatitis.

Figure 1 Ultrasound and computed tomography images of a 19 -year-old man with severe drug-induced hepatitis. A: High frequency ultrasound image showing increased and heterogenous echo intensity of the liver parenchyma; B: Pre-contrast computed tomography image showing map-like hypodense area in the liver parenchyma and moderate ascites; C: The hypodense areas on (B) became hyperattenuating on portal venous phase image, showing “reverse enhancement”.
In summary, ultrasound is recommended as the first-line imaging modality for morphologic evaluation in patients with acute hepatitis. Contrast-enhanced CT or MRI should be considered when intrahepatic necrosis is suspected.
Chronic hepatitis
Chronic hepatitis refers to a morphologic pattern that is usually observed in patients with chronic viral hepatitis, autoimmune hepatitis, drug-induced hepatitis, and alcoholic hepatitis. Chronic hepatitis is characterized by several pathologic changes. These include inflammations of the portal veins and sometimes of the bile ducts; periportal injury and inflammation; several degeneration and apoptosis of intra-acinar hepatocytes secondary to inflammatory response; and different forms of fibrosis[18 ]. The end-stage progression is cirrhosis. The image findings of liver fibrosis and cirrhosis are described in later sections.
Typical imaging characteristics of chronic hepatitis include unsmooth liver margin, blunt edge,widened portal vein, enlarged spleen, and thickened gallbladder wall[19 ] (Figure 2 ). Unfortunately,when the above signs appear, liver injury has usually occurred for a long time and become irreversible.
Many efforts have been devoted to capturing the early hepatic microcirculation and perfusion changes of chronic hepatitis using imaging techniques. The deposition of collagen in the space of Disse and sinusoidal capillarization result in increased resistance to incoming sinusoidal blood flow, leading to a decrease in portal venous flow to the liver and an increase in hepatic arterial flow, and subsequently the formation of intrahepatic and portosystemic shunts. Caoet al[20 ] reported a significant correlation between the ICG clearance rate and MR-based portal venous perfusion, suggesting that MR-based portal venous perfusion could be used as a surrogate for liver function assessment.
Another important cause for hepatic dysfunction in chronic hepatitis is the impaired hepatocytes.Active transport of MR hepatobiliary contrast agents (e.g., gadoxetate and gadobenate dimeglumine)into the hepatocytes can reflect hepatocyte functions. Hepatobiliary phase (HBP) images can be acquired at about 20 min after contrast administration for gadoxetate and 1 -2 h for gadobenate dimeglumine,with signal intensity on HBP images providing important information regarding liver function[21 ,22 ].On this basis, studies further showed that T1 mapping could eliminate signal deviation and allow accurate liver function quantification[23 -25 ].
Without proper and timely intervention, chronic hepatitis may progress to liver fibrosis (LF) and PH,which would be discussed in later sections.
CHOLESTASIS
Acute cholestasis
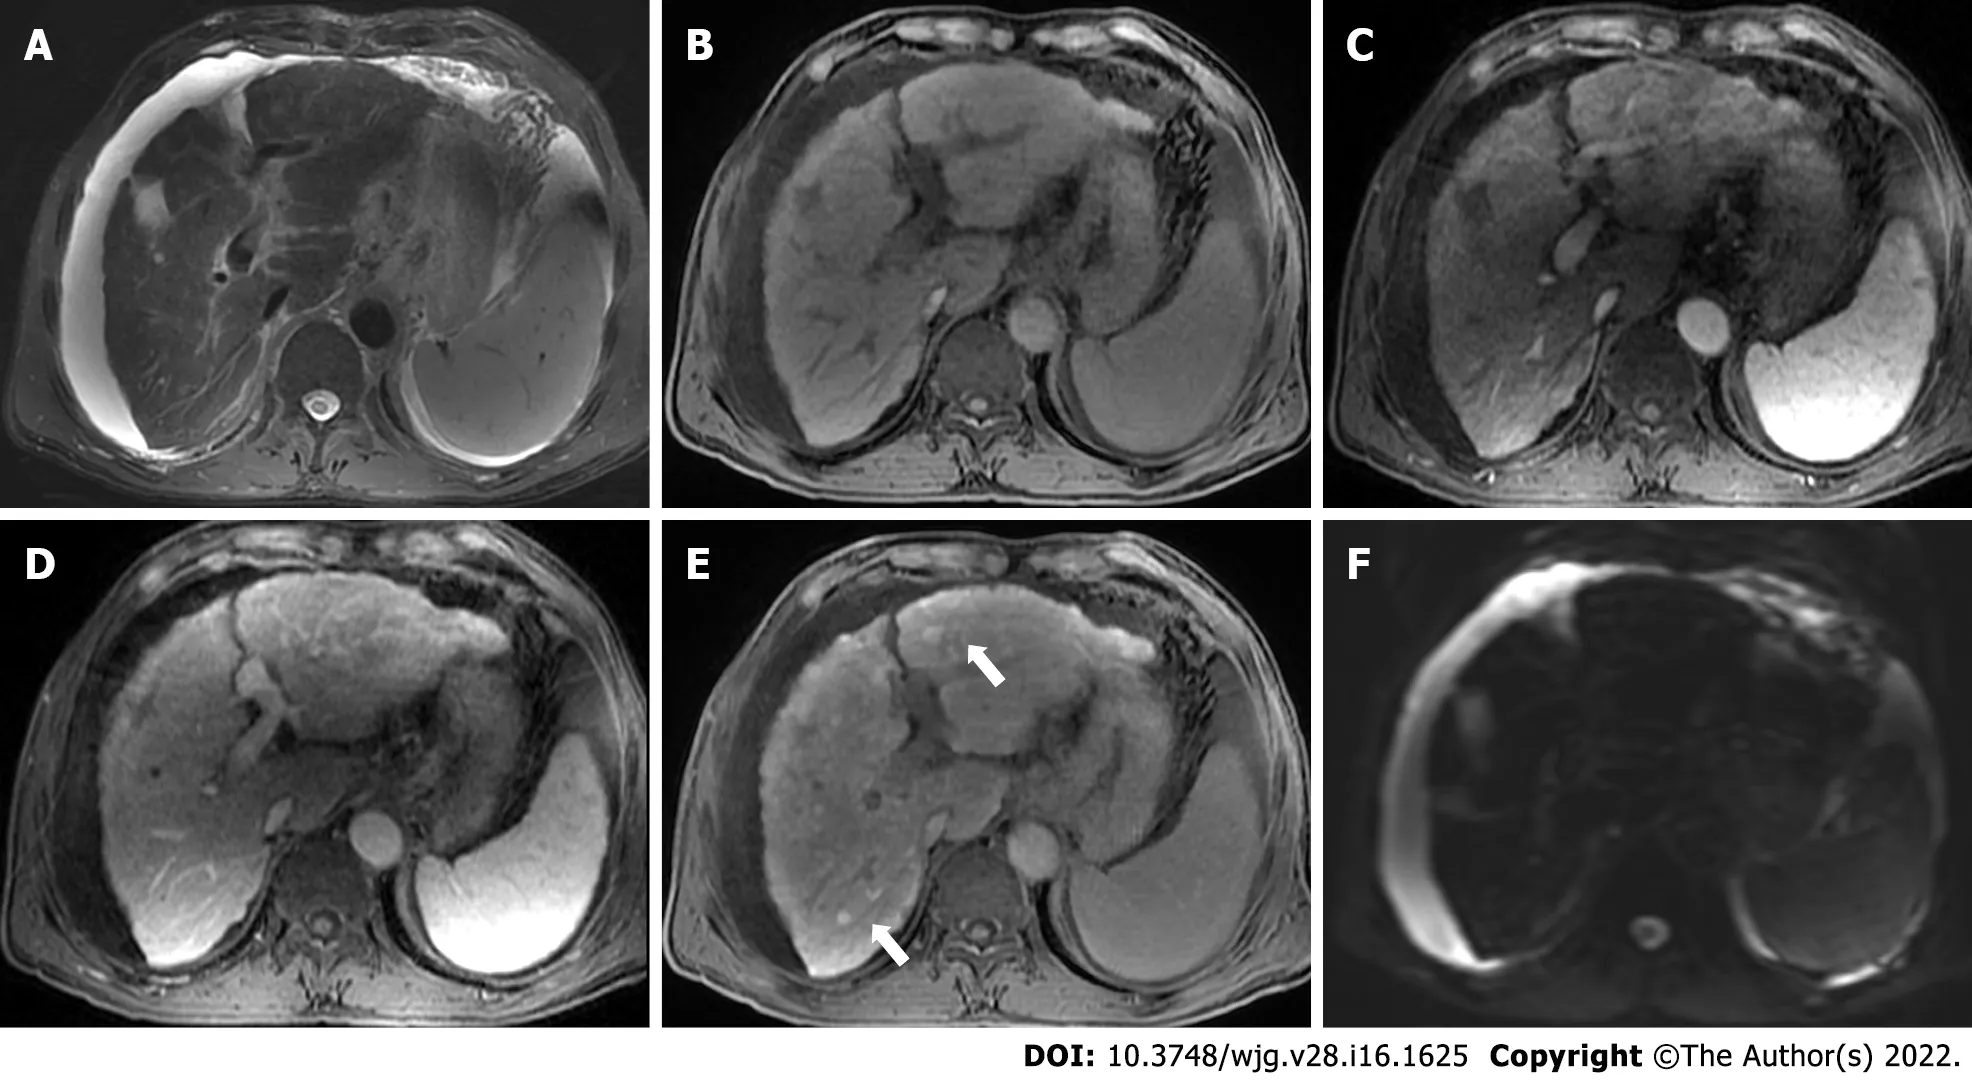
Figure 2 Gadoxetate-enhanced magnetic resonance images of a 70 -year-old man with chronic hepatitis B. T2 -weighted image (A) shows signal loss of the liver parenchyma, suggesting iron overload. T1 -weighted pre-contrast (B), arterial phase (C), and portal venous phase (D) images show nodular contour and patchy enhancement of the liver parenchyma. Hepatobiliary phase image demonstrates diffuse hyperintense nodules (E, black arrows) without diffusion restriction on diffusion-weighted imaging (F), indicating regenerative nodules. Moderate ascites was also noted.
Acute cholestasis is characterized with mechanical biliary obstruction of any cause, such as choledocholithiasis, strictures (e.g., neoplastic, inflammatory, or postoperative), pancreatitis, choledochal cysts,parasitic diseases (e.g., ascariasis and fascioliasis), or even extrinsic pressure from enlarged lymph nodes[26 ]. US is promising for diagnosing early-stage acute cholestasis. However, magnetic resonance cholangiopancreatography (MRCP) is more sensitive in assessing the location, severity, cause, and extent of biliary obstruction[27 ]. MRCP images of a patient with suspected acute cholestasis can help: (1 ) Confirm the obstruction; (2 ) exclude other causes of jaundice; (3 ) determine the location of obstruction (intra- or extrahepatic ducts); (4 ) measure the approximate length of the biliary stricture; and (5 ) reveal the status of proximal bile ducts[28 ] (Figure 3 ).
Apart from MRCP, gadoxetate-enhanced MRI can also aid in evaluating acute cholestasis. Although less widely available than MRCP, it has a unique role in detecting bile leaks after biliary surgery or liver trauma[29 ].
Recently, elastography has also been applied in acute cholestasis. Kimet al[30 ] reported that liver stiffness measured by MRI elastography (MRE) is elevated with the increase of cholestasis, and can be predictive for the sufficiency of biliary decompression after biliary drainage.
Chronic cholestasis
Most chronic cholestatic disorders are insidious in onset, and chronic cholestasis progresses slowly over the course of years before it becomes clinically apparent. The most frequent causes of chronic cholestasis are primary sclerosing cholangitis (PSC) and primary biliary cirrhosis (PBC). Furthermore, allograft rejection can lead to bile duct damage and subsequent chronic cholestasis in patients who have undergone liver transplantation.
Characteristic imaging features of PSC include thickened concentric mural wall involving the extrahepatic biliary duct, with segmental intrahepatic biliary duct dilatation, preferentially affecting the left hepatic lobe. Gallbladder luminal sludge or stones and inflammatory polyps can also be depicted[31 ]. On MRCP, PSC can have typical features of biliary ductal changes, such as intrahepatic and extrahepatic short segmental bile duct strictures alternating with normal or mildly dilated bile ducts,giving rise to a beading appearance. At times, mild diffuse dilatation of the entire intrahepatic biliary system with a branching-tree appearance can be observed[32 ] (Figure 4 ).
On the other hand, PBC is characterized by chronic, non-suppurative lymphocytic cholangitis that predominantly affects small and interlobular bile ducts in the portal triads, leading to vanishing bile duct syndrome[33 ]. Diffuse hepatomegaly is the most pronounced morphological change. Patients usually develop micronodular or liver fibrosis. Most early PBCs had normal appearances on MRCP. As disease progresses, intrahepatic bile ducts become irregular. Thereafter, most peripheral branches of the intrahepatic bile ducts gradually become invisible, while medium-sized bile ducts present with reduced caliber and irregularity. These findings could be explained pathologically by destruction and disappearance of small intrahepatic bile ducts in PBC[34 ]. The assessments of liver function in PSC is similar to those in cirrhosis caused by chronic hepatitis[35 ].

Figure 3 Magnetic resonance images of a 63 -year-old man with hilar cholangiocarcinoma. Axial (A) and coronal (B) portal venous phase images demonstrate thickened hilar bile duct wall (white arrows). The extrahepatic bile duct is absent on magnetic resonance cholangiopancreatography image (C, white arrowhead), and the intrahepatic bile ducts are dilated and distorted (“vine-sign”).
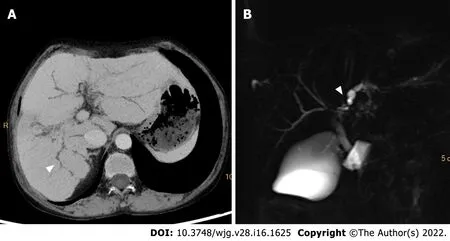
Figure 4 Computed tomography and magnetic resonance cholangiopancreatography images of a-42 -year-old woman with primary sclerosing cholangitis. Minimum density projection computed tomography image of portal venous phase (A) and magnetic resonance cholangiopancreatography image (B) show a “beading appearance” of the intrahepatic bile ducts (white arrowheads).
In summary, when cholestasis is suspected, ultrasound is recommended for screening. When biliary obstruction or stricture is confirmed, MRI (MRCP in particular) is the preferred modality for further examinations.
METABOLIC DISEASES
Nonalcoholic fatty liver disease
Nonalcoholic fatty liver disease (NAFLD) is defined as liver fat exceeding 5 %-10 % by weight and exists as a spectrum from steatosis (usually stable) to nonalcoholic steatohepatitis (NASH) (characterized by cellular ballooning, necroapoptosis, inflammation, and fibrosis)[36 ]. Early detection and treatment of NAFLD can help prevent its progression to NASH and cirrhosis[37 ].
Among the imaging methods which enable liver fat quantification, transient elastography (TE) is the most widely studied US approach. A recent meta-analysis revealed that in NAFLD patients, the areas under the curve (AUC) of TE were 0 .819 for S0 vs S1 -S3 and 0 ·754 for S0 -S1 vs S2 -S3 [38 ]. Another metaanalysis reported superior result of TE in the diagnosis of mild steatosis (AUC, 0 .96 ) compared with severe steatosis (AUC, 0 .70 )[39 ]. Thus, an insufficient performance for TE in the diagnosis of moderate to severe steatosis should be noted.
The sensitivity and specificity of CT in detecting hepatic steatosis were reported ranging from 46 % to 72 % and from 88 to 95 %, respectively[40 ]. However, given the potential additive radiation exposure, CT is not typically utilized as a screening test for NAFLD.
In addition, chemical-shift-encoded MRI-based proton density fat-fraction (PDFF) is increasingly accepted as an effective imaging modality in evaluating liver steatosis. A recent meta-analysis which included 2979 patients showed that MRI-PDFF offered pooled sensitivities of 0 .71 -0 .91 and specificities of 0 .88 -0 .93 for staging liver steatosis[41 ], with the optimal diagnostic performance achieved for detecting ≥ S1 (sensitivity, 0 .92 ; specificity, 0 .93 ) steatosis. Choi et al[42 ] compared the performance of MRI-PDFF and TE-based controlled attenuation parameter (CAP) in staging liver steatosis, and they found that MRI-PDFF correlated far better with hepatic fat measured (r= 0 .978 ) than with CAP (r=0 .727 ). Besides, several clinical randomized controlled trials have shown that PDFF can be used to monitor and predict the therapeutic effect of NAFLD[43 -45 ].
NASH is also characterized with a distinctive increase in liver extracellular fluid, which can be measured by an increase in T1 relaxation time. However, the accumulation of excess iron in liver tissue can be a confounding factor for T1 relaxation time. In this context, iron-corrected T1 can be generated to correct for this potential bias[46 ,47 ]. In a study of 50 patients undergoing standard-of-care liver biopsy for NAFLD, iron-corrected T1 has been demonstrated to correlate with ballooning and could accurately distinguish between steatosis and NASH patients[48 ].
Collectively, given the costs, availability, and diagnostic performances, US may be an appropriate modality to detect NAFLD. If accurate quantification of liver fat or monitoring of efficacy is needed,MRI PDFF should be a better choice.
Iron storage disorders
Iron storage disorders are characterized by unregulated iron increase or decrease in the liver[49 ]. An increase in systemic iron can be a consequence of: (1 ) Hereditary hemochromatosis; (2 ) ineffective erythropoiesis or chronic liver disease; and (3 ) parenteral iron administration. Excessive intracellular deposition of iron ultimately results in tissue and organ damage. The diagnosis of iron overload relies on serum iron studies (elevated transferrin saturation and elevated serum ferritin levels), genetic testing, and sometimes liver biopsy to assess the hepatic iron concentration and degree of liver injury[50 ].
The paramagnetic effect of liver iron on the neighborhood protons affects T2 and T2 * relaxation times by accelerating the signal decay. Therefore, the presence of iron results in tissue signal loss on T2 and T2 * weighted images that is proportional to iron content, which is the basic principle of MRI in evaluating liver iron overload[51 ]. The MRI methods for liver iron quantification can be divided into signal intensity ratio methods and relaxometry methods.
With signal intensity ratios, studies showed that although these methods tended to overestimate mild to moderate hepatic iron overload, it might be more precise in severe iron overload, particularly on 3 T MRI[52 ,53 ]. On the other hand, relaxometry techniques measure the MR signal decay resulting from the shortening of T2 or T2 * relaxation times. For practical purposes, the inverse of T2 or T2 * (the relaxation rates, R2 or R2 *) is generally used instead, because the elevation in liver iron concentration directly increases the R2 and R2 *[54 ]. The most known R2 relaxometry method is commercially available as FerriScan and is FDA-approved for 1 .5 T machines[55 ]. Well validated across different sites and platforms, liver R2 has an excellent correlation with liver iron concentration, with low inter-exam variability and good inter-machine reproducibility[56 ]. However, major limitations of this technique include long acquisition times and high cost. In contrast, R2 * relaxometry is performed with fast, single breath-hold spoiled GRE multi-echo sequences in most MR scanners. Several studies demonstrated an excellent linear relationship between R2 * and liver iron concentration[57 ,58 ] (Figure 5 ). However, R2 *measurements may be affected by liver fibrosis and the coexistence of fat[59 ].
Quantitative susceptibility mapping (QSM) was first used in the nervous system. It is based on the concept of transforming hypointense blooming artifacts into precise quantitative measurements of spatial biodistributions. Therefore, it is not affected by liver fibrosis and the coexistence of fat[59 ].Tipirneni-Sajjaet al[60 ] applied a multispectral autoregressive moving average model in QSM to liver iron concentration. They found that autoregressive moving average-QSM showed a good association with an iron concentration in both phantom study andin vivocohort, indicating that autoregressive moving average-QSM could provide a potentially confounder-free assessment of hepatic iron overload[60 ].
Therefore, the influence of iron on MRI signal makes MRI the most appropriate imaging modality for quantifying liver iron concentration, and QSM may be the most potential sequence to serve this purpose.
PROGRESSION OF DIFFUSE LIVER DISEASE
Liver fibrosis is a scarring response that occurs in almost all chronic liver injuries mentioned above.Ultimately, liver fibrosis can lead to cirrhosis, in which PH is a common and lethal complication. Early diagnosis and accurate staging of these conditions can facilitate timely patient care and optimize prognoses.

Figure 5 Magnetic resonance images of a 26 -year-old man with hemochromatosis. Pre-contrast T1 -weighted image (A), portal venous phase T1 -weighted image (B), T2 -weighted image (C), and SWI image (D) showed signal intensity in liver parenchyma, while R2 * mapping (E) shows increased signal intensity in the liver, demonstrating severe iron overload. R2 : Relaxation rate.
Liver fibrosis
With the deposition of collagen in the extracellular space, liver parenchyma stiffness increases as the disease progresses. These alterations can be measured by elastography techniques.
Among all elastography techniques, TE is the most widely used method to determine liver stiffness and may serve as a potential surrogate to assess liver fibrosis. The pooled AUC of TE for diagnosing liver fibrosis was 0 .859 for NAFLD, 0 .860 for chronic hepatitis B, and 0 .830 for alcohol-related liver disease in previous meta-analyses[61 -63 ]. In addition, shear wave elastography (SWE) was also reported with a high diagnostic accuracy for detecting early-stage liver fibrosis[64 -66 ]. Petzold et al[67 ] found that a cutoff value of 8 .05 kPa could differentiate patients with advanced fibrosis (F ≥ 3 ) from those with no or mild fibrosis (F0 -F2 ) with AUCs ranging between 0 .995 and 1 .000 . A meta-analysis revealed no significant difference between TE and SWE in the diagnosis of significant fibrosis, advanced fibrosis,and cirrhosis, but the proportion of failed measurements was over ten-fold greater with TE than SWE[68 ].
In addition to ultrasound-based elastography techniques, the MR-based elastography technique MRE is another promising noninvasive modality to assess liver fibrosis[69 ,70 ]. A prospective study of 67 PSC patients revealed a high sensitivity (87 .5 %) and specificity (96 %) of MRE in detecting cirrhosis[71 ]. In another study, a significant discriminatory ability of MRE was confirmed when distinguishing between early to moderate and advanced liver fibrosis, shedding light on the incremental values of liver stiffness measurements on MRE in prognosis stratification[72 ]. Fu et al[73 ] found that the efficacy of MRE was superior compared with TE in detecting significant fibrosis (AUC: 0 .965 vs 0 .906 ) and advanced fibrosis(AUC: 0 .957 vs 0 .913 ). These results were confirmed by a meta-analysis in which the pooled AUC of MRE (0 .97 ) was significantly higher than that of SWE (0 .88 ) in detecting significant fibrosis[74 ].
As fibrosis progresses, the deposition of fibroglia can lead to enlarged extracellular space. Therefore,liver extracellular volume (LECV) measured by CT or MR T1 mapping can also be used to assess liver fibrosis[75 -77 ]. In a cynomolgus monkey model of NASH, Lyu et al[78 ] found that LECV was significantly correlated with the fibrosis score (r= 0 .949 ), and demonstrated an AUC of 0 .945 in diagnosing liver fibrosis.
Diffusion-weighted imaging is a noninvasive technique based on the Brownian motion of water molecules in biological tissue and has shown potential in assessing liver fibrosis[79 ]. Studies showed that in chronic liver diseases, apparent diffusion coefficients in diffusion-weighted imaging decreased as the degree of fibrosis increased, but this relationship was not statistically significant due to confounding factor of blood microcirculation in the capillaries[80 ,81 ]. Recent studies have explored various diffusion models to avoid this influence. Lefebvreet al[82 ] reported that intravoxel incoherent motion parameter with 10b-values was reproducible for liver tissue characterization and that perfusion fraction (f)provided good diagnostic performance for distinguishing dichotomized grades of inflammation. Parket al[83 ] showed that the distributed diffusion coefficient from the stretched exponential model was the most accurate diffusion-weighted imaging parameter for staging liver fibrosis as it could avoid the confounding effect by steatosis.
Besides, liver fibrosis can result in changes in hepatic microcirculation and perfusion. Fanet al[84 ]found that MR perfusion parameters, time to peak, and mean transit time in particular could reflect the degree of liver fibrosis. Similarly, Yoonet al[85 ] also found that portal blood flow was significantly lower in clinically significant hepatic fibrosis and that mean transit time and extracellular volume increased in cirrhosis.
In general, TE is the modality preferred for LF. SWE can be considered in patients who fail in TE examination. As a modality which is gaining increasingly popularity, MRE is preferred over sonographic elastography in patients with ascites and obesity, or requiring more comprehensive liver workup.
PH
PH is defined by values of hepatic venous pressure gradient (HVPG) > 5 mmHg, whereas clinically significant PH could be diagnosed if HVPG ≥ 10 mmHg. HVPG has been widely-validated as associated with variceal bleeding, hepatic decompensation, and mortality. However, its measurement is invasive and requires extensive expertise[86 ].
Characteristic imaging features of PH include portosystemic shunts, splenomegaly, ascites, and widening of the portal vein. However, these findings are often detectable at end stages of the disease,thus demonstrating limited sensitivities for diagnosing PH.
For quantitative methods, similar to liver fibrosis, elastography techniques have gained increasing attention in the assessment of PH[87 ]. Among ultrasound-based elastography techniques, TE was the most validated method for PH assessment. A meta-analysis involving 12 studies showed that liver stiffness measured on TE was well correlated with HVPG and demonstrated a sensitivity of 91 .2 % and specificity of 81 .3 % in diagnosing clinically significant PH (cut-off values 13 .6 -18 .6 kPa)[88 ]. In contrast,despite much less applied than TE, SWE also exhibited encouraging profiles in predicting PH and esophageal varices (AUC: 0 .86 -0 .89 )[89 -93 ].
Liver and spleen stiffness measured by MRE also showed promising performances in predicting PH and esophageal varices. A recent meta-analysis found that liver and spleen stiffness on MRE could serve as supplemental noninvasive assessment tools for detecting clinically significant PH and that spleen stiffness might be more specific and accurate than liver stiffness (AUC: 0 .88 vs 0 .92 )[94 ].
Hemodynamic alteration is another distinct feature in PH. In patients with cirrhosis, decreased portal and total hepatic perfusion were observed[95 ,96 ]. Studies showed that mean portal vein velocity in cirrhosis was lower than that in normal subjects and decreased with the severity of liver cirrhosis and gastroesophageal varices[97 ,98 ]. The portal vein velocity measured by doppler US could be used as noninvasive triage tests before referral to endoscopy (sensitivity, 84 %-97 %), but the cutoff value varied from 16 -19 cm/s[99 ,100 ]. Several MR techniques have also been proposed for liver hemodynamic assessment in PH. Chouhanet al[101 ] used phase-contrast MR to assess the portal vein and the infrahepatic and suprahepatic inferior vena cava. The hepatic artery flow was estimated by subtracting infrahepatic from suprahepatic inferior vena cava flow and portal vein flow, which showed significant positive correlations with HVPG[101 ]. Additionally, 4 D flow MRI also demonstrated promising capacity in quantifying blood flow in the hepatic and splanchnic vasculature[102 ,103 ]. Motosugi et al[104 ] found that azygos flow > 0 .1 L/min and portal venous flow less than the sum of splenic and superior mesenteric vein flow were useful markers to stratify the risk of gastroesophageal varices bleeding in patients with cirrhosis. Another study revealed that the combination of liver stiffness measured by MRE and perfusion metrics measured by contrast-enhanced-MRI had an AUC of 0 .903 for diagnosing PH,and an AUC of 0 .785 for detecting clinically significant PH[105 ].
In summary, TE and SWE are promising noninvasive approaches for preliminary PH screening.Nevertheless, for patients with increased risk for esophageal and gastric varices, multiparametric MRI may be a more accurate and comprehensive modality.
FOCAL LIVER LESIONS
Focal liver lesions include benign tumors, malignant tumors, and hepatic echinococcosis. The impact of focal liver lesions on liver function includes the decrease of normal liver volume and the reduced hepatocyte function, especially in surgical candidates with malignant liver tumors. Previous studies have shown that a high residual to total liver volume ratio (≥ 40 %) was required for patients with an impaired liver function to tolerate resection[106 -108 ]. Gadoxetate-enhanced MRI is also used to evaluate the hepatic function of patients with focal liver lesions. Yoonet al[109 ] reported that T1 mapping on gadoxetate-enhanced MRI provided information on global liver function and demonstrated functional heterogeneity in patients with HCC. Other studies have combined liver volume with hepatocyte function, and their results showed that combined T1 mapping and residual liver volume on gadoxetateenhanced MRI could assess liver function with good diagnostic accuracy in patients with liver tumors[110 -112 ]. Kim et al[113 ] and Wang et al[114 ] reported that the combination could predict post hepatectomy liver failure better than the ICG clearance test in patients with HCC who underwent hepatectomy.
To sum up, CT can be used to calculate the residual liver volume for surgical candidates. Gadoxetateenhanced MRI can not only reflect residual liver volume, but also reveal the functional information of hepatocytes.
CONCLUSION
In this article, we provide a summary of noninvasive imaging modalities for assessing hepatic dysfunction in various clinical situations and case scenarios (Figure 6 ). Several challenges still exist in noninvasive imaging of hepatic dysfunction. First, many imaging parameters have inconsistencies on the device. Therefore, a unified threshold cannot be adopted. Second, quantification of sensitivity and specificity usually requires an effective reference standard (e.g., liver biopsy) which may not be readily available. Furthermore, most of the current studies focus on the role of a single method or sequence,with limited multiparametric, multimodal, and multidisciplinary approaches to evaluate liver dysfunction.
The long-term goal in hepatic dysfunction imaging is to develop reliable, noninvasive, and comprehensive methods which could reveal not only the disease severities but also etiologies using safe and clinically available techniques. However, to accomplish this goal will require advances in imaging sciences (improved image modalities standardization and quantitation, further exploration of US, CT,and MR imaging methods, and combination of multiparametric and multimodal imaging techniques).On this basis, radiomics and artificial intelligence may provide further assistance in quantifying highlevel imaging features beyond human eyes and help in constructing effective predictive models. A better understanding of the human genetic variation underlying differences in the liver will further contribute to this field. Furthermore, the potential value of combining imaging and serum biomarkers should also be explored.
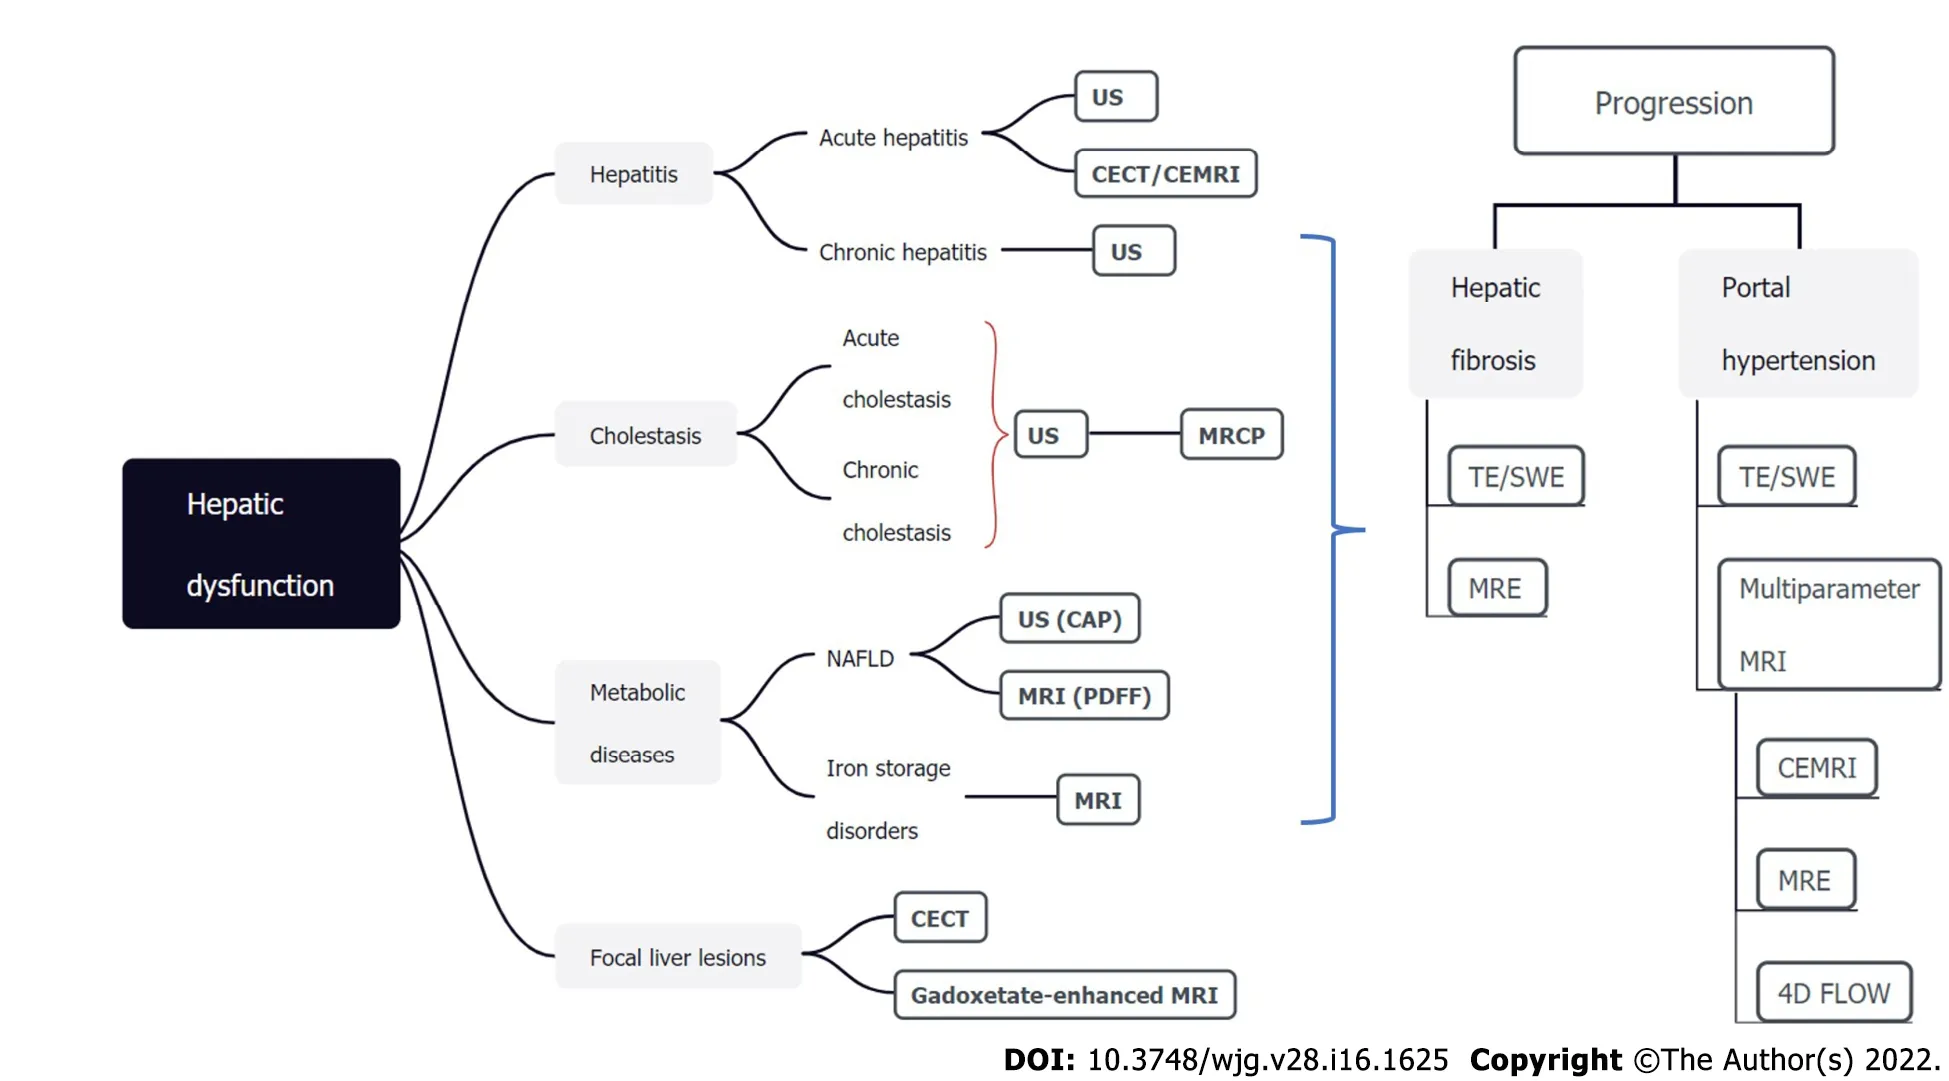
Figure 6 Noninvasive imaging modalities for assessing hepatic dysfunction. The TextTitle modalities are recommended and should be the first-line methods. US: Ultrasound; CT: Computed tomography; MRI: Magnetic resonance imaging; TE: Transient elastography; SWE: Shear wave elastography; MRE: MRI elastography; MRCP: Magnetic resonance cholangiopancreatography; NAFLD: Nonalcoholic fatty liver disease; PDFF: Proton density fat-fraction; CAP: Controlled attenuation parameter; CECT: Contrast-enhanced CT; CEMRI: Contrast-enhanced MRI.
FOOTNOTES
Author contributions:Duan T wrote the manuscript; Jiang HY contributed significantly to manuscript preparation and revision; Ling WW helped perform the analysis with constructive discussions; Jiang HY and Song B contributed to the conception of the study; all authors have read and approved the final manuscript.
Supported byScience and Technology Support Program of Sichuan Province, No. 2021 YFS0021 and 2021 YFS0141 .
Conflict-of-interest statement:The authors have no conflict of interests related to this study.
Open-Access:This article is an open-access article that was selected by an in-house editor and fully peer-reviewed by external reviewers. It is distributed in accordance with the Creative Commons Attribution NonCommercial (CC BYNC 4 .0 ) license, which permits others to distribute, remix, adapt, build upon this work non-commercially, and license their derivative works on different terms, provided the original work is properly cited and the use is noncommercial. See: https://creativecommons.org/Licenses/by-nc/4 .0 /
Country/Territory of origin:China
ORCID number:Ting Duan 0000 -0001 -6694 -4520 ; Han-Yu Jiang 0000 -0002 -7726 -1618 ; Wen-Wu Ling 0000 -0002 -6449 -3831 ; Bin Song 0000 -0001 -7007 -6367 .
S-Editor:Chang KL
L-Editor:Wang TQ
P-Editor:Chang KL
 World Journal of Gastroenterology2022年16期
- World Journal of Gastroenterology的其它文章
- Comment on “Artificial intelligence in gastroenterology: A state-of-the-art review”
- Viral hepatitis: A global burden needs future directions for the management
- Evaluating the accuracy of American Society for Gastrointestinal Endoscopy guidelines in patients with acute gallstone pancreatitis with choledocholithiasis
- Aspartate transferase-to-platelet ratio index-plus: A new simplified model for predicting the risk of mortality among patients with COVID-19
- Small nucleolar RNA host gene 3 functions as a novel biomarker in liver cancer and other tumour progression
- Risk of venous thromboembolism in children and adolescents with inflammatory bowel disease: A systematic review and meta-analysis