The Preliminary Statistical Analysis of LAMOST DR8 Low Resolution AFGK Stars
Y.H.Chen ,G.W.Li ,and H.Shu
1 Institute of Astrophysics,Chuxiong Normal University,Chuxiong 675000,China;yanhuichen1987@126.com
2 School of Physics and Electronical Science,Chuxiong Normal University,Chuxiong 675000,China
3 Key Laboratory for the Structure and Evolution of Celestial Objects,Chinese Academy of Sciences,Kunming 650011,China
4 National Astronomical Observatories,Chinese Academy of Sciences,Beijing 100101,China
Abstract We download the Large sky Area Multi-Object fiber Spectroscopic Telescope Data Release 8 (LAMOST DR8)low resolution catalog for 6,478,063 AFGK type stars and plot the figures of effective temperature,gravitational acceleration and metal abundance.Some small and medium mass stars are evolved from pre-main sequence or main sequence stage to planetary nebula stage or white dwarf stage by the stellar evolution code MESA.We analyze the observed statistical data and model calculation results,and then obtain some basic conclusions preliminarily.Most red giant and asymptotic giant branch stars with log g less than 0.85 have poor metal abundance.Most hot A type main-sequence stars are metal-rich stars with log g from 3.5 to 4.5.The conclusions are reasonable within a certain error range.The theory of a gap area in the Hertzsprung–Russell diagram for stellar evolutions of medium mass stars is reflected in the statistical plots.The central core hydrogen burning stage and the central core helium burning stage correspond to the peak structures in the statistical plots for gravitational acceleration.The metal abundances among A,F,G and K type stars have a wide distribution.We cannot simply replace the metal abundances of these stars with the metal abundance of the Sun when doing fine research work.
Key words:stars:statistics– stars:evolution– techniques:spectroscopic
1.Introduction
Photometric observation and spectral observation are important methods to detect celestial information.NASA’s Kepler space telescope was launched in 2009 and retired in 2018 (Thompson et al.2018;Córsico 2020).The highprecision continuous photometric data of tens of thousands of stars have brought revolutionary development to the research on exoplanets and astrophysics.The observed data of K2 can be used to study young open clusters,bright stars,galaxies,supernovae and asteroseismology (Howell et al.2014).The Sloan Digital Sky Survey (SDSS) telescope is designed to measure multi-band and multi-color photometric and spectral data of order a million celestial bodies,and then calculate the redshift values (Gunn et al.2006).The SDSS is also used to research DA type white dwarfs (WDs,Gianninas et al.2011;Tremblay et al.2011),the magnetic fields of DA type WDs(Külebi et al.2009),supernova legacies(Astier et al.2006)and near-Earth objects (Raymond et al.2004).
The Large sky Area Multi-Object fiber Spectroscopic Telescope (LAMOST,Cui et al.2012),also named the Guo Shou Jing Telescope(GSJT),is an optical telescope developed by Chinese scientists.LAMOST has a wide field of view(~5°)and a large effective aperture (~4 m) (Cui et al.2012).LAMOST will observe the spectra of millions of objects in the northern sky and do research work on the evolution history of galaxies,the distribution of dark matter,sub-structures in the Milky Way halo,the black hole in the center of the Milky Way and other cutting-edge topics (Zhao et al.2012).
Since 2011,LAMOST has released a large number(~millions) of spectra every year,including galaxies,quasistellar objects(QSOs),stars including AFGK type stars,M type stars,A type stars,and unknown objects for the low resolution catalog.We download the low resolution catalog AFGK type stars from the Data Release 8 (DR8) v1.0 (the corresponding URL http://www.lamost.org/dr8/) and do some basic research work.In Section 2,we show a basic analysis of observed data of LAMOST DR8 low resolution catalog AFGK stars.In Section 3,we provide a preliminary analysis of observation results based on evolutionary models.Then,a discussion and conclusions are given in the last section.
2.The Basic Analysis of Observed Data of LAMOST DR8 Low Resolution Catalog AFGK Stars
The LAMOST DR8 v1.0 contains 219,776 galaxies,71,786 QSOs,6,478,063 AFGK type stars and so on from 2011 to 2020.We download the 6,478,063 AFGK type stars from the low resolution catalog and plot the figures of effective temperature (Teff),gravitational acceleration (log g) and metal abundance([Fe/H]).Then,we do a basic analysis based on the figures.
The 6,478,063 AFGK type stars contain 100,468 A type stars,1,983,821 F type stars,3,249,746 G type stars and 1,144,028 K type stars.These spectra are published by LAMOST DR8 v1.0 with signal to noise ratio in g band larger than 15 in bright nights and 6 in dark nights.The wavelength range of the spectra is from 3690 to 9100 Å.The resolution of the spectra is 1800 at 5500 Å(Stoughton et al.2002;Abazajian et al.2003).Based on the LAMOST Stellar Parameter pipeline(LASP,Wu et al.2014;Luo et al.2015),the effective temperatures (Teff),surface gravities (log g) and metallicities([Fe/H]) are calculated and published.With these statistical parameters,we perform a preliminary research work.
In Figure 1,we show the Teffversus log g plot for 6,478,063 AFGK type stars and the percentage histogram of the number of stars with Teffdistribution.In the lower panel,the blue,green,yellow and red pluses represent the A,F,G and K type stars respectively.The log g values of most A type stars are greater than 3.2.The values of log g have a gap area around 3.2 at the red end of Teffaround 4000 K.Most stars with log g less than 0.85 have red Teffvalues around 4000 K.In Figure 2,we feature a percentage histogram of the number of stars with Teffdistribution for A,F,G and K type stars from top to bottom respectively.In Figure 2,we can see that most of the A,F,G and K type stars are consistent with the Harvard system of spectral classification of stars.The spectral parameters are self consistent.For the parameter errors,the error of Tefffor 1268 stars cannot be calculated and is marked as -9999 in the original data.We set these -9999 to -10 and draw Figure 3.Figure 3 is the error of Teffversus Teffplot for 6,478,063 AFGK type stars and the percentage histogram of the number of stars with the error of Teffdistribution.There are 81% of stars with the error of Teffless than 200 K.

Figure 1.The Teff versus log g plot for 6,478,063 AFGK type stars and the percentage histogram of the number of stars with Teff distribution.In the lower panel,the blue,green,yellow and red pluses represent the A,F,G and K type stars respectively.In the upper panel,the width of each histogram bar is set to 100 K.The cumulative total number of stars is set to 7 on the ordinate.
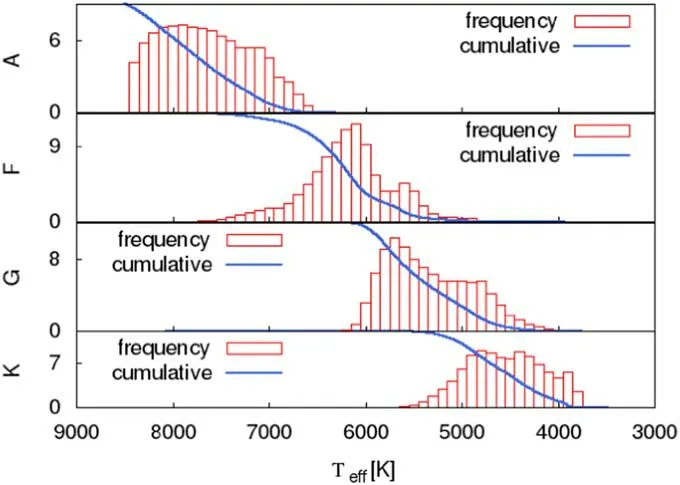
Figure 2.The percentage histogram of the number of stars with Teff distribution for A,F,G and K type stars from top to bottom respectively.The width of each histogram bar is set to 100 K.

Figure 3.The error of Teff versus Teff plot for 6,478,063 AFGK type stars and the percentage histogram of the number of stars with the error of Teff distribution.The width of each histogram bar is set to 10 K.The cumulative total number of stars is set to 1.2 on the ordinate.There are 81% of stars with the error of Teff less than 200 K.
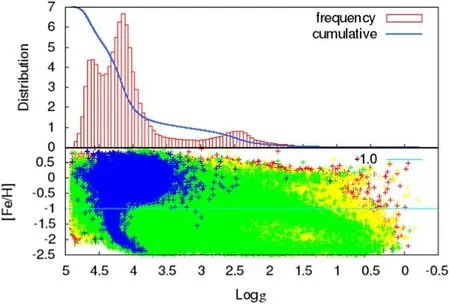
Figure 4.The log g versus[Fe/H]plot for 6,478,063 AFGK type stars and the percentage histogram of the number of stars with log g distribution.The width of each histogram bar is set to 0.05.The cumulative total number of stars is set to 7 on the ordinate.
In Figure 4,we display the log g versus [Fe/H] plot for 6,478,063 AFGK type stars and the percentage histogram of the number of stars with log g distribution.The ordinate of the lower panel is the [Fe/H],the logarithmic value of a stellar average heavy-element abundance relative to the Sun,not only iron content.By checking the upper panel and the original data,we obtain that there are 5276(445 F type,4109 G type and 722 K type)stars with log g less than or equal to 0.85.In the lower panel,most of the stars with log g less than 0.85 have[Fe/H]in a range from -2.5 to -1.0,corresponding metal abundance Z from 0.000 063 to 0.002.The metal abundance for the Sun is Z=0.02.Most of the stars are metal-poor stars,approximately belonging to stellar Population II,when log g is less than 0.85.In addition,in the upper panel,there is one peak around log g=4.2 and the other peak is around log g=2.4.There is a valley around log g=3.2.In Figure 5,we show the percentage histogram of the number of stars with log g distribution for A,F,G and K type stars from top to bottom respectively.The log g values of K type stars are slightly larger.The peak around log g=2.4 in Figure 4 is mainly caused by G type stars,as displayed in Figure 5.In Figure 6,we show the error of log g versus log g for 6,478,063 AFGK type stars and the percentage histogram of the number of stars with the error of log g distribution.The error of log g for 4139 stars cannot be calculated and is marked as -0.01 in Figure 6.There are 79%of stars with the error of log g less than 0.3.
In Figure 7,we show the [Fe/H] versus Teffplot for 6,478,063 AFGK type stars and the percentage histogram of the number of stars with[Fe/H]distribution.The stars with the same metal abundance as the Sun,[Fe/H]=0.0,are the most and account for 6%in the upper panel of Figure 7.Most of the stars with Teffhigher than 7500 K have[Fe/H]in a range from-0.75 to 0.75,corresponding to the metal abundance Z from 0.0036 to 0.11.Namely,most of the stars are metal-rich,approximately belonging to stellar Population I,when Teffis higher than 7500 K.In fact,in the upper panel,we can see that the number of stars with extremely poor metal abundances is relatively small.By checking the upper panel of Figure 1 and the original data,we obtain that there are 78,141 stars with Teffgreater than or equal to 7500 K.These 78,141 stars contain 65,842 A type stars,12,295 F type stars,3 G type stars and 1 K type star.Most of these 78,141 stars are hot A type stars.Their log g values are greater than 3.5 according to the top panel of Figure 5.In Figure 8,we depict the percentage histogram of the number of stars with[Fe/H]distribution for A,F,G and K type stars from top to bottom respectively.Except for the A type stars,the metal abundances of F,G and K type stars all have a peak value at [Fe/H]=0.0.However,the metal abundances among A,F,G and K type stars have a wide distribution.The metal abundance is an important parameter in stellar physics.In meticulous research work,we cannot simply replace the metal abundance of other stars with the metal abundance of the Sun.In Figure 9,we show the error of [Fe/H] to [Fe/H] for 6,478,063 AFGK type stars and the percentage histogram of the number of stars with the error of [Fe/H] distribution.The error of [Fe/H] for 1095 stars cannot be calculated and is marked as -0.01 in Figure 9.There are 84% of stars with the error of [Fe/H] less than 0.2.
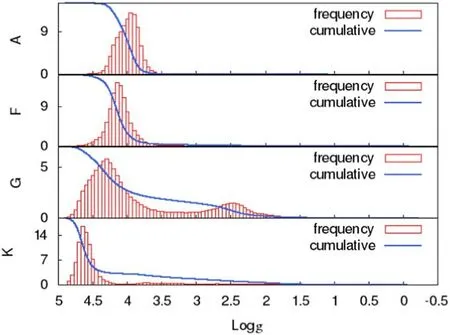
Figure 5.The percentage histogram of the number of stars with log g distribution for A,F,G and K type stars from top to bottom respectively.The width of each histogram bar is set to 0.05.
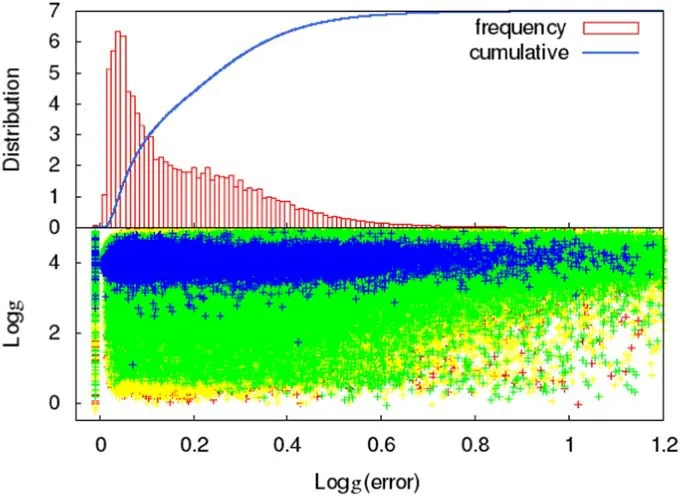
Figure 6.The error of log g versus log g plot for 6,478,063 AFGK type stars and the percentage histogram of the number of stars with the error of log g distribution.The width of each histogram bar is set to 0.01.The cumulative total number of stars is set to 7.0 on the ordinate.There are 79% of stars with the error of log g less than 0.3.

Figure 7.The [Fe/H] versus Teff plot for 6,478,063 AFGK type stars and the percentage histogram of the number of stars with [Fe/H] distribution.The width of each histogram bar is set to 0.05.The cumulative total number of stars is set to 12 on the ordinate.

Figure 8.The percentage histogram of the number of stars with [Fe/H]distribution for A,F,G and K type stars from top to bottom respectively.The width of each histogram bar is set to 0.05.

Figure 9.The error of [Fe/H] versus [Fe/H] plot for 6,478,063 AFGK type stars and the percentage histogram of the number of stars with the error of[Fe/H]distribution.The width of each histogram bar is set to 0.01.The cumulative total number of stars is set to 12 on the ordinate.There are 84% of stars with the error of [Fe/H] less than 0.2.

Figure 10.The H-R and corresponding log Teff versus log g diagram for 1.0 M⊙stellar evolution.The gray,yellow,blue,pink,black and red lines represent the pre-MS,MS,RGB,HB,AGB and PN-WD respectively.The green line signifies the transition from the MS stage to the RGB stage.
3.The Preliminary Analysis of Observation Results Based on Evolutionary Models
In this section,we do some stellar evolutions and perform a preliminary analysis of the observation results based on the evolutionary models.In Figure 10,we depict a Hertzsprung–Russell (H-R) diagram and the corresponding log Teffversus log g diagram for 1.0 M⊙stellar evolution based on stellar evolution code MESA (Paxton et al.2011),the module of 1M_pre_ms_to_wd.MESA is a powerful stellar evolution code and it is an abbreviation for Modules for Experiments in Stellar Astrophysics (Paxton et al.2011).The equation of state(EOS) tables are from the OPAL EOS tables (Rogers &Nayfonov 2002),SCVH tables (Saumon et al.1995) for lower temperatures and densities,HELM tables (Timmers &Swesty 2000) and PC tables (Potekhin &Chabrier 2010) for complete ionization regions.The opacity tables are from Iben(1975)for non-degenerate electrons,Yakovlev&Urpin(1980)for degenerate electrons,Ferguson et al.(2005) and Iglesias &Rogers (1993,1996) for radiative opacities,and Cassisi et al.(2007) for the combinations of radiative opacities and electron conduction opacities.The thermonuclear burning rates are from Angulo et al.(1999)and Caughlan&Fowler(1988).For more details about MESA,see Paxton et al.(2011) and their followup papers.
In Figure 10,the gray line represents the pre-main sequence(pre-MS) stage.The ignition of nuclear reaction (log Tc[K]=7.14 for the model) signifies that the star has entered the zero age main sequence(MS)stage.The yellow line corresponds to the MS stage.The green line signifies the transition from the MS stage to the red giant branch(RGB)stage.At this stage,the central hydrogen burning ends and a hydrogen shell burning appears at the edge of the central helium core.The blue line corresponds to the RGB stage.The pink line stands for the core helium burning stage.These stars at the core helium burning stage are called horizontal branch (HB) stars (Faulkner 1966).The HB stars are observed in the color–magnitude diagram of globular clusters,such as M15 (Durrell &Harris 1993).When the central helium core burning ends,a hydrogen burning shell coexists with a helium burning shell below it.The star enters the asymptotic giant branch (AGB) stage,as shown by the black line in Figure 10.The AGB stars have a hydrogen burning shell and a helium burning shell,while the RGB stars only have a hydrogen burning shell.The red line signifies the planetary nebula(PN)stage and WD stage.The lower panel of Figure 10 is the H-R diagram.The upper panel of Figure 10 is the corresponding log Teffversus log g diagram.The dotted lines in the upper panel of Figure 10 are to facilitate the identification of the positions where log g are taken as 0.85,2.4,3.2 and 4.2.These values of log g are typical values in Section 2.
In Figure 11,we depict an H-R diagram and the corresponding log Teffversus log g diagram for 3.0 M⊙stellar evolution based on MESA,the module of mk_co_wd.In Figure 12,we display an H-R diagram and the corresponding log Teffversus log g diagram for 7.0 M⊙stellar evolution based on MESA,the module of 7M_prems_to_AGB.The input physics are default for the three stellar evolutions.Stars with masses smaller than~2.2 M⊙are called small mass stars.The central helium core is electron degenerate before ignition.Stars with masses from~2.2 M⊙to~9.0 M⊙are called medium mass stars.The central carbon/oxygen core is electron degenerate.Stars with masses larger than~9.0 M⊙are called large mass stars.The central core is nondegenerate before it becomes an iron core.The large mass stars are usually O type stars and B type stars,which are not evolved in this paper.We evolve a small mass star and two medium mass stars as examples to do a preliminary analysis and research work.At the stage of the green lines in Figures 11 and 12,the helium core inside the hydrogen burning shell shrinks rapidly,and the envelope outside the hydrogen burning shell expands rapidly.The timescales are thermodynamic and the stage is called the gap area in the H-R diagram.The stars at this stage have too short timescales to be observed.For more details about stellar structure and evolution results,refer to the tables of Schaller et al.(1992).
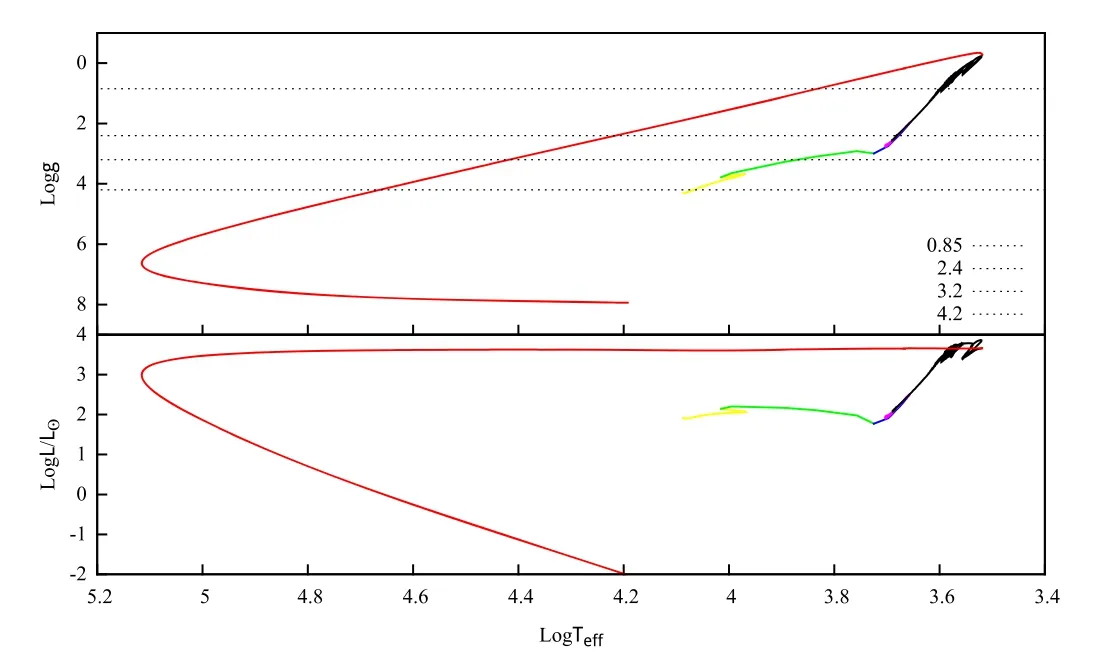
Figure 11.The H-R and corresponding log Teff versus log g diagram for 3.0 M⊙stellar evolution.The yellow,blue,pink,black and red lines represent the MS,RGB,HB,AGB and PN-WD respectively.The green line corresponds to the gap area in the H-R diagram.

Figure 12.The H-R and corresponding log Teff versus log g diagram for 7.0 M⊙stellar evolution.The gray,yellow,blue,pink,black and red lines represent the pre-MS,MS,RGB,HB,AGB and PN respectively.The green line corresponds to the gap area in the H-R diagram.
In Figures 10–12,the stars with log g less than 0.85 and Teffaround 4000 K (log 4000=3.60) are RGB or AGB stars.Combining Figures 1 and 4,we can conclude that most RGB or AGB stars with log g less than 0.85 have metal abundances Z being from 0.000063 to 0.002.They are metal-poor stars,approximately belonging to stellar Population II.The conclusion is very important for RGB and AGB stars.For example,when studying the asteroseismology of RGB stars with log g less than 0.85,more consideration should be given to the evolved RGB star models with poor metal abundances.In the upper panel of Figure 4,there are only 5276 stars with log g less than or equal to 0.85.The hydrogen burning stage accounts for nearly 90% of the stellar lifetime and the helium burning stage accounts for nearly 10% of the stellar lifetime.The central core burning process is the main process in stars.It is reasonable that among the stars,the stars with shell burning and log g less than 0.85 account for a small proportion.
At the red end of the lower panel of Figure 1,the value of log g has a gap area around 3.2.In Figure 4(the upper panel)and Figure 5 (the G type stars),there is a valley around log g=3.2.It corresponds to the RGB stars in Figure 10 for stellar evolution of a small mass star and the gap area in the H-R diagram in Figures 11 and 12 for stellar evolution of medium mass stars.The stars in the valley of Figure 5 for G type stars are mainly from RGB stars for stellar evolutions of small mass stars.The theory of the gap area in the H-R diagram for stellar evolutions of medium mass stars is consistent with the big data observation and statistical results.In the upper panel of Figure 4,there is one peak around log g=4.2 and the other peak is around log g=2.4.In Figures 10–12,the stars with log g~4.2 correspond to MS stars.The stars with log g~2.4 correspond to HB or RGB stars for stellar evolutions of small mass stars,and the HB,RGB or AGB stars for stellar evolution of medium mass stars.
Combining Figures 1 and 7,most stars with Teffhigher than 7500 K(log 7500=3.88)have log g from 3.2 to 4.8 and metal abundance Z from 0.0036 to 0.11.Except for WDs,most stars with such a large gravitational acceleration (Teffhigher than 7500 K)in Figures 10–12 are MS stars.Therefore,most A type MS stars with Teffhigher than 7500 K are metal-rich stars,approximately belonging to stellar Population I.This indicates that the metal abundances of the hot A type MS stars are not completely consistent with that of the Sun.The metal abundances,especially metal-rich abundances,should be considered in a study of hot A type MS stars.
4.Discussion and Conclusions
In this paper,we download the data of LAMOST DR8 low resolution catalog AFGK type stars and do a basic analysis based on the Teff,log g and[Fe/H]values of 6,478,063 stars.We evolve 1.0 M⊙,3.0 M⊙and 7.0 M⊙stars from the pre-MS stage or MS stage to the PN stage or WD stage by MESA.Combined with the observed statistical data and model calculation data,we draw some basic conclusions preliminarily.In the lower panels of Figures 3,6 and 9,we can see that the error ranges of Teff,log g and[Fe/H]are large.However,in the corresponding upper panels,there are 81%,79% and 84%of stars with the errors of Teff,log g and[Fe/H]less than 200 K,0.3 and 0.2 respectively.Therefore,within a certain error range,we can draw some conclusions.

Figure 13.The percentage histogram of 5276 stars (log g ≤0.85) with the error of Teff,log g and [Fe/H] distribution.In the lower panel,there are 51%,79%and 92%of stars with the error of Teff less than 100 K,200 K and 300 K respectively,including 15 negative (no error of Teff) values.In the middle panel,there are 33%,61%and 78%of stars with the error of log g less than 0.1,0.2 and 0.3 respectively,including 34 negative(no error of log g)values.In the upper panel,there are 53%,82%and 93%of stars with the error of[Fe/H]less than 0.1,0.2 and 0.3 respectively,including 14 negative (no error of [Fe/H])values.
Most RGB and AGB stars with log g less than 0.85 have low metal abundance.This provides guidance for the study of metal abundance input of RGB stars and AGB stars.In future work,we will study the effects of different metal abundances on the asteroseismology of RGB stars.There are 5276 stars with log g ≤0.85.We show the percentage histogram of 5276 stars with the error of Teff,log g and[Fe/H]distribution in Figure 13.There are a total of 32%,60%and 78%of stars with error of Teff≤100 K/log g ≤0.1/[Fe/H] ≤0.1,the error of Teff≤200 K/log g ≤0.2/[Fe/H]≤0.2 and the error of Teff≤ 300 K/log g ≤ 0.3/[Fe/H] ≤ 0.3.A certain proportion of stars with small errors can support this conclusion.
For the stellar evolutions of medium mass stars,the theory of a gap area in the H-R diagram is reflected at the red end of the lower panel of Figure 1 and the upper panel of Figure 4 around log g=3.2.In the upper panel of Figure 4,the peak around log g=4.2 corresponds to the MS stars.The peak around log g=2.4 corresponds to the HB or RGB stars for stellar evolutions of small mass stars,and HB,RGB or AGB stars for stellar evolutions of medium mass stars.Statistics affirm that the metal abundances among A,F,G and K type stars have a wide distribution.The metal abundance is an important parameter in stellar physics.In a fine research work,we cannot simply replace the metal abundance of other stars with the metal abundance of the Sun.The grid values of metal abundance for different types of stars can be referred to in Figure 8.

Figure 14.The percentage histogram of the number of 78,141 stars (Teff ≥7500 K)with the error of Teff,log g and[Fe/H]distribution.In the lower panel,there are 84%,94% and 98% of stars with the error of Teff less than 100 K,200 K and 300 K respectively.In the middle panel,there are 66%,88% and 93% of stars with the error of log g less than 0.1,0.2 and 0.3 respectively.In the upper panel,there are 85%,95%and 99%of stars with the error of[Fe/H]less than 0.1,0.2 and 0.3 respectively.
The statistical results indicate that the rich metal abundances should be considered in the study of hot A type MS stars.Most A type stars have log g from 3.5 to 4.5 according to the top panel of Figure 5.There are 78,141 stars with Teff≥7500 K and most of them are hot A type MS stars.We show the percentage histogram of the number of 78,141 stars with the error of Teff,log g and [Fe/H] distribution in Figure 14.There are a total of 66%,88% and 93% of stars with the error of Teff≤100 K/log g ≤0.1/[Fe/H]≤0.1,the error of Teff≤200 K/log g ≤0.2/[Fe/H] ≤0.2 and the error of Teff≤ 300 K/log g ≤ 0.3/[Fe/H] ≤ 0.3.A considerable proportion of stars with small error can support this conclusion.
Acknowledgments
The Guoshoujing Telescope (the Large Sky Area Multi-Object Fiber Spectroscopic Telescope,LAMOST)is a National Major Scientific Project built by the Chinese Academy of Sciences.Funding for the project has been provided by the National Development and Reform Commission.LAMOST is operated and managed by the National Astronomical Observatories,Chinese Academy of Sciences.We acknowledge the support of NSFC through grant 11803004.
 Research in Astronomy and Astrophysics2022年5期
- Research in Astronomy and Astrophysics的其它文章
- Constraining the Parameterized Neutron Star Equation of State with Astronomical Observations
- Classifying Galaxy Morphologies with Few-shot Learning
- Possibility of Searching for Accreting White Dwarfs with the Chinese Space Station Telescope
- A New X-Ray Tidal Disruption Event Candidate with Fast Variability
- Detecting and Monitoring Tidal Dissipation of Hot Jupiters in the Era of SiTian
- The Astrometric Performance Test of 80cm Telescope at Yaoan Station and Precise CCD Positions of Apophis
