A Predictive Nomogram for Predicting Improved Clinical Outcome Probability in Patients with COVID-19 in Zhejiang Province, China
Jiojio Xie, Ding Shi, Mingyng Bo, Xioyi Hu, Wenrui Wu, Jifng Sheng, Kijin Xu,Qing Wng, Jingjing Wu, Kicen Wng, Diqiong Fng, Yting Li, Lnjun Li,*
a State Key Laboratory for Diagnosis and Treatment of Infectious Diseases,National Clinical Research Center for Infectious Diseases,Collaborative Innovation Center for Diagnosis and Treatment of Infectious Diseases, The First Affiliated Hospital, College of Medicine, Zhejiang University, Hangzhou 310003, China
b State Key Laboratory of Genetic Engineering, Institute of Biostatistics, School of Life Sciences, Fudan University, Shanghai 200433, China
c Division of Hepatobiliary and Pancreatic Surgery, Department of Surgery, Key Lab of Combined Multi-organ Transplantation of the Ministry of Health, The First Affiliated Hospital, College of Medicine, Zhejiang University, Hangzhou 310003, China
d Division of of Endocrinology and Metabolism, Department of Internal Medicine System, The First Affiliated Hospital, College of Medicine, Zhejiang University, Hangzhou
310003, China
Keywords:Coronavirus disease 2019 (COVID-19)Nomogram Patient-relevant outcome
ABSTRACT The aim of this research was to develop a quantitative method for clinicians to predict the probability of improved prognosis in patients with coronavirus disease 2019 (COVID-19). Data on 104 patients admitted to hospital with laboratory-confirmed COVID-19 infection from 10 January 2020 to 26 February 2020 were collected. Clinical information and laboratory findings were collected and compared between the outcomes of improved patients and non-improved patients. The least absolute shrinkage and selection operator (LASSO) logistics regression model and two-way stepwise strategy in the multivariate logistics regression model were used to select prognostic factors for predicting clinical outcomes in COVID-19 patients.The concordance index(C-index)was used to assess the discrimination of the model,and internal validation was performed through bootstrap resampling. A novel predictive nomogram was constructed by incorporating these features. Of the 104 patients included in the study (median age 55 years),75(72.1%)had improved short-term outcomes,while 29(27.9%)showed no signs of improvement. There were numerous differences in clinical characteristics and laboratory findings between patients with improved outcomes and patients without improved outcomes.After a multi-step screening process, prognostic factors were selected and incorporated into the nomogram construction, including immunoglobulin A (IgA), C-reactive protein (CRP), creatine kinase (CK), acute physiology and chronic health evaluation II (APACHE II), and interaction between CK and APACHE II. The C-index of our model was 0.962 (95% confidence interval (CI), 0.931–0.993) and still reached a high value of 0.948 through bootstrapping validation.A predictive nomogram we further established showed close performance compared with the ideal model on the calibration plot and was clinically practical according to the decision curve and clinical impact curve. The nomogram we constructed is useful for clinicians to predict improved clinical outcome probability for each COVID-19 patient, which may facilitate personalized counselling and treatment.
1. Introduction
Coronavirus disease 2019 (COVID-19), caused by severe acute respiratory syndrome coronavirus 2 (SARS-CoV-2), has been regarded as a pandemic disaster, while cases continue to rise globally [1–5]. SARS-CoV-2, which has been identified as a β-coronavirus, a clade in the rotavirus subgenus belonging to subfamily of the orthodox coronavirus, has a similar phylogeny to two other β-coronavirus: severe acute respiratory syndrome coronavirus (SARS-CoV) and Middle East respiratory syndrome coronavirus (MERS-CoV). β-coronaviruses that are zoonotic in origin have been linked to potentially fatal illness during outbreaks in 2003 and 2012, respectively [6,7].
By 3 March 2020, the total number of infections and deaths caused by COVID-19 had risen sharply to over 83 000 worldwide.The incubation period is 2–14 d from COVID-19 infection to the onset of symptoms. Clinical manifestations are very similar to those of SARS, including fever, cough, nausea, and vomiting. However,some COVID-19 patients have no fever or radiological abnormalities at the beginning, which complicates the diagnosis.Laboratory findings indicate that lymphocytopenia(83.2%),thrombocytopenia (36.2%), leukopenia (33.7%), and elevated levels of Creactive protein(CRP)are the most common characteristics among patients with COVID-19 [8]. According to current evidence, the mortality rate of COVID-19 is about 3%, and deaths mainly occur in older patients or those with coexisting diseases [9,10]. There is no doubt that early management may make a significant contribution to reducing mortality.Previous studies have demonstrated the general epidemiological and clinical characteristics as well as potential rapid diagnostics, vaccine, and therapeutics of COVID-19 pneumonia [11,12]. However, the association of demographic traits, laboratory indicator levels, and examination results with outcome improvement remains unclear. Furthermore, current exploration of the underlying factors for early intervention and prognosis of COVID-19 is still insufficient.
In our study, we aimed to develop a quantitative method for clinicians to predict the probability of improved prognosis in each COVID-19 patient. A total of 104 patients with laboratoryconfirmed COVID-19 infection in Zhejiang Province were divided into two groups based on whether the outcome improved. A least absolute shrinkage and selection operator(LASSO)logistics regression model was used to select the optimal prognostic indicators from the clinical characteristics and laboratory findings of COVID-19 cases.A further filter was conducted by a two-way stepwise strategy in the multivariate logistics regression model. The final COVID-19-related predictive model consists of five prognostic factors. A nomogram was eventually constructed to predict the probability of outcome improvement by incorporating these variables. This work has created an effective nomogram for improved prediction of COVID-19 patients, which can be used to optimize treatment strategy.
2. Methods
2.1. Data sources
We obtained the medical records and compiled data for patients with laboratory-confirmed COVID-19 according to World Health Organization (WHO) interim guidance [13] from 10 January 2020 to 26 February 2020. All of the cases enrolled in this study were confirmed by the laboratory to be COVID-19 infection based on real-time reverse transcriptase-polymerase chain reaction (RTPCR) assay of nasal and pharyngeal swab specimens. We collected data on 104 patients admitted to hospital with laboratoryconfirmed COVID-19 infection at the First Affiliated Hospital,Zhejiang University, Zhejiang Province, China. Information was collected on electronic medical records,interviews of investigators,and hospital admissions.The data were reviewed by a trained team of physicians. The days of onset of symptom to diagnosis were counted from the illness onset to the laboratory confirmation of COVID-19 infection. We defined the degree of severity of COVID-19 at the time of admission using the acute physiology and chronic health evaluation II(APACHE II)[14].Exposure history means having close contact(gathering,living,or working together)with individuals with confirmed or suspected COVID-19 infection during the two weeks before illness onset. Familial clusters were defined as patients who infected others in their families. All patients were classified into three grades(moderate/severe/critical)based on the Guidelines for diagnosis and treatment of novel coronavirus pneumonia(trail version 7) [15].Fever was defined as an axillary temperature of 37.3 °C or higher. Chest radiography or computed tomography (CT) and all laboratory testing were performed according to the clinical care needs for the patient.We determined the presence of a radiologic abnormality on the findings of bilateral or multiple lobular or subsegmental areas of consolidation or bilateral ground glass, and ranked the scores based on the numbers of involved pulmonary segments: 1 (normal); 2 (1–2); 3 (3–5); 4(>5). All measures of arterial pressure and partial pressure of carbon dioxide were recorded by professional physicians.
2.2. Laboratory confirmation
Sputum and throat swab specimens were collected from all patients at admission. Laboratory confirmation of the virus was performed by RT-PCR assay for COVID-19 ribonucleic acid (RNA)within 3 h. Virus detection was repeated twice every 24 h. All laboratory tests were performed according to the clinical care needs of the patient. Laboratory assessments consisted of a complete blood count; blood chemical analysis; coagulation testing;assessment of liver and renal function; and measures of CRP, procalcitonin (PCT), lactate dehydrogenase, creatine kinase (CK),inflammatory cytokines, complement, and immunoglobulin.
2.3. Statistical analysis
Patients were divided into two groups based on whether the outcomes improved. The following two conditions were defined as outcome improvement: ①Severe patients who were admitted to the intensive care unit(ICU)at the beginning of hospital admission alleviated after treatment and were transferred out of the ICU to general isolated wards; and ②those with mild illness at the time of hospital admission were discharged or were going to be discharged at the end of the follow-up. Conversely, patients who received continuous treatment in the ICU or subsequent transition to the ICU due to exacerbation were considered to have nonimproved outcomes.
Normally distributed continuous variables were described as means with standard deviations (SD), and parametric t-tests were used to test for statistical significance between the two groups;otherwise, medians with interquartile range (IQR) and nonparametric Mann–Whitney U tests were applied for variable description and two comparisons, respectively. For categorical variables, we expressed the numbers and percentages of patients in each category. Proportions were compared using the χ2test,with Yates’ correction or Fisher’s exact test.
LASSO logistics regression analysis was performed to select the optimal prognostic indicators from demographic characteristics,examinations, coexisting conditions, symptoms, and laboratory findings for COVID-19 patients.The logistics regression model with the LASSO penalty successfully achieved dimensionality reduction.The optimal value of the penalty parameter λ was adopted and variables with nonzero coefficients in the model were selected. A further filter was conducted by a two-way stepwise strategy in the multivariate logistics regression model. Interaction between every two pair of variables was taken into account. Moreover,the concordance index (C-index) was computed to evaluate the discrimination performance of our model. A relatively corrected C-index was calculated by 1000 bootstrap resampling for validation. Given the wide range of laboratory indicators, we further divided them into quartiles as categorical variables in order to assess their association with the probability of improvement. In addition, patients were classified into four age groups: <40,40–54, 55–69, and ≥70 years, in order to investigate the effects of age on the outcome.
After a multi-step screening process,the final prognostic factors were used to construct a nomogram for predicting the probability of outcome improvement. According to the regression coefficient,each variable that was included corresponded to a point at each value. A total point was equal to the sum of the points of all variables for each patient. The relationship between the total points and the probability of outcome improvement was visualized on the bottom of the nomogram. Calibration curves were subsequently drawn to assess the agreement between the nomogrampredicted probability and the actual proportion.As a reference line,the diagonal represents the best prediction. Moreover, we performed a decision curve analysis to determine whether our established nomogram was suitable for clinical utility by estimating the net benefits at different threshold probabilities.The clinical impact curve was drawn to predict improved probability stratification for a population size as 1000.
A two-sided P value<0.05 was considered to be statistically significant. All statistical analyses were performed using R 3.6.1 software.
3. Results
3.1. Patients’ characteristics
Clinical characteristics were collected from 104 patients with laboratory-confirmed COVID-19 who were admitted to our hospital by 26 February 2020 (Table 1). The median age was 55 years(IQR: 43–64) and 60.6% of patients were male (63). The median duration from the onset of symptoms to diagnosis was 5 d (IQR:2–7).Of the 104 patients,80 (76.9%)had been exposed to individuals with confirmed COVID-19 infection. Half of the cases showed a familial cluster. After a preliminary medical examination, we detected intestinal flora disorders, bacterial infection, fecal RNA positive, and acute respiratory distress syndrome (ARDS) in 9(8.7%),13(12.5%),29(27.9%),and 16(15.4%)patients,respectively.The median APACHE II score was 6 (IQR: 3–11) on the day of hospital admission, and more than half of the patients were assessed as grade 4 from the results of the chest CT scan. Moderate, severe,and critical patients each accounted for approximately one third ofthe total,respectively.Furthermore,hypertension(39(37.5%))was the most common coexisting medical condition, and 31 (29.8%)patients suffered from other comorbidities, such as stroke, coronary heart disease,and dyslipidemia.The most common symptom at the onset of illness was fever(88(84.6%)),followed by cough(84(80.8%)), expectoration (49 (47.1%)), and chest distress (47(45.2%)).
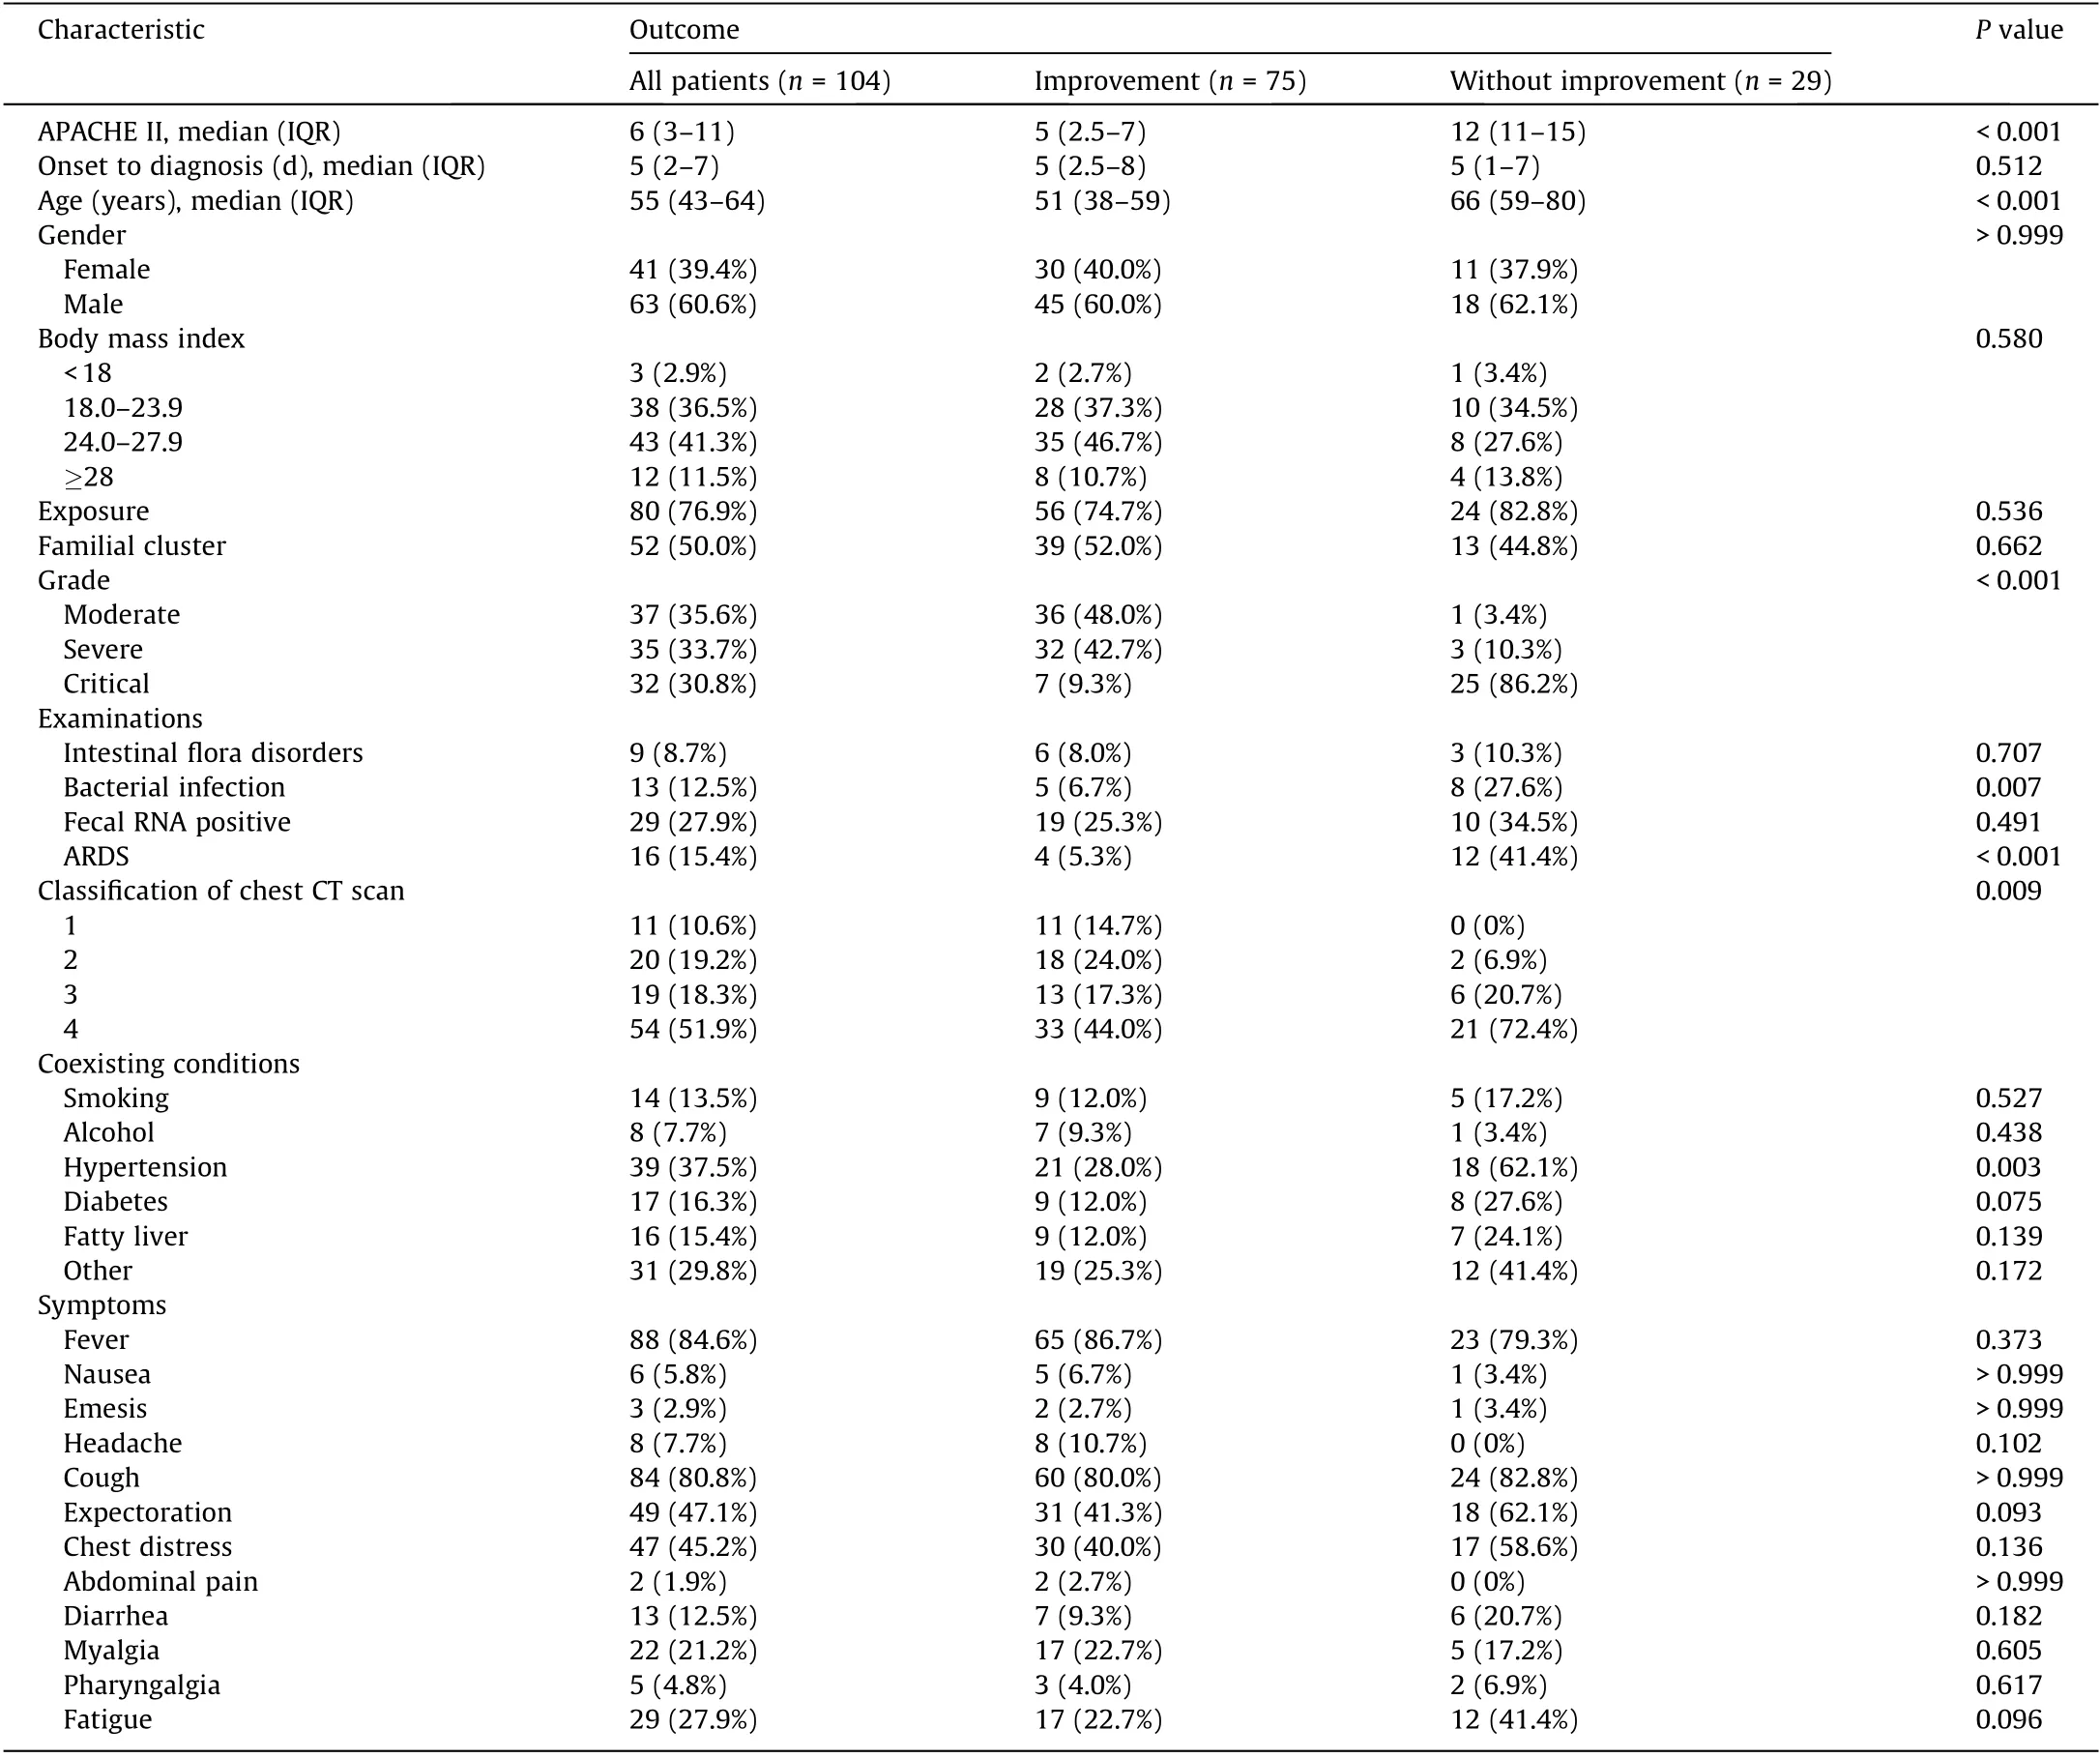
Table 1 Demographic and clinical characteristics of 104 patients with laboratory-confirmed COVID-19.
Of these patients, 75 (72.1%) had improved outcomes by 26 February 2020, while another 29 (27.9%) showed no signs of improvement. Compared with the improved patients, those with developing illness had significantly higher APACHE II scores (12(IQR: 11–15) vs 5 (IQR: 2.5–7); P < 0.001) and were significantly older (66 years (IQR: 59–80) vs 51 years (IQR: 38–59);P < 0.001). The proportions of critical illness, bacterial infection,ARDS, and high CT classification in cases without improvement were higher than those in cases with improvement.Patients without improvement were more likely to have hypertension than those with improvement (18 (62.1%) vs 21 (28.0%); P = 0.003).However, no significant difference in symptoms between the two groups of patients was observed (Table 1).
3.2. Laboratory findings
There were numerous differences in the laboratory findings between the improved and non-improved patients (Table 2). The median of the ratio of partial pressure of oxygen(PaO2)to fraction of inspired oxygen (FIO2) was significantly higher in the improved samples than in the non-improved samples (288.8 (IQR: 234.2–390.7) vs 205.9 (IQR: 141.8–289.4); P = 0.005). In terms of routine blood tests, there were significant differences in hemoglobin, redblood cell count, and three types of white blood cell counts. Many biochemical indicators also showed significant differences between the two groups, such as aspartate aminotransferase, creatine kinase isoenzymes-myocardial band (CKMB), glomerular filtration rate, and CK. CRP, PCT, and two inflammatory cytokines,increased significantly in cases without improvement, and were much higher than the upper limit of the normal range. Regarding immune-related proteins, more interleukin (IL)-6 and IL-10 were secreted in cases without improvement. The levels of immunoglobulin G (IgG) and immunoglobulin A (IgA) were lower in improved patients than in non-improved patients (Table 2).
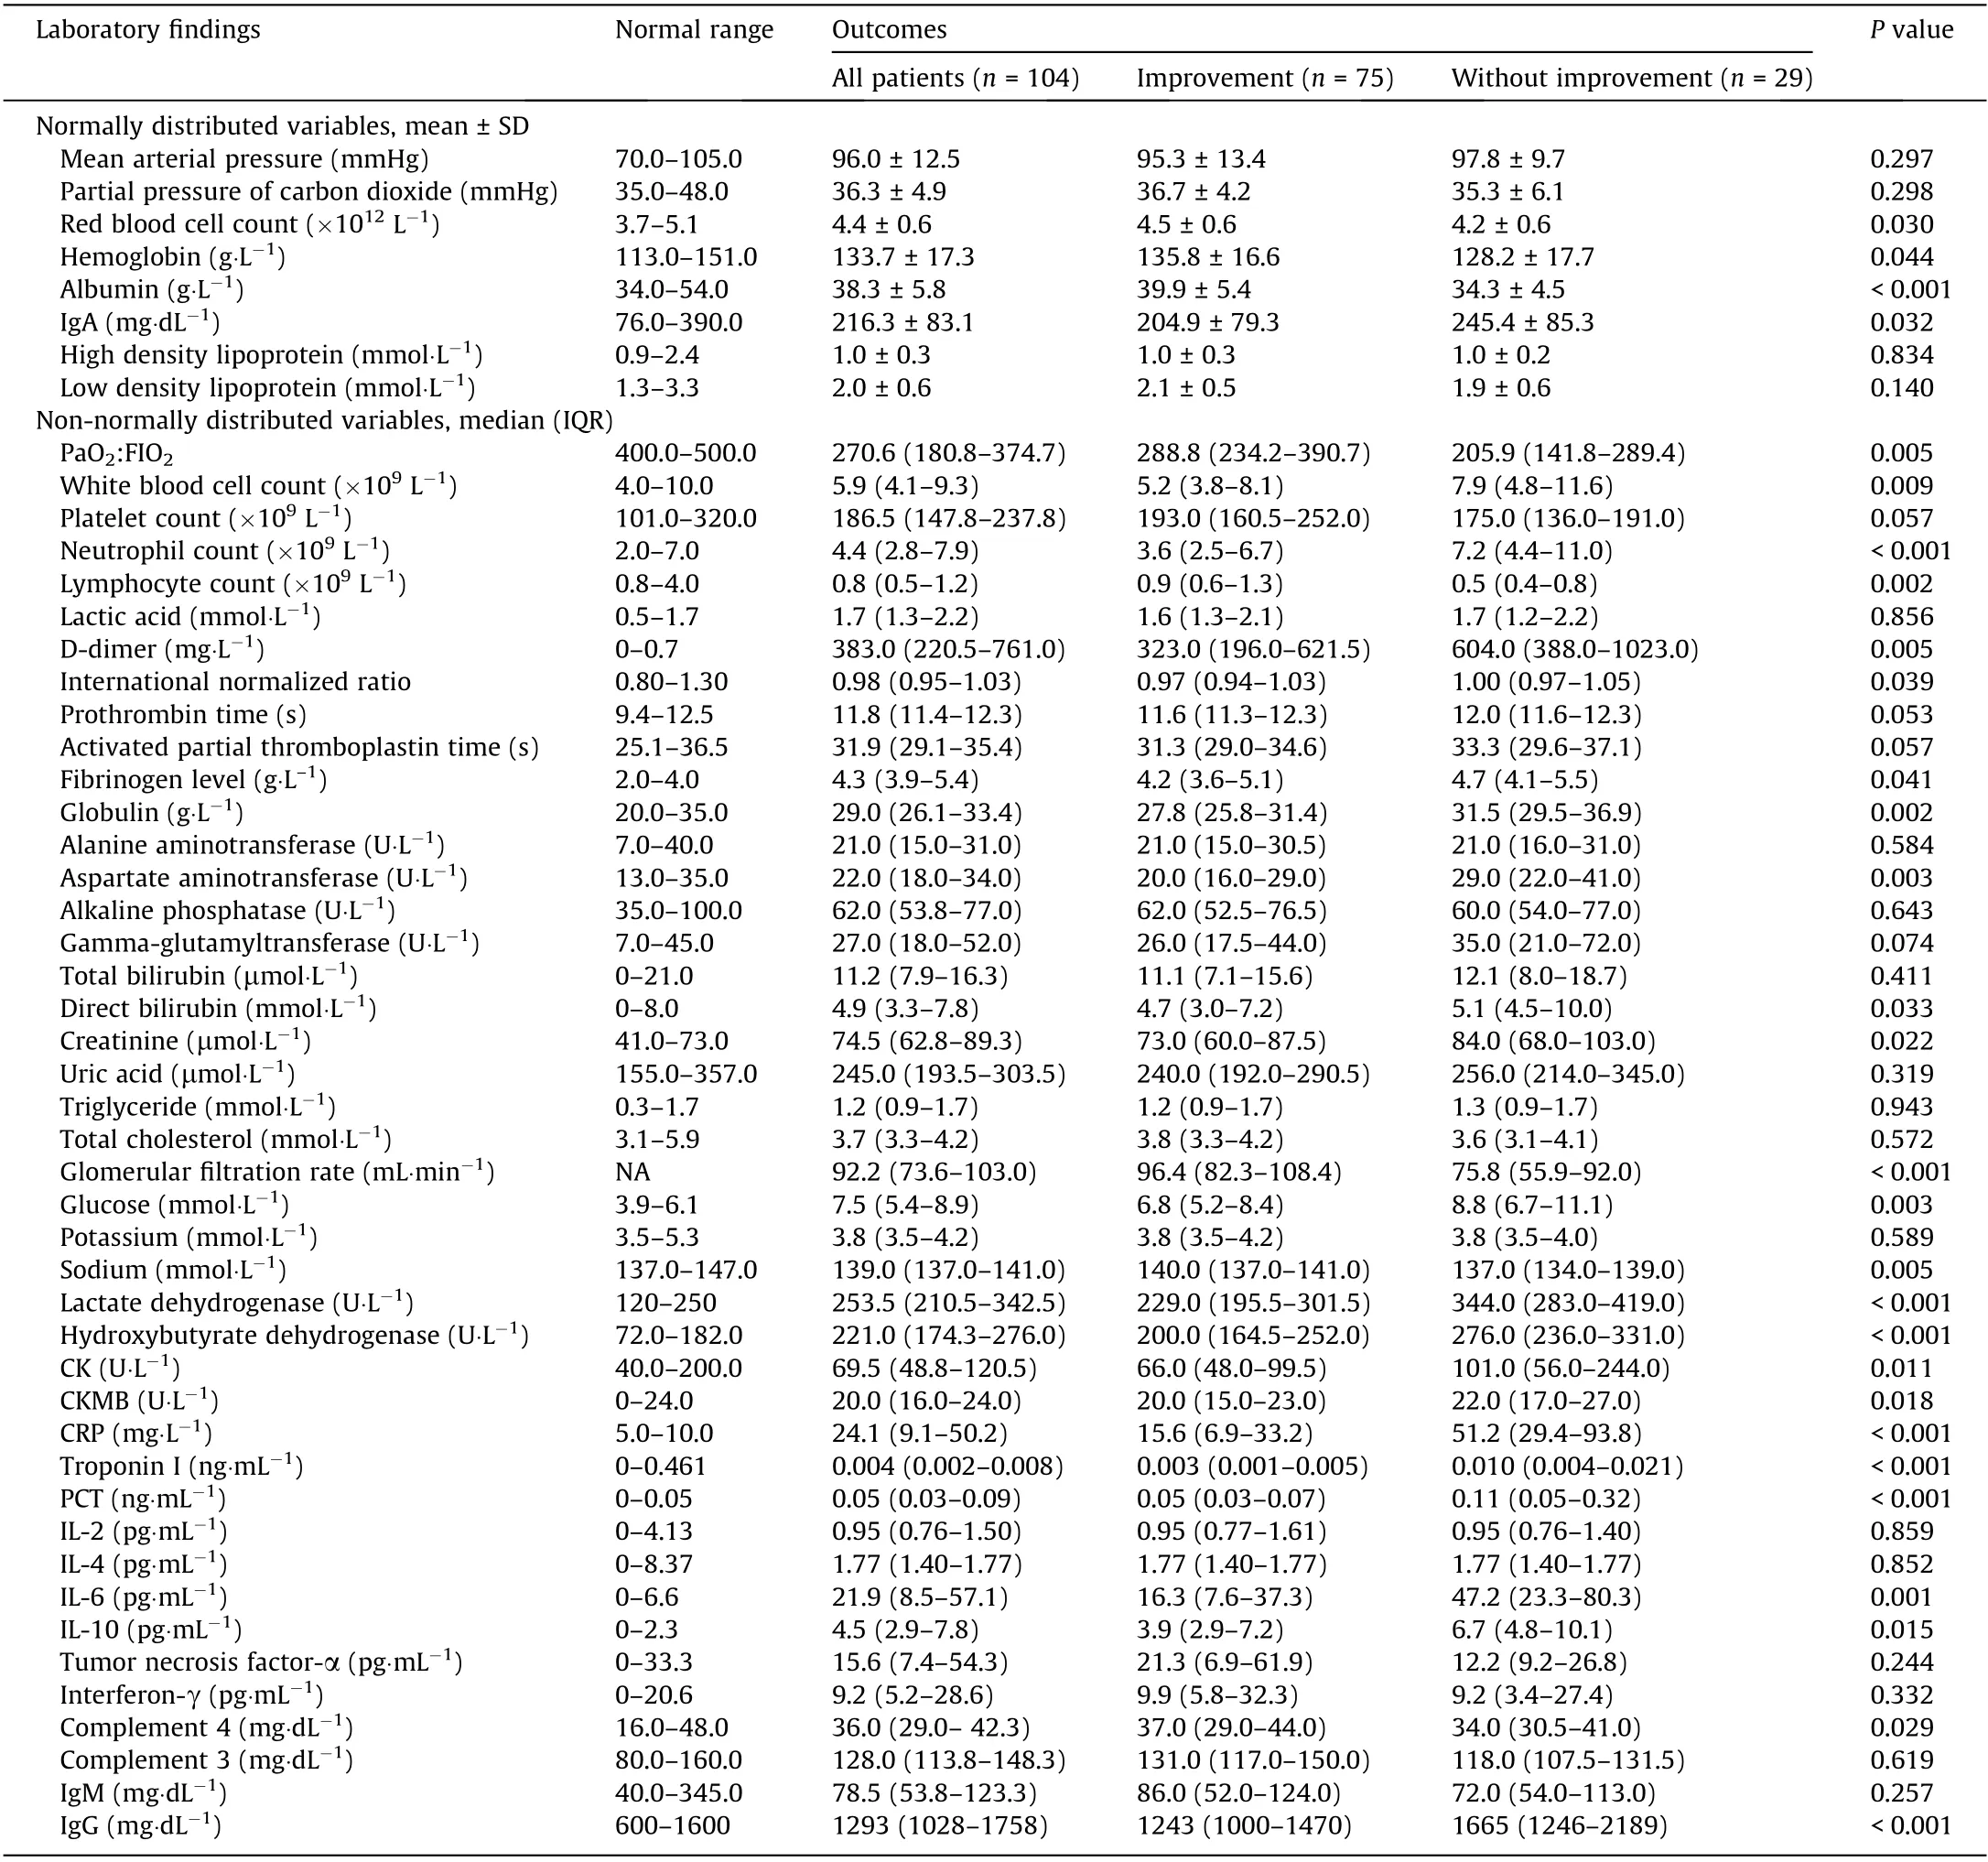
Table 2 Laboratory findings of 104 patients with confirmed COVID-19 infection.
3.3. Selection of prognostic predictors
All of the demographic characteristics,examinations,coexisting conditions, symptoms, and laboratory findings described above were included in the LASSO logistics regression model to screen the potential predictors. Changes in the LASSO partial likelihood deviance and coefficients with lnλ are shown in Fig. 1. As a result,11 variables with nonzero coefficients were selected,including age,grade,headache,APACHE II,activated partial thromboplastin time,CK, CKMB, CRP, PCT, IgA, and IgG. These variables were subsequently filtered in the multivariate logistics regression model with a two-way stepwise strategy.Finally,the model including IgA,CRP,CK, and APACHE II reached the minimal Akaike information criterion (AIC), which indicated the best goodness of fit. The result of the interaction analysis revealed that there was an interaction between CK and APACHE II. Serum CK was log-transformed due to high skew to the right in this group of patients (Table 3). Furthermore, the C-index of our logistics regression model was 0.962 (95% confidence interval (CI), 0.931–0.993) and was corrected to 0.948 through bootstrapping validation, which showed that the model had good predictive power.
3.4. Association of IgA, CRP, CK, and age with improved outcomes
Serum levels of IgA, CRP, and CK were divided into quartiles as categorical variables. The median and proportion of improved patients in each quartile are presented in Table 4. Compared with the first quartile of IgA(reference),the probability of improvement decreased by the quartile of IgA level: The odds ratios (ORs) were 0.37 (95% CI, 0.07–1.54) for the second quartile, 0.25 (95% CI,0.05–0.97) for the third quartile, and 0.20 (95% CI, 0.04–0.76) for the fourth quartile. Significant results from the trend test also confirmed the relationship between IgA levels and improved outcomes. Similar results were obtained from the performance of the same analyses on CRP and CK levels, as shown in Table 4. In addition, OR was 0.032 (95% CI, 0.001–0.564) for the ≥70 years of age group compared with the youngest group, suggesting that the elderly had greater difficulty recovering from the illness. The trend examination showed an association between increasing age and a reduction in the likelihood of prognosis improvement,although no significant effects on disease relief were observed in the second and third age groups compared with the first age group(Table 5).
3.5. Clinical utility of a nomogram
Based on the results of the multivariate logistics regression analyses, we further constructed a nomogram by combiningprognostic factors including IgA,CRP,CK,APACHE II,and the interaction between CK and APACHE II. A quantitative method was made accessible for clinicians to predict the probability of improved prognosis in each COVID-19 patient(Fig.2).Each patient is given a point for each prognostic parameter,and the distribution of the score is shown in a density plot.The higher the total number of points, the more likely the patient is to improve.Moreover, calibration curves demonstrated that the nomogram had a similar performance compared with the ideal model. The apparent curve confirmed the good prediction capability of our nomogram(Fig. 3). In addition, the decision curve showed that making use of this nomogram for predicting the probability of improved prognosis would gain more net benefits than an all-or-none patient intervention scheme if the threshold probability was less than 88%, which suggests a high potential for clinical application(Fig. 4). Stratification of the improvement probability for 1000 samples was predicted on the clinical impact curve (Fig. 5). The predictive improved number was close to the actual number of positive cases when the threshold probability was greater than 0.2. At this time, the cost-to-benefit ratio was 0.25.

Table 3 Predictive variables for the probability of improved outcomes.

Table 4 Association of ascending quartiles of IgA, CRP, and CK levels with improved outcomes.

Table 5 Correlation between increasing age and improved outcomes.
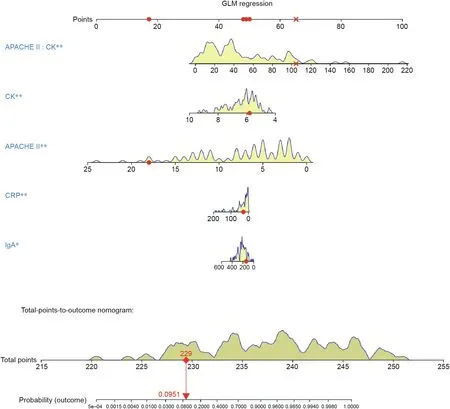
Fig. 2. Nomogram to predict probability of improved outcomes in COVID-19 patients. Yellow density plots describe the distribution of COVID-19 patients in prognostic parameters and total points. Yellow density plots describe the distribution of COVID-19 patients in prognostic parameters and total points while the red dots and cross represent one patient’s points as an example. GLM: general multivariate regression. *: P ≤0.05, **: P ≤0.01.
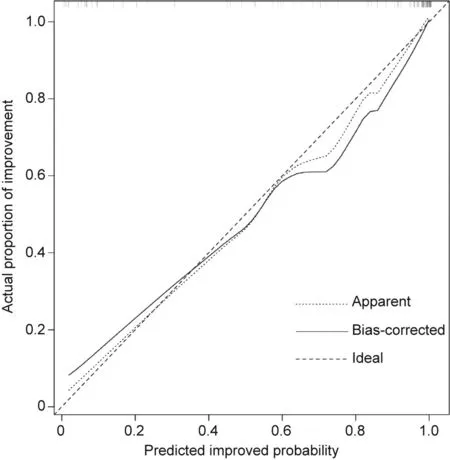
Fig. 3. Calibration curve for the nomogram to predict probability of improved outcomes. The x-axis represents the predicted improved probability and the y-axis denotes the actual proportion of improvement. The diagonal dotted line indicates the best prediction by an ideal model.The apparent line represents the uncorrected performance of the nomogram while the solid line shows the bais-corrected performance. 1000 bootstrap repetitions; mean absolute error = 0.029; n = 104.
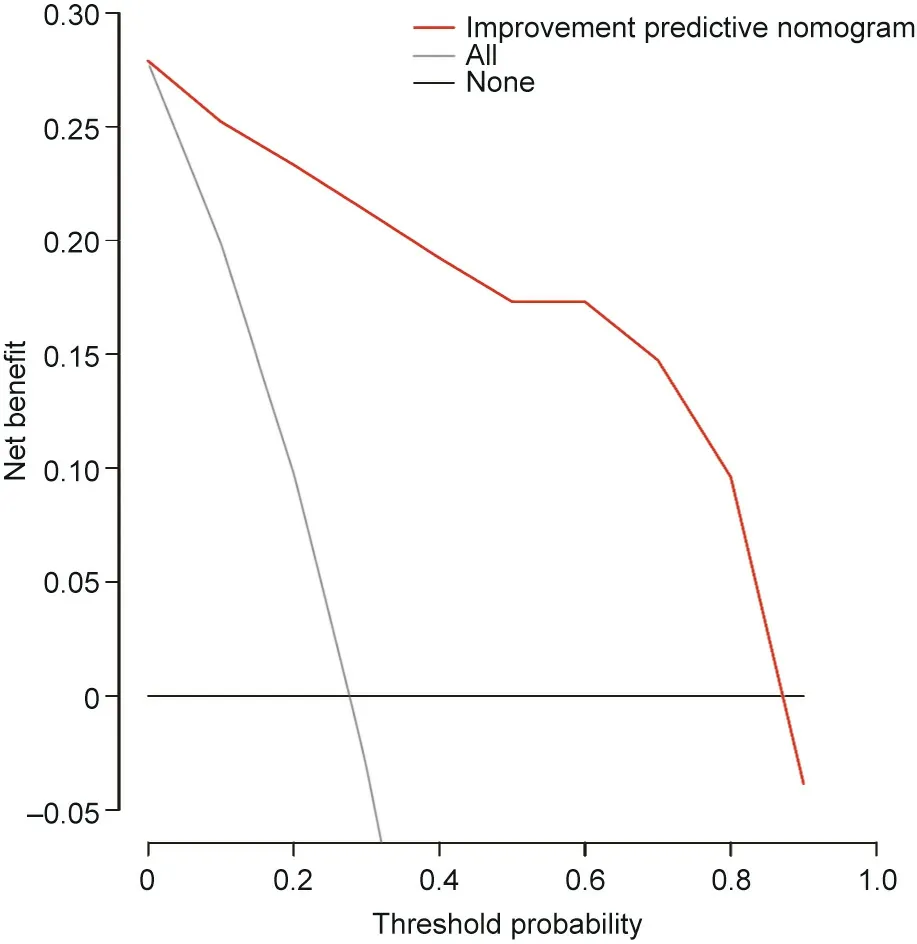
Fig.4. Decision curve for the improvement predictive nomogram. The net benefits were measured at different threshold probabilities. The red line represents the improvement predictive nomogram. The gray line represents the assumption that all patients have improved outcomes.The black line represents the assumption that no patients have improved outcomes.
4. Discussion
Despite worldwide efforts to contain the new coronavirus, hotspots continue to emerge,and the number of cases is on the rise.As of 2 March 2020, the SARS-CoV-2 has infected over 90 900 people and killed 3118 [10]. Although recently published articles have reported the clinical, virological, and epidemiological characteristics of patients with COVID-19 [5,11], few studies have focused on prognostic indicators or risk factors. Thus, we constructed this predictive nomogram using individual factors to make accurate prognostic assessments in order to quantitatively predict clinical outcomes in a personalized way. This is an urgent, user-friendly,and easy-to-use method.
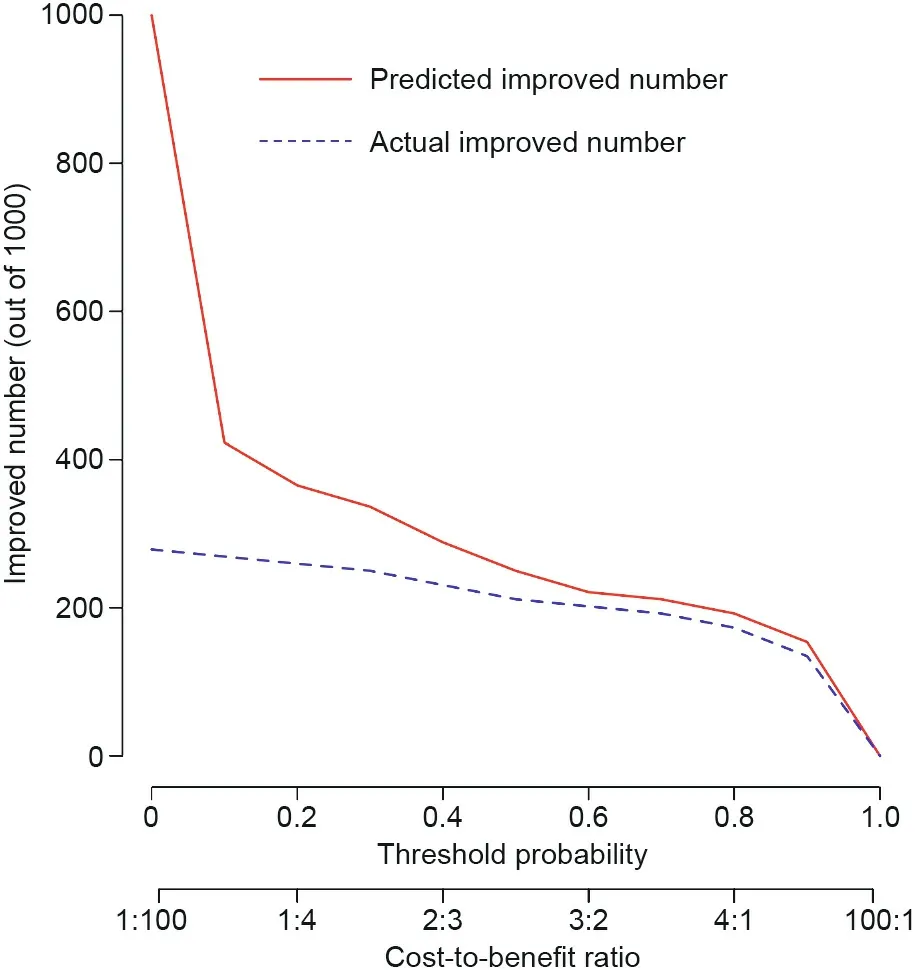
Fig. 5. Clinical impact curve to predict the improved number for a population size of 1000.The red curve shows the predicted improved number at different threshold probabilities and the blue curve represents actual improved patients.
We reported on 104 patients, of which 75 had improved outcomes and 29 did not. The nomogram established in this study suggested five prognostic factors for predicting the outcome:APACHE II, CK, CRP, IgA, and the interaction between CK and APACHE II. Similar to previous findings for 51 patients with MERS-CoV infection [16], we found that the widely used disease classification system APACHE II in the ICU[14]was associated with the prognosis, with higher APACHE II scores leading to worse outcome.The APACHE II score was calculated using the acute physiology score (APS), chronic physiology score (CPS), and age. Several factors included in the APS showed significant differences between improved patients and those without improvement, according to our results.Vital signs and laboratory parameters have also shown significant differences between ICU and non-ICU patients with COVID-19[11].Moreover,researchers have reported comorbidities and age as risk factors of severity and mortality in patients with SARS-CoV [17,23] and MERS-CoV infection [18–22].
In addition,CK was at a higher level for patients admitted to the ICU [11], which was consistent with our model’s prediction. This finding may be attributed to muscle damage caused by COVID-19, similar to changes in SARS [23]. While muscle weakness and elevated levels of serum CK occurred in more than 30% of the SARS-infected patients, focal myofiber necrosis was observed in a series of postmortem cases[23].As for COVID-19,the first autopsy revealed a gray-red fish-shaped myocardial section. However, it remains uncertain whether this myocardial damage was due to an original heart disease or a viral infection, and further research is needed. We speculate that myopathy is also likely to play an important role in COVID-19. In patients with MERS-CoV, CRP is a common predictor of the development of pneumonia and respiratory failure associated with thrombocytopenia and lymphocytopenia [24]. Similarly, CRP may be related to enhanced inflammation and cytokine storms caused by COVID-19 invasion.
Interestingly, although IgA has been acknowledged as the first barrier against the virus in the respiratory tract due to the mucosal immune system,a higher IgA level led to worse outcomes based on our findings [25]. This might result from the fact that the IgA we measured was from blood, rather than secretory IgA (sIgA) from the mucus. Unlike sIgA, serum IgA can cause antibody-dependent cell-mediated cytotoxicity(ADCC),lead to degranulation of eosinophils and basophils, result in phagocytosis by monocytes, macrophages, and neutrophils, and trigger respiratory burst activity by polymorphonuclear leukocytes [26], which may be related to sustained inflammatory response and cytokine storm. The three pathological mechanisms associated with the prognostic factors selected in our study—namely, sustained inflammatory response,cytokine storm, and direct effects of the virus—are likely to have negative effects on outcome improvement.
Thus far, a specific treatment method for coronavirus infection has not been found.It is important to identify risk factors that can predict and improve patient prognosis through personalized treatment methods.Therefore,we constructed this nomogram to quantitatively measure the severity of infected patients and predict the subsequent outcomes of infected patients. For high-risk patients,early use of high-flow oxygen therapy, non-invasive ventilation,or even invasive ventilation is recommended.
5. Limitations of this study
First, the number of patients in this study limits further enhancement of the predictive power of our nomogram. Second,we could not determine the final outcome of some patients because their condition was still changing as of the study submission. Third, all patients were admitted to our hospital in Zhejiang Province,which likely resulted in regional limitations.This predictive nomogram requires further validation at different centers in the future.
Acknowledgments
This work was supported by the research on the prevention and clinical treatment in patients with COVID-19 (2020C03123), a funding of the Zhejiang Provincial Department of Science and Technology; the National Natural Science Foundation of China(81790631);and the National Key Research and Development Program of China (2018YFC2000500).
Ethical approval
This study was approved by the Ethics Committee of the First Affiliated Hospital, Collegue of Medicine, Zhejiang University(2020IIT A0040).
Compliance with ethics guidelines
Jiaojiao Xie, Ding Shi, Mingyang Bao, Xiaoyi Hu, Wenrui Wu,Jifang Sheng, Kaijin Xu, Qing Wang, Jingjing Wu, Kaicen Wang,Daiqiong Fang, Yating Li, and Lanjuan Li declare that they have no conflict of interest or financial conflicts to disclose.
- Engineering的其它文章
- Editorial for the Special Issue on 6G Requirements, Vision, and Enabling Technologies
- The Drive for Electric Motor Innovation
- Direct Air Carbon Capture Takes Baby Steps—Giant Strides Are Needed
- Start-Ups Seek to Accelerate Path to Nuclear Fusion
- 6G:Ubiquitously Extending to the Vast Underwater World of the Oceans
- Industrial Wireless Control Networks: From WIA to the Future

