Applicability of unique scarf joint configuration in friction stir welding of AA6061-T6: Analysis of torque, force, microstructure and mechanical properties
Durjyodhn Sethi , Uttm Achry , Shshnk Shekhr , Brnik Sh Roy
a Department of Mechanical Engineering, National Institute of Technology Agartala, Barjala, Jirania, West Tripura, Pin-799046, India
b Department of Materials Science and Engineering, Indian Institute of Technology Kanpur, Kanpur, 208016, India
Keywords:Friction stir welding Joint configuration Al alloys Force and torque Microstructure Mechanical property
ABSTRACT The present research introduces a unique concept of scarf joint technique in friction stir welding(FSW)of aluminum alloy AA 6061-T6 plates and an investigation on weld quality. A new joint configuration with two distinct scarf angles(75° and 60°)was considered in this study.The various aspects of welding were compared with contemporary simple square butt(SSB)joint configuration.Welding was carried out at a constant tool rotation speed(TRS),tool traverse speed(TTS)and tool tilt angle of 1100 rpm, 2 mm/s and 2°, respectively. The results are analyzed in terms of force and torque distribution, microstructure,macrostructure,and mechanical property perspective for different joint configurations.The study reveals the minimum amount of force and torque at 60° scarf angle joint configuration compared to that of square butt joint configuration.Macro study shows that all the joints were defect-free,and a prominent onion ring was present in the lower portion of the weld nugget (WN). Fine equiaxed grains with a minimum average grain size diameter of 6.82 μm were obtained in the WN of scarf joint configuration(SJC).The maximum ultimate tensile strength(UTS)and maximum average NZ hardness of 267 MPa and 83.82 HV0.1 were obtained in SJC3 at a scarf angle of 60°.It has been observed from the investigation that the joint efficiency increases from 72.5%(SSB)to 86%(SJC3)at a 60° scarf angle.This unique characteristic may lay an impetus on probable joint strength enhancement technique without increasing the production cost.
1. Introduction
Heat treatable AA6061-T6 alloys possess superior characteristics like high specific strength, plasticity, good corrosion resistance,high electrical, and thermal conductivity [1,2]. This marks suitable for wide use in pipeline application, marine frame, supersonic cruise missile applications, aircraft landing mat, light-weight defence vehicle, rocket, missile casing, design of armour structures, wings and fuselages application [3-5]. Friction stir welding(FSW)is a solid state welding technique established by TWI in the year 1991[6,7].In FSW,welding take place below the melting point of the base material as the temperature generate during the welding process is less compared to the base material [8]. In FSW,the amount of material melt is less as compare to conventional fusion welding process as the material joined by frictional heat and plastic deformation of the process[9].So energy utilization in FSW is less compared to the conventional welding technique[10].FSW is environmentally friendly, green and clean manufacturing process as no harmful and radiation gases produce during welding[11-13].The process possesses vast potentiality in joining materials that are unweldable by the conventional method[14,15].The details of the process can be found elsewhere[16-18].FSW is usually applied to joining of different types of similar or dissimilar materials such as aluminum, titanium, copper, polymers, magnesium, few ferrous materials, and composite material due to its advantages over the traditional welding process [19-24]. FSW finds its application in the automotive,aerospace,shipbuilding,marine,and railway sector[20,25,26].The FSW joint standard depends on various factors like the process parameters ((TRS), (TTS), (TTA), axial force), tool material, and design, workpiece material, etc.
Till date, many research works have been accomplished to investigate the quality of the weld joint by varying the aspects mentioned above [27-40]. Recently, few studies have been performed to investigate the formation of different defects in the weldment joint using different joint configurations through FSW[41-46]. From the overall outcome of those studies, it has been found that the inappropriate choice of process parameters,type of joint configuration, and tool design used for particular welding leads to the formation of such defects. Literature review also suggests that the joint configuration in welding plays an indispensable role in defining the weld joint’s standard. But as per the ultimate knowledge of the author, it is one of the least focused areas. The typical joint configurations generally used in FSW are simple square butt(SSB),lap joint,T-joint,corner joint,etc.The above discussion suggests that work may be carried out to explore the feasibility of different modified joint configurations, which may help overcome various FSW problems. However, as per the formation of FSW defects is concerned,it can be overcome by adopting a lower traverse speed or higher rpm.But this condition will add a higher amount of heat in the weldment, which may not be favourable to join the softer nonferrous metals,and its alloys.Thus,the selection of joint design configuration may act as another option to rectify this sort of defect in the welding.
A scarf joint is one such configuration where the joint surface area is much larger than the cross-sectional area.With the change in scarf angle, the surface area of the faying surface also varies. In FSW, during the process, the material from the faying surface first transport from the advancing side (AS) to the retreating side (RS)and vice-versa.In this sense,providing a higher faying surface area will facilitate a larger amount of material transport from the faying area of one plate to another. Additionally,to achieve a sound weld joint in FSW,healthy material transportation is very much needed.So, the combination of both the points jointly influence of scarf angle on the joint strength in FSW. Till date, this type of joint configuration was generally used in the joining of polymers in the adhesive bonding technique.Liao et al.[47]studied the influence of adhesive type, adhesive thickness, and scarf angle on mechanical property of the adhesive scarf joint configuration.The observation concludes that the scarf angle is one of the significant controlling factor that controls the scarf joint’s strength. Goel et al. [48]investigated the influence of different pin profiles on the mechanical and microstructural property of FSWed butt, and scarf joint configuration on AA6063 alloy by considering a 26scarf angle. From the investigation, they concluded that the mechanical property of the scarf joint welds could be increased by choosing a suitable inclination angle,proper plunge depth,and plate position.
Besides the joint configuration, the weld joint quality is also affected by the spindle torque(Sp.Torque),and different forces(Xforce and Z-force)induced in the weld zone during the process.It is also the result of the combined effect of material properties,process parameters, and to some extent, the plate dimensions. The Sp.Torque generated during welding plays a significant role in the weld characteristics as the degree of stirring defines the extent of plastic deformation of the material.During the plunging of a tool in the workpiece material, it experiences two distinct process forces,viz. a) vertical downward force (Z-Force), which acts axially and tries to consolidate the deformed material in the weld zone and b)Transverse force(X-force),which is due to the resistance provided by the workpiece material. Ramulu et al. [49] studied the effect of process parameters on defect formation, force, and torque generation in friction stir welding of AA6061 sheet.It has been observed that defect free welding is produced at higher rotation speed,higher welding speed, and higher plunge depth. Also, they observed that axial force and torque increase with an increase in shoulder diameter, and welding speed, whereas axial, force and torque decrease with increasing the rotation speed.Recently,Banik et al. [50] investigated the effect of TTS on force and torque distribution with similar tools and material. They conclude that force(Z-force and X-force) and Sp.Torque increase as the TTS increases for both tools,whereas the higher value was obtained with a taper threaded tool.Lambiase et al.[51]also investigated the influence of welding speed (WS) and tool rotation speed (TRS) on force, and torque generation during FSW of AA6082-T6 alloy. From their observation, they notice that the WS has a significant effect on specific energy and power generation, but TRS has less effect on power generation,and specific energy.Arora et al.[52]studied the necessity of power and torque on stir zone formation in FSW of AA2524 alloy through experiments,and modeling.They concluded that with the increase in TRS, the Sp.Torque decreases due to increased heat input, but TTS has no major effect on Sp.Torque.
The above discussion concludes that the weld joint configuration, process forces, and torque evolve during welding plays an influential role in the characteristics of overall joint quality,and its corresponding mechanical property. There is very limited study have been found till date on the applicability of scarf joint configuration in FSW. The primary motivation of the work is to uncover the insights of this configuration so that considerable enhancement in strength along the joint line may be obtained with minimum modification in the joint characteristics.Different methods are used to improve the mechanical properties of welded joints, one being addition of reinforcement particles that also adds to the cost involved in the process. This process will also aid in the enhancement of mechanical properties to a certain limit that adds to the cost-effectiveness of the process. The authors have tried to establish through this study that simply by altering the geometry of the joint line,the joint strength can also be enhanced to a certain limit without the aid of any external route. The analysis of force and torque, weld thermal cycle, weld appearance, macrostructure,microstructure, grain structure, and mechanical properties of the joint have been considered to justify the study.It is supposed that,this newly adopted joining configuration may support increasing the joint strength and ductility, which is of prime importance in aerospace or defence based applications without some external aid.
2. Selection of scarf joint angle: underlying concept
The scarf joint is a modified joint configuration designed to increase the faying surface area compared to conventional SSB joint configuration. In this configuration, the joining surface area is inclined to the tool axis instead of being in the plane as in SSB joint configuration. As a result, it reduces the difference between shear and material flow at the tool’s center and periphery.The schematic description of the scarf joint configuration is shown in Fig.1(a). In the present investigation for design a scarf joint configuration,two different types of angle (60and 75) were considered. Again, for each angle, two subsets were considered, one with a positive inclination given on AS and other with a negative inclination and,the welding centerline along the longitudinal direction passes through the middle of the inclination.The selection of scarf angle as shown in Fig. 1(a) is not taken arbitrarily, and there is indeed a particular underlying physics behind the selection. Scarf angle depends mainly on the geometry of tool, i.e., shoulder diameter, pin tip diameter and pin length. Under the normal condition of the square butt joint,the angle of joining from the bottom edge of the plate is considered to be 90.The angle should be selected,so that the faying surface should be covered completely within the shoulder-pin periphery failing,which a defective joint like root gap is likely to occur. To facilitate the understanding, an example is given considering the current dimension of the tool as depicted in Fig.1(b),wherefrom it can be concluded that joining will take place when the maximum variation of scarf angle is limited between one of the extreme edges of the shoulder(i.e.,shoulder radius in RS or AS)and the pin in the opposite extremity(pin tip radius in AS or RS)as shown.From Fig.1(b),it can be seen that for effective mixing,the faying surface of the scarf joint must be completely within the pin stirred region, the maximum limit of which is indicated by θ.When the angle still decreases form θto θ, the efficient mixing will only take place in the pin influenced region but not properly through the entire shoulder influenced region. With a further decrease in angle, the joint line will be outside the shoulder influenced region, thereby leading to the defective joint. From Fig.1(c)considering the geometry of the figure,the angle θand θcan be calculated trigonometrically from the relation:
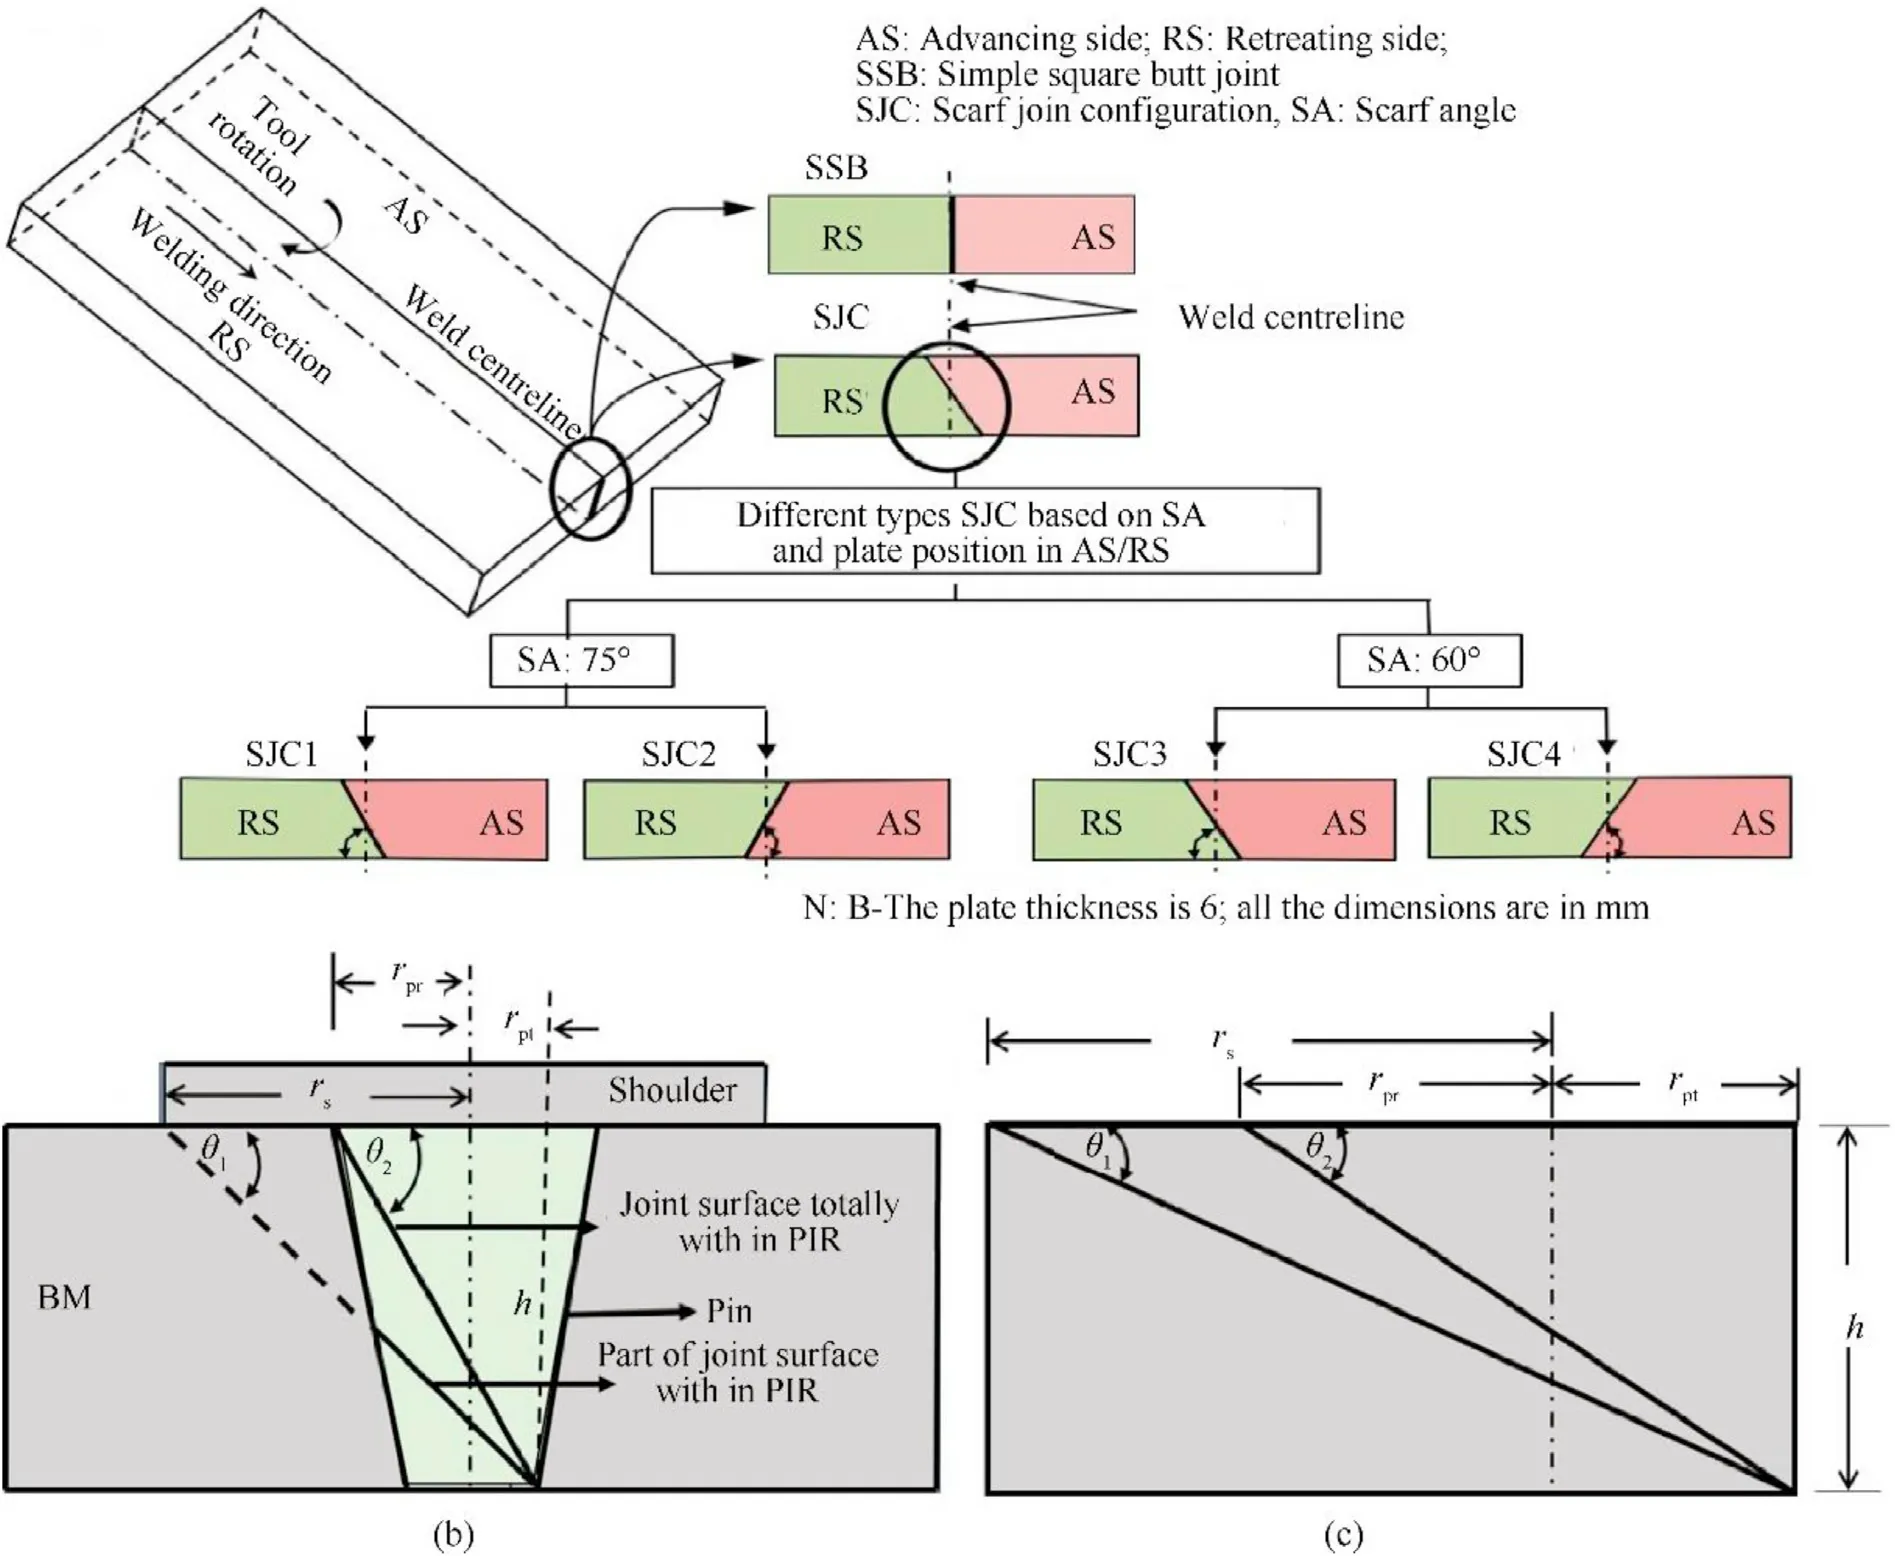
Fig.1. (a) Design of scarf joint configuration at different scarf angles, (b) basic geometry of the figure showing the necessary dimension, (c) scarf angle calculation.

where,
h= Pin length,r=tool shoulder radius,
r=pin root radius, r=pin tip radius
In the present study, based upon the tool dimensions and geometry, the upper, and lower limits of scarf angle have been calculated as θ=50.2and θ=28.6respectively.From the results it can be concluded that for efficient joining,the scarf angle may be limited to 50.2from the joint edge i.e.90,but,if it is reduced to a value less than 28, various weld defects are likely to appear without actually justifying for the underlying physics. Although, a fewer paper may present some analysis on scarf joint considering any arbitrarily chosen angle, this systematic approach for calculating the scarf angle may be adopted to achieve a defect free joint.For this reason, two different standard scarf angles (75and 60)have been considered for the study, which well within the geometrically calculated scarf angle(in between 90and 50.2).To perceive the effect of different scarf angles on force and torque generated during welding.This method of scheming the scarf angle is unique within itself and has not been offered earlier for investigation.
3. Experimental details
The welding was performed on a 3-TR FSW machine set up with a capacity to provide up to 30-kN axial thrust to the tool. The machine can run a maximum spindle speed of 3000 rpm with infinite variable, and the spindle can be tilted within an angle of±10. The Friction stir welding setup with force, torque and temperature measuring arrangements is given in Fig. 2. In this experiment, a fixed parametric combination of TRS 1100 rpm, TTS of 2 mm/s and TTA of 2have been chosen on 6 mm thick commercial grade AA6061-T6 plates.The chemical composition and mechanical properties of the base plate are given in Table 1 and Table 2. The welding of 120 mm length has been conducted in a plate of dimension (150 × 55 × 6) mm for each joint configuration, and it also repeated three times for each experiment. A taper threaded tool(H13 tool steel)with the hardness of 58 HRC was used for the current experiment. The shoulder diameter is 18 mm with a pin length of 5.8 mm,and the tip,root diameter of the pin is 4 mm,and 6 mm respectively as shown in Fig. 3. All the welding has been performed on separate set of plates to nullify the effect of the thermal cycle experienced in the previous experiment.The plunge rate, plunge depth, and the tool dwell time are kept constant at 20 mm/min, 0.1 mm, and 4 s. The scarf joint configurations of 60and 75scarf angle, as shown in Fig.1(a) were considered in the study that were compared with conventional SSB configuration on different welding aspects. The X-force, Z-force, and Sp.Torque generated during welding were determined using strain gaugebased load cells connected through a PLC system. Motor current is measured from the drive system,which gives a measurement of the torque.Two different load cells are used,one of them attached with spindle head (5 tons) for measurement the Z-force and another load cell (3 tons) is attached with auxiliary slide for measurement of X-force. These load cells are connected to the PLC system for data feedback,and NI LabView software is used for data acquisition.The average values of force and torque were calculated after the tool dwell time ends,and it starts traversing in the forward direction. For analysis of thermal profiles, the temperature was measured by using K-type chromel-alumal thermocouples of 15 gauge AWG by inserting it vertically up to a depth of 2 mm,and at a distance of 11 mm from the center of WN as shown in Fig. 4. As there is a thermomechanical process, it is not preferable to insert the thermocouple in TMAZ, which may lead to the destruction of the thermocouple tip.For tensile test analysis,the specimens were prepared in the transverse direction of welding and the specimen was tested according to ASTM-E8 standard at a strain rate of 0.5 mm/min. For microstructure and macrostructure analysis, the
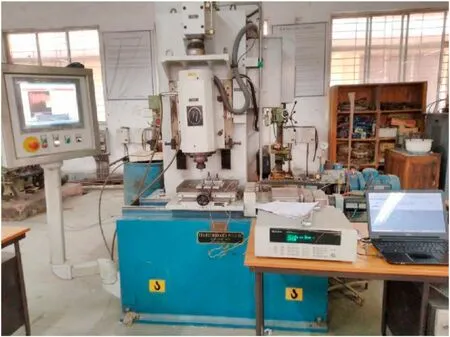
Fig. 2. Friction stir welding machine setup with force, torque and temperature measuring arrangements.

Table 1 Chemical composition of AA6061-T6 material.

Table 2 Mechanical properties of AA6061-T6 material.
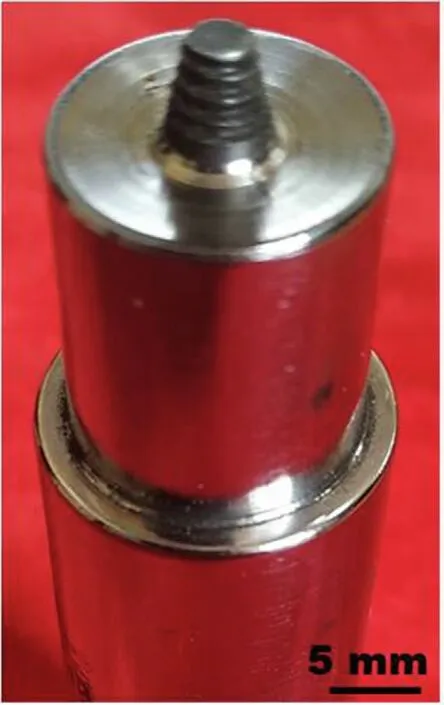
Fig. 3. Friction stir welding tool.

Fig. 4. Positioning of thermocouples in the experiment.
weld samples were polished with emery papers of 150 grit sequenced up to 2000 grit, followed by cloth polishing with colloidal silica. The microstructure was revealed by a surface treatment using a Keller’s reagent by dipping the specimens for 10-15 s, and then cleaning the sample with water or ethanol. A light optical microscope is used to analyze the microstructure of the samples. Tungsten-scanning electron microscope (W-SEM) furnished with EDS was utilized to analyze the presence of a secondary particle in WN.The mean grain size diameter of TMAZ,and NZ is calculated using the linear intercept method as per ASTM E 112-12 standard. The Vickers microhardness value was evaluated using a load of 100 gf, and 10 s dwell time. Fractography analysis was carried out in the tensile fractured specimen using (W-SEM).
4. Results and discussion
4.1. Insight of FSW using scarf joint configuration
For analysis of the force, and torque generated along the weldment,the total area under the shoulder,and the pin is divided into two different regions,as shown in Fig.5.For better understanding,and an easy explanation of the complex analysis, an imaginary reference line has been plotted to differentiate shoulder induce region (SIR), and pin induce region (PIR) in the schematic representation of the welded macrostructure. From Fig. 5(a), it can be noted that,theoretically in the SSB arrangement,the amount of SIR and PIR in AS and RS remains the same.But with the change in the scarf angle (60or 75) the effective area changes as shown in Fig.5(b-e).The theoretical SIR and PIR in AS and RS of the different samples are measured, as shown in Table 3. From this table, it can be distinguished that SJC3 has both maximum and minimum SIRAS and SIR-RS of 28.45 mmand 20.25 mmrespectively amongall the configuration. It is a well-established fact in FSW that, the amount of heat generates in the AS is comparatively higher than the heat generated in the RS[50].Abnar et al.[53]presented similar findings in butt joint configuration and found that heat generated in AS is more than RS due to the same direction of traverse speed,and rotation speed. Also, the literature [54] shows that 80% of frictional heat generation in the welding zone is due to the rubbing action between workpiece material and the tool shoulder. Hence more heat will be generated in SJC3, as the initial shearing will occur along this region.As a result,the magnitude of Z-force and Xforce, and Sp.Torque will be lower followed by the force, and Sp.Torque generated for samples SJC1, SSB, SJC2 and SJC4 in ascending order, respectively. Following this, the amount of heat generated will be in the order of SJC3 >SJC1 >SSB >SJC2 >SJC4 depending upon the total area under the shoulder along the AS.This also goes in well agreement with the nature of force (Z-force and X-force) and Sp.Torque distribution along the welding direction,as shown in Fig.5.Thus,from the above explanation,the scarf angle variation is well justified in terms of the distribution of force,torque, heat generation and material movement in the weldment.This unique characteristic may lay an impact on the microstructural and mechanical property changes for various joint configurations.

Table 3 Comparison of effective theoretical area in SIR and PIR for different joint configuration.
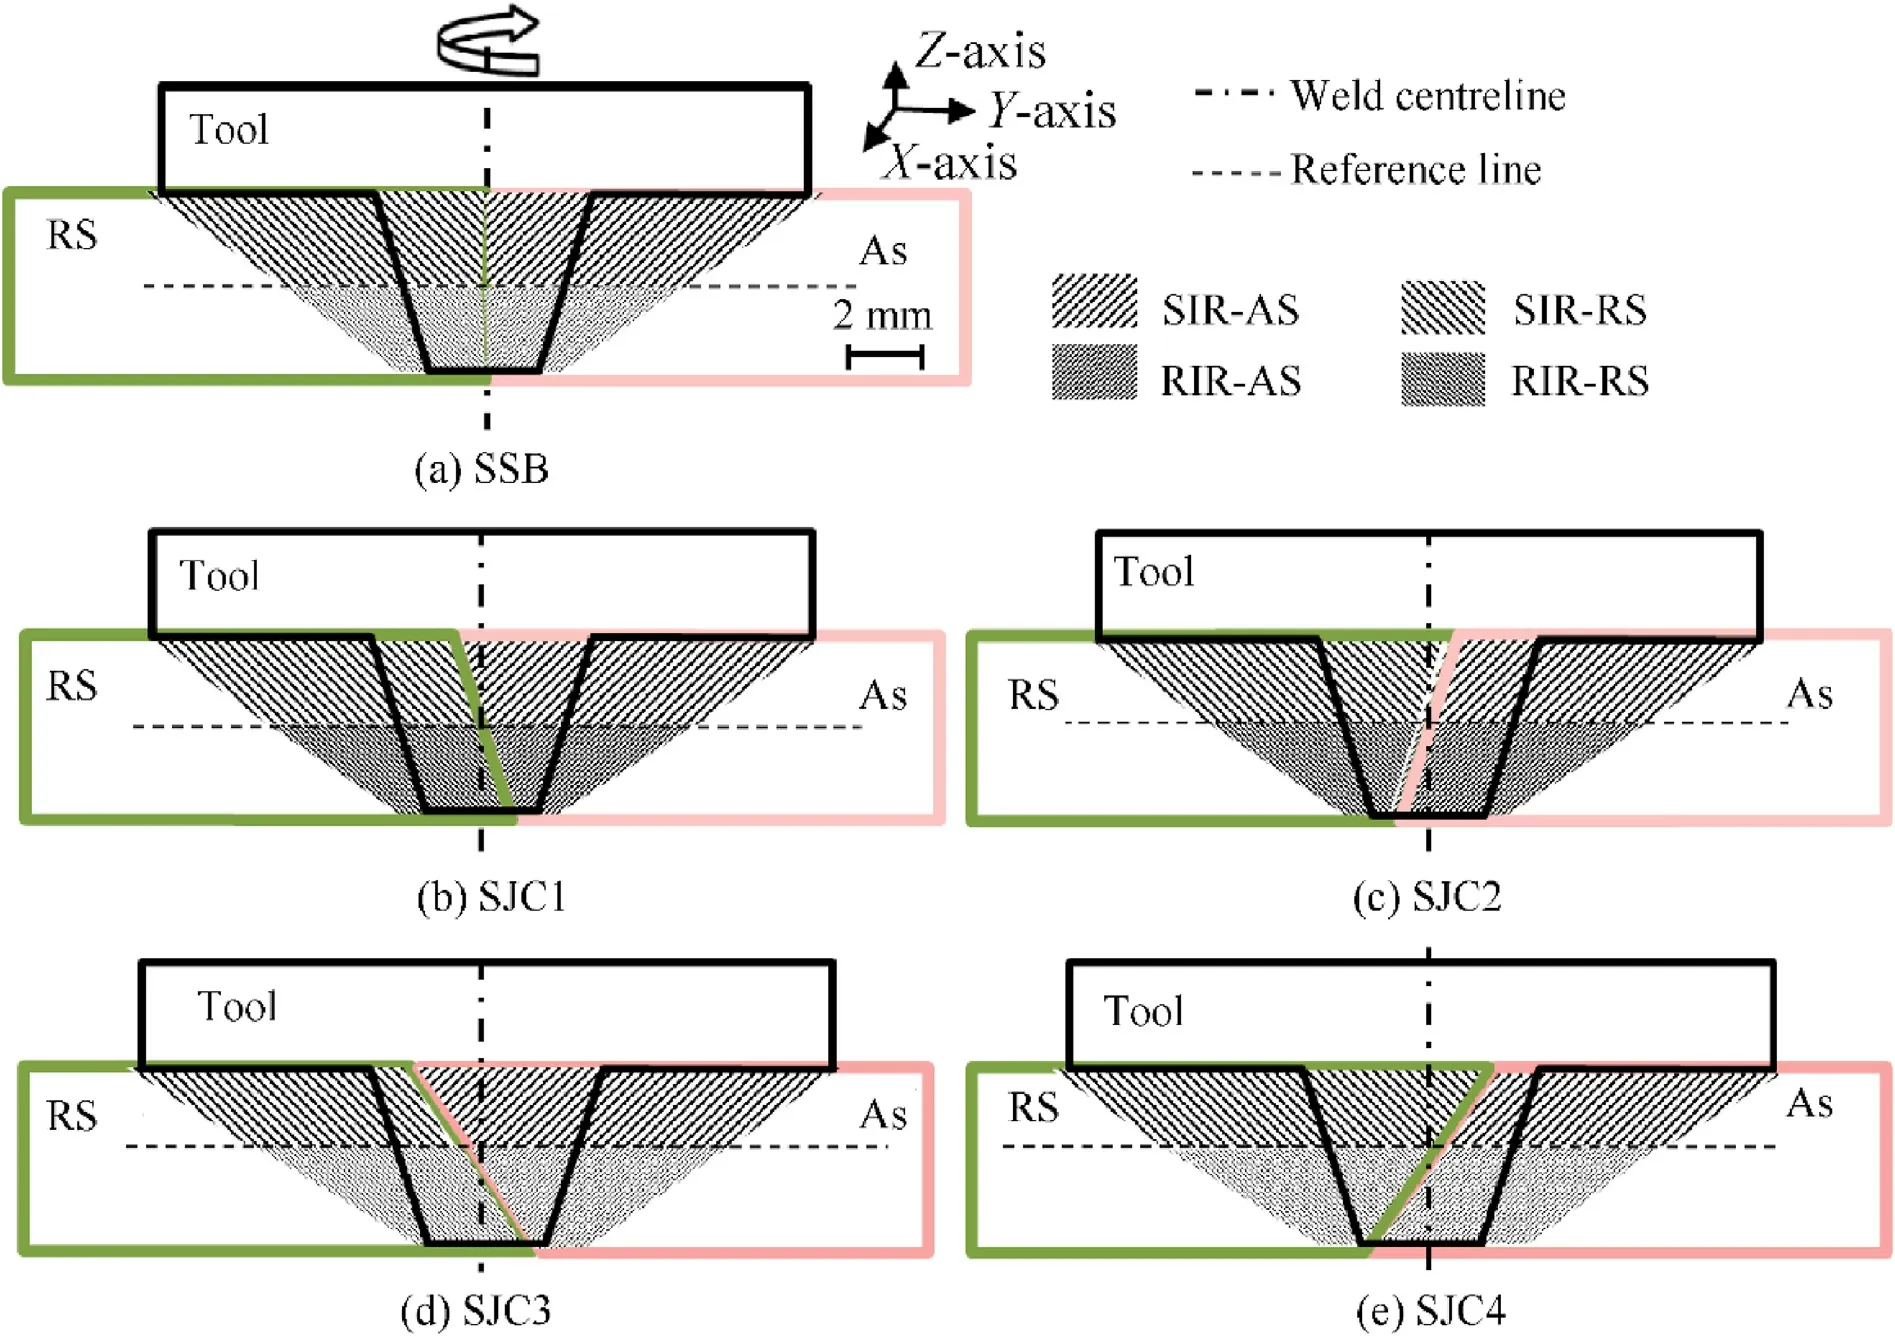
Fig. 5. Schematic representation of SIR and PIR for different joint configuration.
4.2. Force and torque analysis
The variation of Z-force, X-force, and Sp.Torque with respect to time, and the deviation of their mean values with the change in scarf angle is illustrated in Fig. 6.
From the Z-force distribution plot Fig.6(a),it can be noticed that for sample SSB,there is a sudden increase in Z-Force,followed by an immediate decrease during the initial stage of welding. With further advance of the tool,a gradual but steady increase in Z-force is observed. The reason may be due to the large force required by the tool during the initial plunging, followed by heating to soften the material[29,33].Banik et al.[50]also reported similar findings.They found that force and torque value suddenly increase during the initial stage of welding, and then decrease with further advancement of the tool. Lambiase et al. [51] also observed the starting of the welding process, welding force and plunging force suddenly increase, and then steep drop due to tool and material contact surface. With the static rotation of the tool,the material is plasticized further during dwelling time. Hence, the Z-force decreases before the tool’s advancement along the welding direction.Similar observations are also noticed for other samples(SJC1,SJC2,SJC3 & SJC4) but with some variations with the minimum force(both Z-force and X-force)required for sample SJC3.The reason for such an abrupt variation irrespective of the angle of the scarf is discussed elaborately in the next section. This explanation may pave the way for a new approach in determining the best possible scarf angle orientation for maximizing mechanical properties compared to the existing square butt joint orientation.
4.3. Variations of weld thermal cycle
This section has been included to understand the variation in force (Z-force and X-force), and Sp.Torque generation during the welding for different joint configurations. The welded specimen’s temperature for a particular location (middle of the weld length)was measured in both the AS and RS,as shown in Fig.7.The thermal profile generated shows that the maximum temperature(406C)is attained using the SJC3 type joint configuration, whereas the minimum temperature (329C) is attained by SJC4 type joint configuration in AS. Similarly, in RS, maximum temperature(376C) is attained by SJC4 and minimum temperature (284C)achieved by SJC3. The variation of peak temperature may be credited to the availability of effective area available beneath the shoulder in the AS and RS.It is a fact that the generation of higher temperature leads to higher heat input in the weldment and results in the requirement of a lower amount of force,and torque to deform the material [50]. Buchibabu et al. [55] also reported the effect of welding speed and tool rotation speed on heat generation. They found that increase in heat generation cause a decrease in torque,due to the softening of the workpiece material. Astarita et al. [29]reported that with increased heat generation in the weldment,lesser extent of force is required to deform the material. This is in line with the torque and forces analysis section, which shows a lower amount of force,and torque is generated during the welding for SJC3, and higher is for SJC4.

Fig.6. Comparison of force and Sp.Torque for different plate angles in scarf joint configuration with square butt configured joint,(a)Z-force,(b)Sp.Torque,(c)X-force,(d)Average force and Sp.Torque.
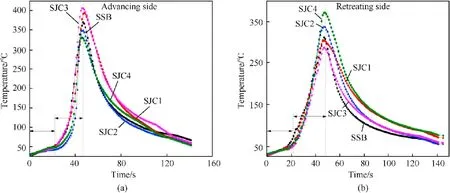
Fig. 7. Variation of weld thermal cycle for a different joint configuration, (a) Advancing side, (b) Retreating side.
4.4. Weld appearance and macrostructure analysis
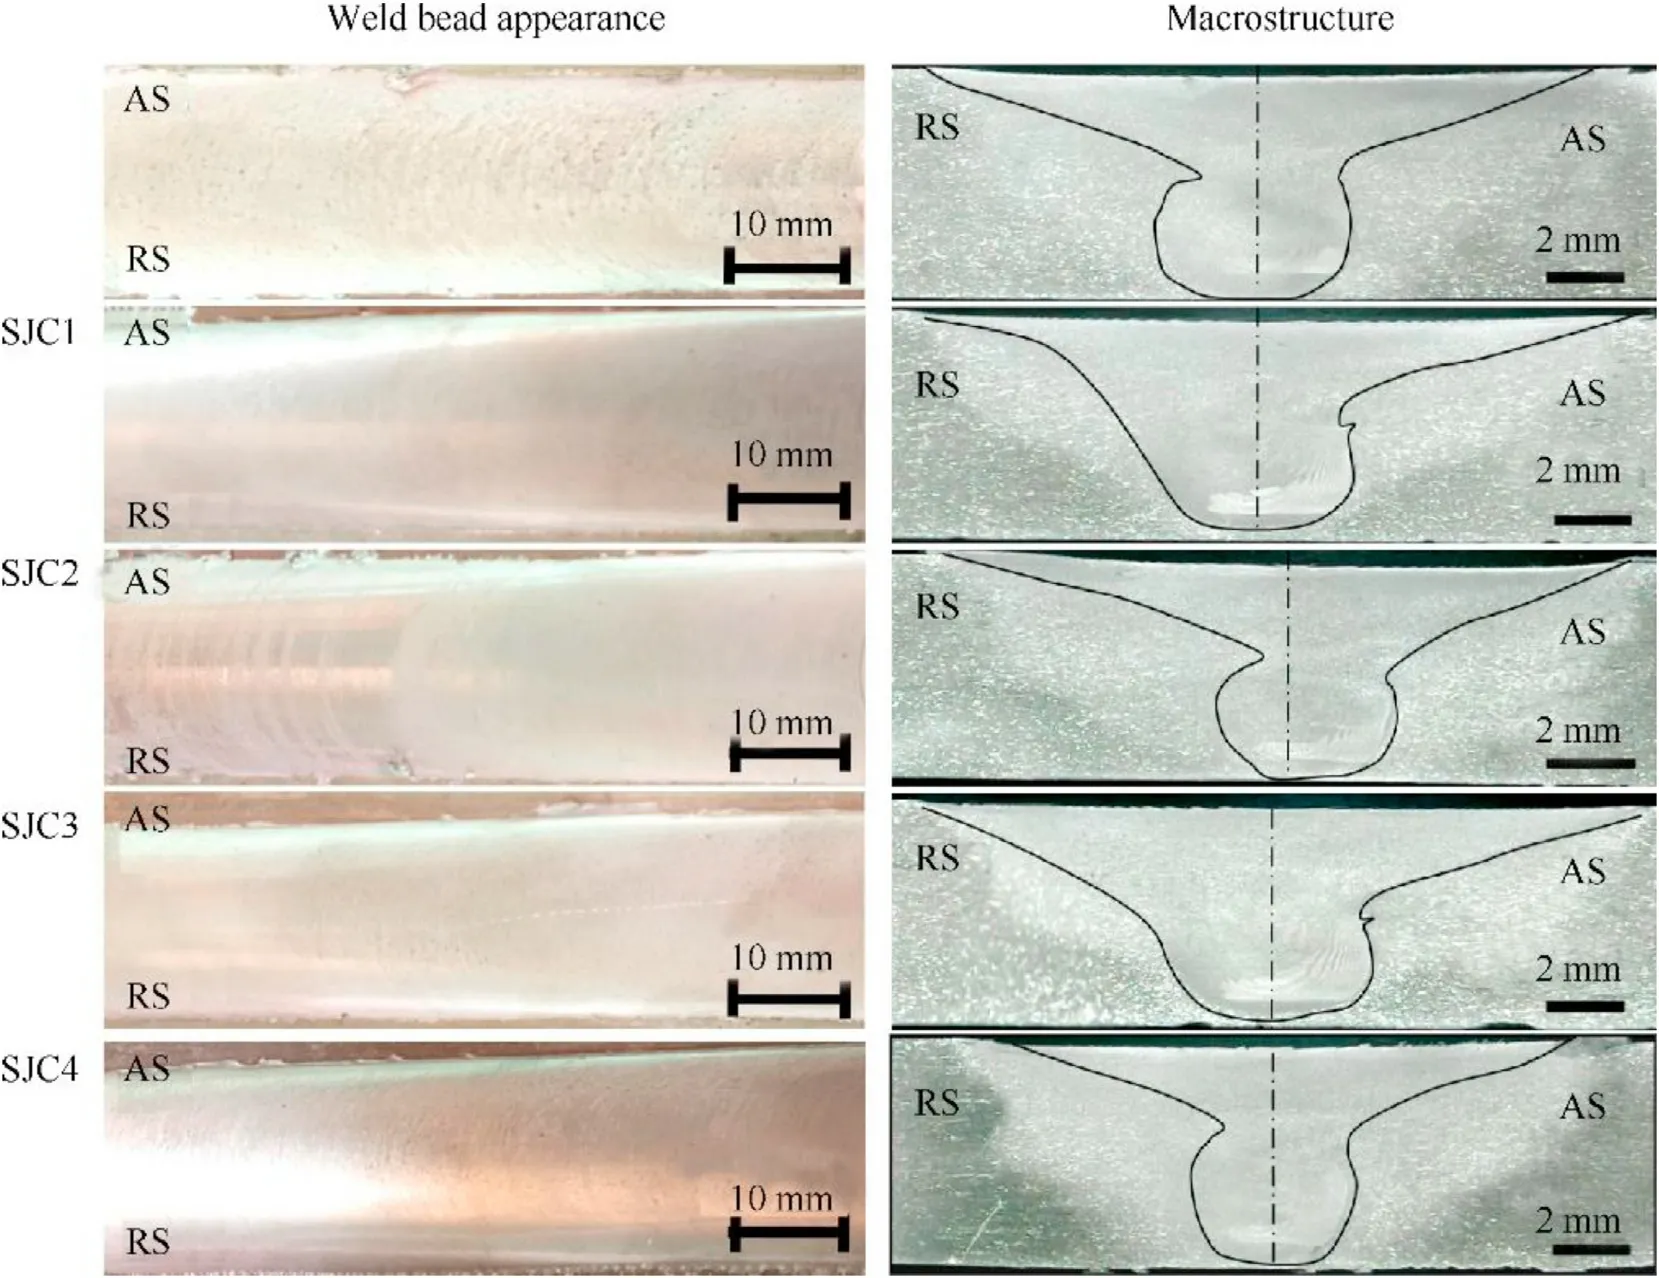
Fig. 8. Weld bead appearance and respective macrostructures of the joints.
Fig. 8 shows weld surface appearance and their corresponding macrostructure for different samples. This figure depicts defectfree welding with very less amount of flash for all the samples.Which may be primarily for choosing suitable tool plunge depth and proper process parameters. The respective macrostructural image of the samples also shows evidence of sound and defect-free welding.All the macrostructure shows clearly visible stacked onion ring pattern except the SJC4.The reason may be related to selection of scarf angle for which sufficient amount of heat may not be available in SJC4,that could have assisted for easy and smooth flow of the plasticized material in the nugget zone(NZ).However,it can also be observed that the onion rings are more prominent in the lower portion compared to the upper part. This may be since the pin driven flow(which is responsible for shaping the onion ring)is interrupted by the prominent shoulder induced flow. The onion ring’s appearance at the PIR suggests good material mixing at the bottom part,that resulting in defect-free welding.Sample SJC1,and sample SJC3 show similar behavior, whereas it appears to be different for SSB, SJC2, and SJC4. A symmetrical observation about the weld line can be seen in case SSB and SJC4 samples,whereas,in the case of sample SJC1,SJC2 and SJC3 stir region lose its symmetry.The shoulder induced region of SSB, SJC2, and SJC4 sample possesses a taper shape and pin induce region has a circular shape. It was observed that due to scarf angle, SJC1 and SJC3 sample have comparatively larger SIR,and PIR compare to the other sample.As the amount of material coming in contact with shoulder increases,the heat generation also increases resulting in deformation and plasticization of the material.Easy deformation and proper stirring of the material cause defect free joint, resulting escalation in mechanical property.From Table 4,it is observed that sample SJC3 has maximum shoulder induced depth(SID)and shoulder induced area that indicates directly to the amount of material available in AS beneath the shoulder. With the maximum material coming in contact with the shoulder on the AS, the heat generation also increases, and the material can be easily deformed. As a result, less force and torque are required to plasticize the material,and this is observed in the torque force curve (see Fig. 6(a) and (b)). Due to small SIR and comparatively large pin induce depth (PID), result minimum amount of material beneath the shoulder(SJC4),the heat input to the material also becomes less.As a result,more force and torque are required to plasticize the material.
4.5. Microstructural analysis
Fig.9 represents the microstructure of NZ,TMAZ-AS,and TMAZRS at different scarf joint configurations. The HAZ is not always prominent in FSW,and it is very hard to differentiate between the HAZ and TMAZ as far as the microstructural observation is concerned.In FSW,grain size depends on various factors like the extent of deformation, heat input, and cooling rate [34]. To justify the study, the optical micrographs were taken exactly at the midthickness of the samples. The micrographs of the NZ were taken at the weld centerline,and those of the TMAZ were taken on both of the weld centerline which is 7 mm away from it. The NZ micrographs for all the samples shows fine equiaxed grains due to the appropriate thermal cycle effect and mechanical mixing of the material.Different sizes of equiaxed grains are present in the NZ of the SSB sample. In the case of the SJC1, and SJC3 sample, comparatively small and similar sized grains are uniformly distributed throughout the NZ, whereas in the SJC2 sample, larger grains of non-uniform shapes are present. Fine and equiaxed grain are generated in the NZ of SJC1 and SJC3 samples compared to other samples due to generation of more heat in SJC1 and SJC3 which results in recrystallization of new grains during plastic deformation.Among all the samples,SJC3 shows the minimum grain size in the NZ,whereas SJC4 shows the maximum.It can be observed that fine strengthening secondary phase particle are uniformly distributed throughout the NZ of SJC3 sample, whereas coarse sizeparticle is observed in SJC4 sample.As sufficient amount of heat is generated in SJC3 sample, this favors the uniform distribution and dissolution of the second phase particle in the NZ. In case of the SJC4 sample,the amount of heat generated may not be sufficient for the dissolution of the second phase particle, and results in the presence of a coarse secondary particle. Li et al. [30] also reported that, insufficient heat input causes the presence of coarse second phase particle in NZ.Comparatively large elongated grain is present in both side of TMAZ due to variation of heat input and shear force which tries to resist the easy flow of the material during welding.Due to the variation of heat input between AS and RS [50], the elongated and small number of grains are present in TMAZ (AS)compare to TMAZ(RS).

Table 4 Comparison of Shoulder and Pin induce area for different samples.
To ensure the existence of second phase particles, all the microstructure samples are subjected to SEM analysis.Fig.10 shows the SEM micrograph of NZ for different samples at varying joint configuration.The second phase particle formation in NZ affects the strength and property of the FSWed joint of aluminum alloy [50].The observation shows the presence of two types of particles in NZ.One is whitish shaped,and another one is of dark irregular shaped.The elemental analyses of both the particles are conducted through EDX and XRD analysis,as shown in Fig.11.The analysis shows that the irregular dark shaped particle is MgSi,and the white particle is Al(FeMn)Si. The coarse, second phase particle MgSi formed in AA6061-T6 alloy. Naumov et al. [56] also reported the presence of MgSi and Al(FeMn)Si second phase particle in AA6061-T6 alloy.The presence of pits in the secondary particles may be due to the etching agent’s corroding activity around the second phase particles[30].The presence of large amount pits(except SJC3)indicates that heat input is not sufficient for complete dissolution the second phase particles.In sample SJC3,the particles are broken down into finer shape, uniformly distributed in NZ. This may be due to generation of adequate amount of heat for the dissolution of the second phase particle, and proper stirring of the plasticize material. SJC4 sample contains a large amount of coarse, secondary phase MgSi particle compare to the other sample. Presences of coarse secondary phase particle indicate insufficient heat generate during welding to complete dissolution of these particles.Li et al.[30]also observed that the presence of a small hole in NZ indicates the heat input is insufficient for dissolution of secondary phase particle.
4.6. Grain size analysis
This section systematically investigates the effect of joint configuration on formation of grain in the welding zone, which finally affects the joint’s mechanical strength. The mean grain size diameter of TMAZ and NZ are calculated by ImageJ software(With a similar area, similar magnification and similar scale). Three micrographs from each zone have been considered to calculate the average grain size of higher accuracy for NZ,TMAZ-AS,and TMAZRS.Fig.12 shows the distribution of grain size of different zones at varying joint configuration. The figure shows that the number of grains increases from SSB to SJC1,and SJC2 to SJC3 as the grain size decreases from SSB to SJC1, and SJC2 to SJC3. It has been observed that the number, and size of the grains vary in different joint configuration. Also, it has been observed that the NZ have higher count compared to TMAZ and in the TMAZ itself, RS have higher count compare to AS. Minimum and maximum grain size found from the analysis is 1.9 μm, and 27.82 μm in NZ and 3.56 μm, and 68.42 μm in TMAZ.Fig.13 shows the variation of average grain size for NZ,TMAZ-AS,and TMAZ-RS in the different joint configuration.From the plot maximum and minimum average grain size diameter of 10.13 μm and 6.82 μm is found in NZ and maximum, and minimum average grain size diameter of 18.13 μm,and 11.98 μm found in TMAZ.It has been observed that the average grain size of the NZ decreases from the SSB sample to the SJC1 sample.This may be due to the scarf angle,an increase in shoulder influence region cause an increase in the amount of heat generation for SJC1 compared to SSB.Higher heat input causes better flow and stirring of plasticized material results in finer grains in NZ[50].Due to the same analogy,the grain size decreases for SJC3 compare to SJC2. It can also be noticed that the grain size increases for SJC2 compare to SJC1.This may be due to the decrease in the heat generation of SJC2 compare to the SJC1. Due to less heat input available, the material’s deformation also reduces, which causes less plasticization of the material. As a result, an increase in grain size is observed in SJC2 compared to SJC1.Due to the same analogy,an increase in grain size was observed from SJC3 to SJC4. The relation between grain size and mechanical strength is described by the Hall-Petch equation,which supports small grain have higher mechanical strength [50],and also described in tensile strength analysis. This may be the probable reason for increasing the SJC3 joint configuration’s mechanical strength compared to other joint configuration.

Fig. 9. The grain size of different zone NZ, TMAZ-AS and TMAZ-RS.
4.7. Mechanical properties
This section attempts to justify the application of scarf joint configuration in FSW over conventional SSB type. For the comparison of weld joint quality formed with different joint configuration,the joint’s various mechanical properties have been studied as shown below.
4.7.1. Hardness
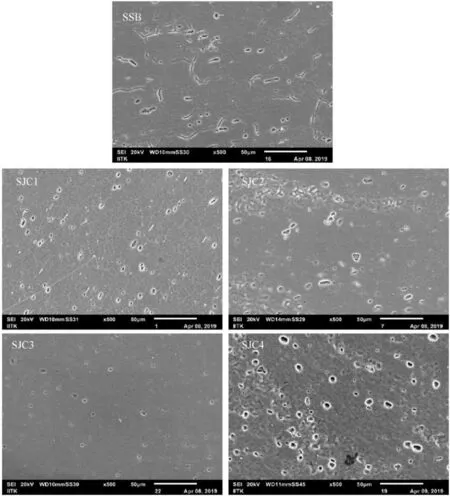
Fig.10. SEM image of secondary particle distribution for different sample.
Vickers microhardness was utilized to measure the variation of microhardness across the sample’s mid-section and transverse to the welding direction.The average microhardness value of the BM is around 107 HV.Fig.14(a)shows the variation of microhardness along the center of the NZ in the horizontal direction. The microhardness profile shows a ‘W’ shape pattern for all the samples,where the microhardness value attained in the NZ is less than the BM. Wang et al. [2] also concluded that the ‘W’ shape microhardness profile obtained in all the welding parameter and the microhardness value of the NZ is less than the BM. The hardness plot shows that AS has lower hardness compared to RS.This may be due to the production of a higher amount of heat in AS compared to RS,which results in the dissolution of a higher amount of second phase particle, causing a reduction in the hardness values. Fig. 14(b)shows the variation of average microhardness value in different samples. It was observed that microhardness value increases from SSB to SJC1 and SJC2 to SJC3. Similarly, microhardness value decreases from SJC1 to SJC2 and SJC3 to SJC4. The maximum and minimum average microhardness of 81.51 HVand 70.61 HVobtained in SJC3 and SJC4 sample. As the maximum average grain size diameter of 10.13 μm and minimum grain size diameter of 7.82 μm present in the NZ of SJC4 and SJC3, respectively. The hardness value of the precipitation-hardened aluminium alloy primarily depends on the grain size,development,and distribution of the secondary phase precipitates [50]. The relation between grain size and microhardness value (H) can be mathematically described by the Hall-Petch equation (2) [57,58].
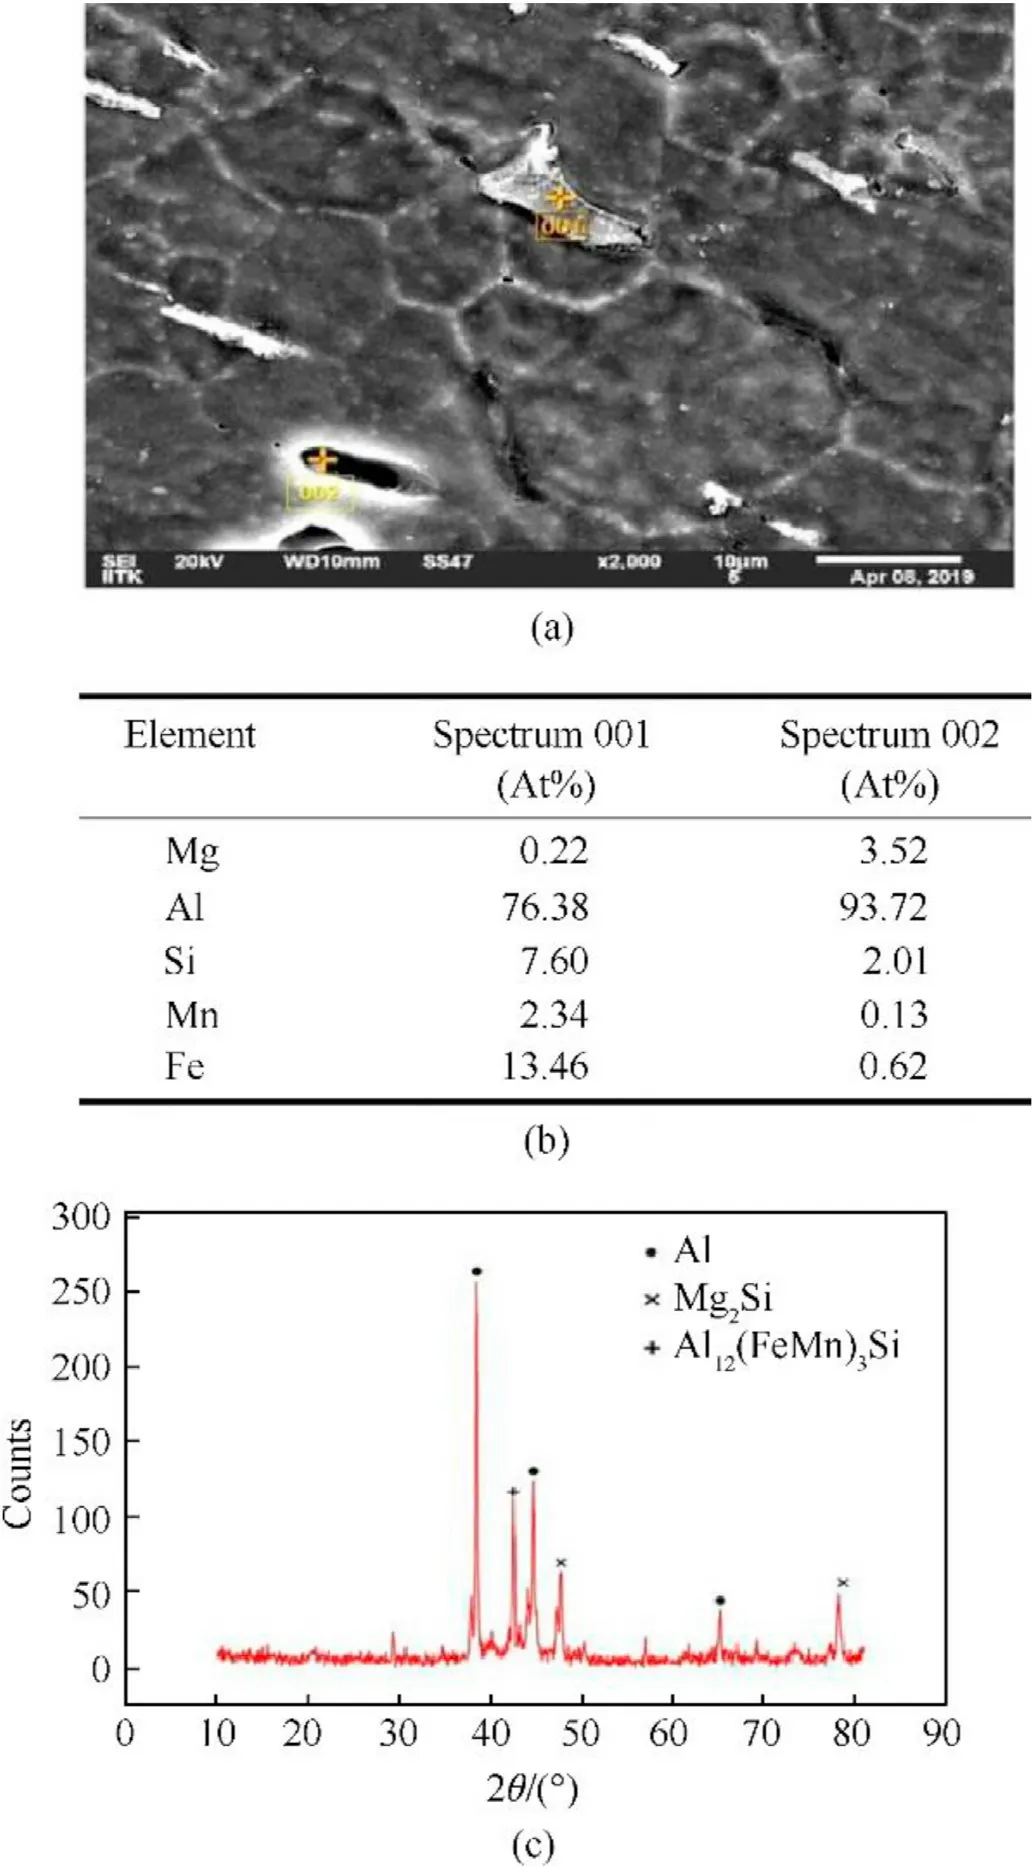
Fig.11. (a) EDS analysis, (b) Elemental composition, (c) XRD analysis.

where,His intrinsic hardness of the alloy, Kis Hall-Petch coefficient,d is the average grain size diameter.Eq.(2),shows that the grain size is inversely proportional to the hardness i.e., smaller grain has higher hardness value. As the grain size of the SJC3 sample is lower compared to other samples, so SJC3 have higher hardness compared to other. The secondary phase precipitates as depicted in Fig.10 comprises of fine and coarse particles some of which may show homogenous or otherwise local distribution. As evident from the SEM image of SJC3 sample,the finer particles are seen to be distributed homogenously throughout the nugget,whereas for other samples,non-uniform distribution of the coarser particles with some local concentration can be noticed. This combined effect of gain size and secondary particle (considering their size and nature of distribution) may be the reason for uneven distribution of hardness for all the samples. Li et al. [30] also conclude that the strength of AA6061-T6 alloy depends on fine equiaxed grains and second phase particles.Due to re-precipitation of some re-dissolved atom at high temperature,the hardness of the NZ increases[2].This may be the probable reason for an increase in hardness for SJC3 joint configuration compare to other joint configuration.
4.7.2. Tensile strength analysis
To investigate the joints’ mechanical strength formed with different scarf angles (joint configuration), the tensile strength analysis is conducted.The increase or decrease of the tensile values can be explained in terms of force,torque,and grain size of the weld zone. The stress-strain curves attained from tensile testing are shown in Fig.15(a).Three specimens from each joint configuration were tested, and the averages values are the plotted in Fig.15 (b).The graph shows that the SJC3 sample (60scarf angle joint configuration) possesses the highest tensile values which are UTS of 267 MPa,0.2%Yield stress of 156.34 MPa,and%elongation of 21,whereas SJC4 sample has the minimum values(UTS of 202.22 MPa,0.2%Yield stress of 120.28 MPa and%elongation of 16.50).This can be attributed to the fact that for sample SJC3,the shoulder induced area on the AS is maximum(28.45 mm)with the minimum value on the RS (20.25 mm). Hence more heat will be generated in the SJC3 sample followed by SJC1, SSB, SJC2 and SJC4 in descending order.Due to a higher amount of heat input,the smooth flow of the plasticized material and proper stirring of the material occur,which leading to be the fine grain structure(can see in Fig.9).The relation between yield strength and grain size diameter is mathematically described by the Hall-Petch relationship, which is described in Eq.(3), where.〞σ〞 represents yield stress, 〞σ〞 represent friction stress in the absence of grain boundaries,“k"denote strengthening coefficient and “d " average grain size diameter [59,60].

According to the Hall-Petch relationship, smaller grain size supports better mechanical strength. Due to this reason, the SJC3 sample experiences a higher tensile strength.As the SJC4 sample’s AS-SIR area is minimum, the heat input also remains lower,resulting a decrease in the tensile strength of the SJC4 specimen.In addition to this, the ultimate tensile strength also depends on the microstructure and formation secondary phase particle.It is a wellestablished fact that finer precipitates and equiaxed grain structures are responsible for increasing mechanical property [50].Padmanaban et al. [37] observed that presence of fine equiaxed grains,more number of subgrains and distinct grain boundaries in the NZ cause better tensile properties of these joints. It has been found from Fig.9 that fine and equiaxed grain is present in the NZ of SJC3, which increases in SJC1, SSB, SJC2, and SJC4, respectively.Fig.10 shows the second phase particles are broken down into finer particles,which are uniformly distributed throughout the NZ in the SJC3 sample. This may have enhanced the tensile property of the SJC3 sample. In the SJC4 sample, non-uniform distribution of the coarser secondary phase particles with some local concentration was observed. This may cause lowering the UTS value of SJC4 sample compare to other sample.
5. Fractography analysis
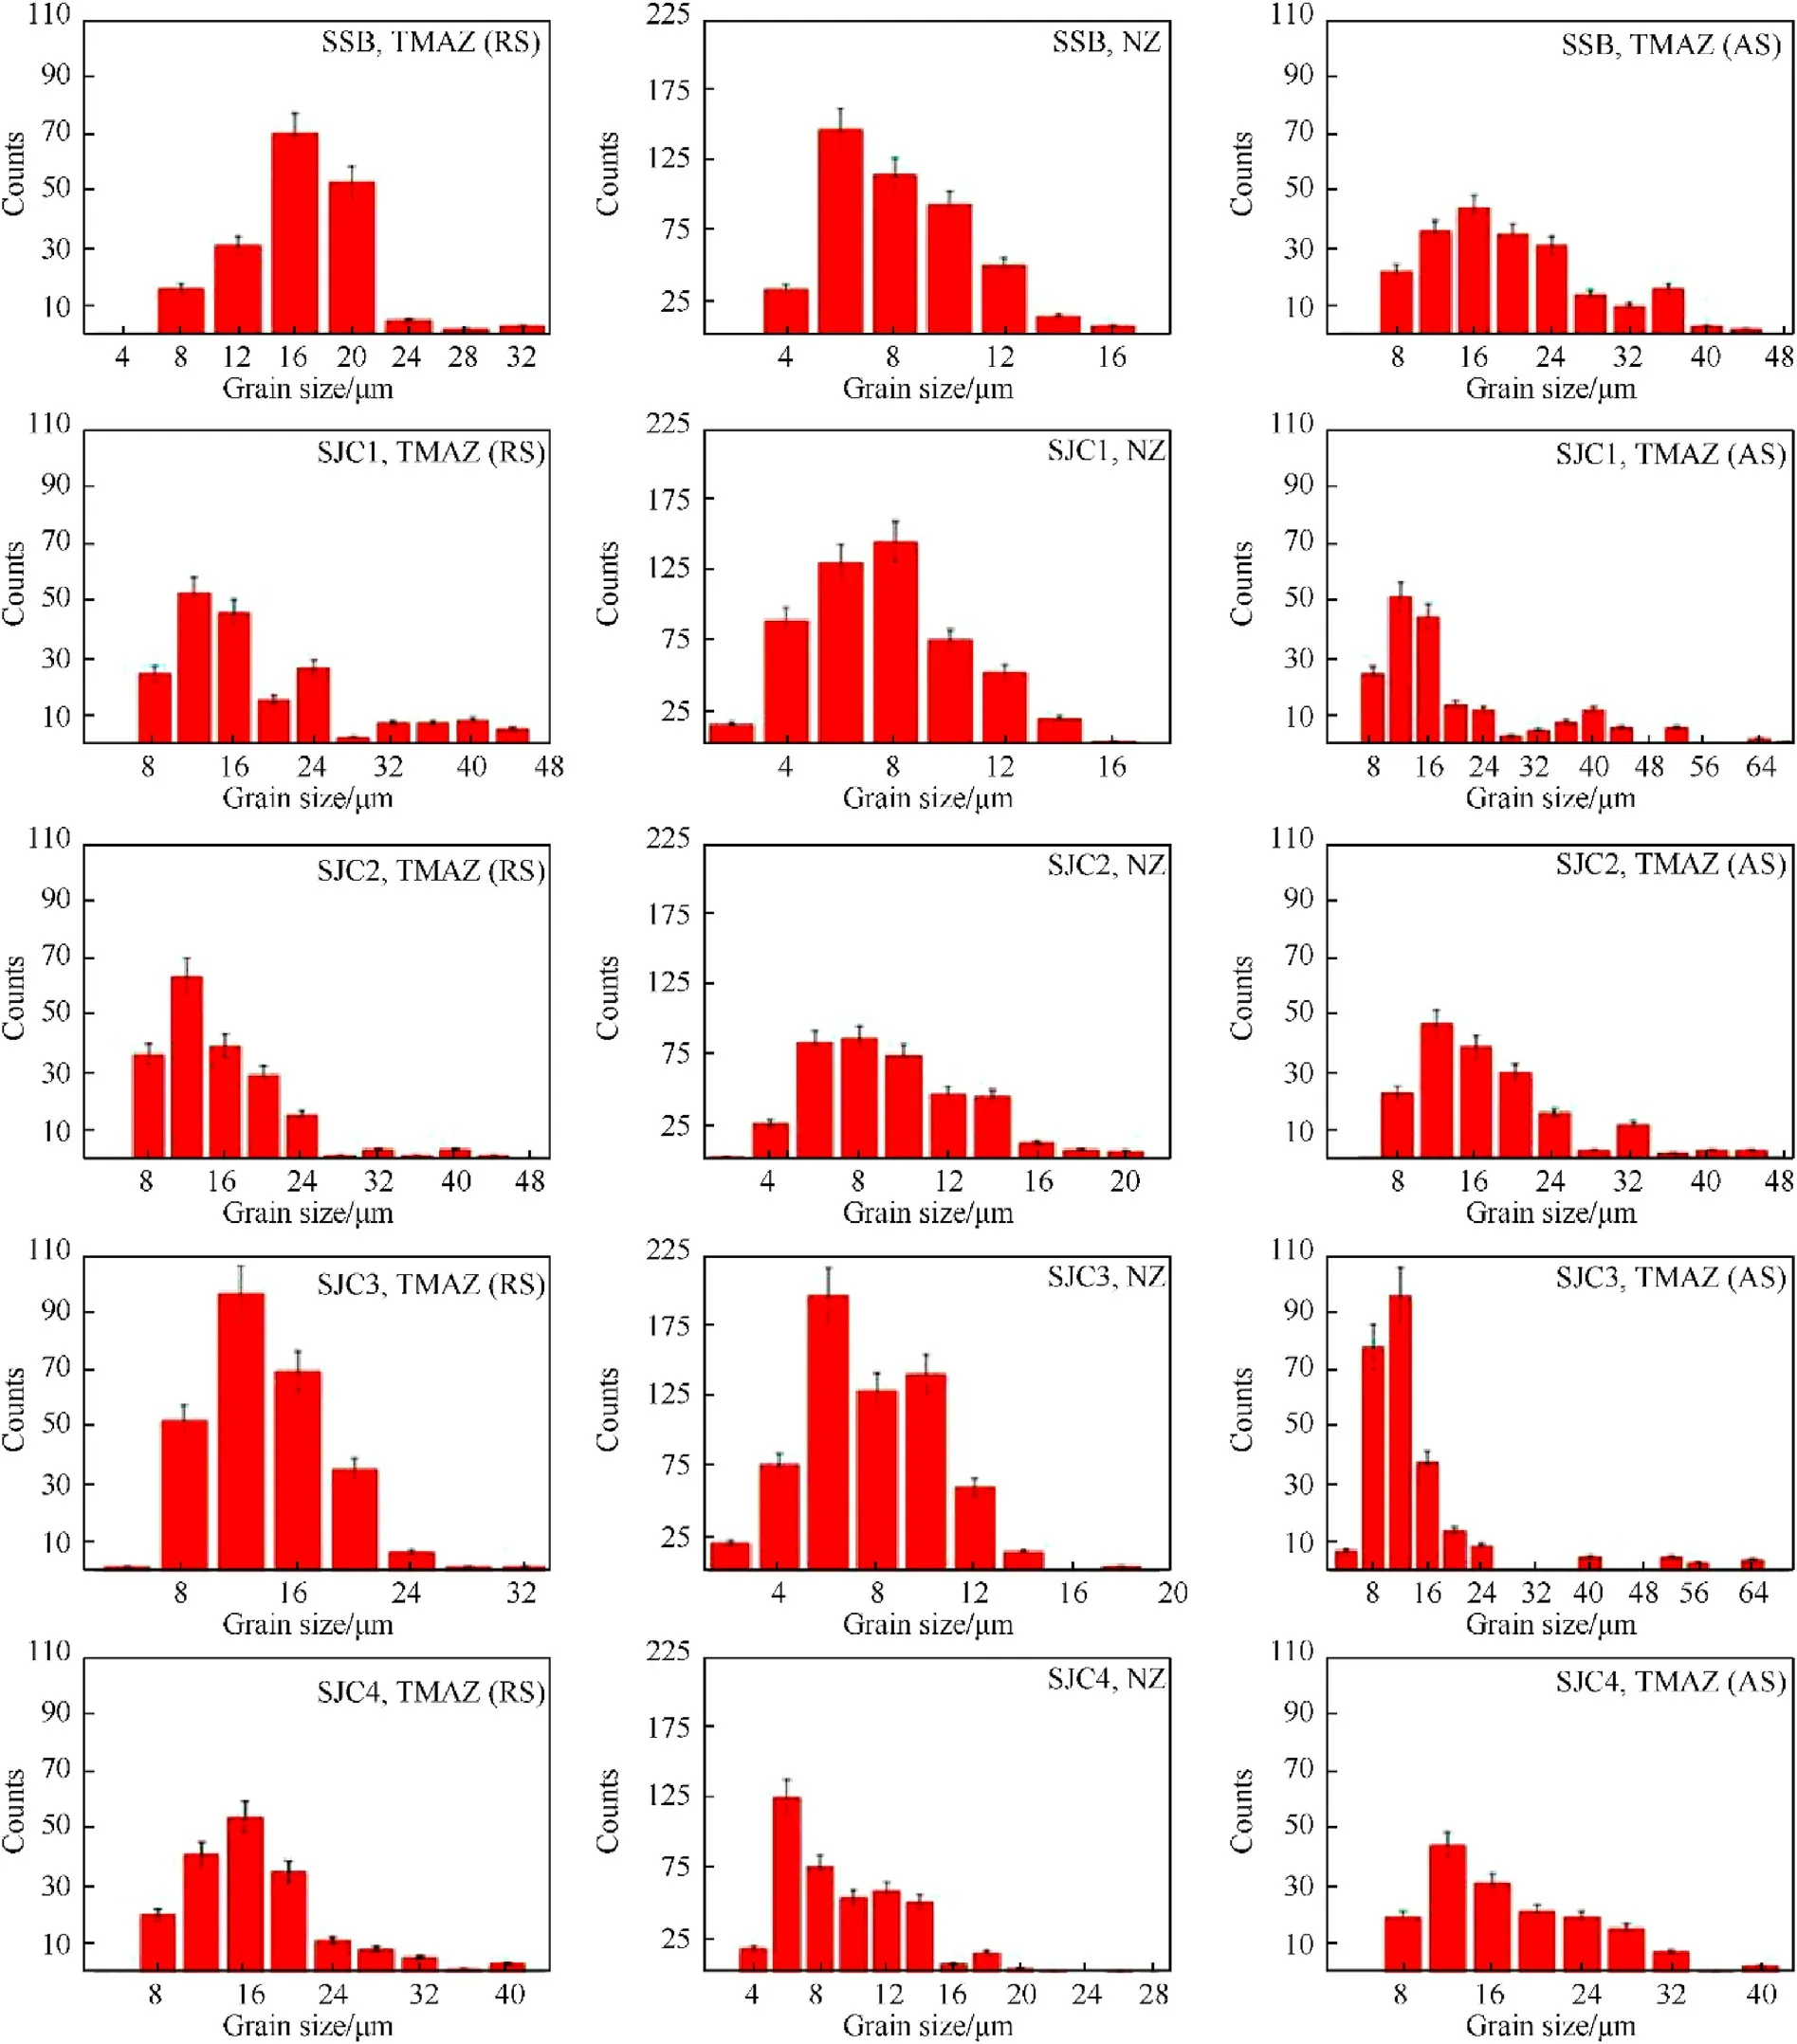
Fig.12. Grain size distribution analysis of TMAZ-AS, NZ and TMAZ-RS for different scarf angle configuration.
The fractographic analyses of the fractured specimens are shown in Fig. 16. In order to count for the position and mode of failure for all the specimens, a combined effect of heat input,hardness,grain size,and position of the joint line are to be carefully analyzed. It is already described in section 4.1 that due to the difference in the area under the shoulder and pin induced region for all the samples,the total heat generated will be in the order SJC3 >SJC1 >SSB >SJC2 >SJC4.This is also evident from the macrostructure specimens as shown in Fig.8.As minimum heat is available in SJC4 sample, it results in smaller nugget size, thereby decreasing the distance of the weld center to the interface and accordingly the sample failed outside the NZ[30].It has been observed that for SSB and SJC3 sample,the fracture occurs on the RS of NZ-TMAZ.Similar observation has been found in the literature [61,62]. This may be possibly due to less heat available on the RS of NZ- TMAZ that influences the overall grain size on the RS and AS. For all the samples, though the average grain size on the NZ appears to be similar.But there is a remarkable difference between the grain size on AS and RS in comparison to NZ. This paves a way out for initiating a fracture though the weakest point for all the samples,when subjected to tensile loading giving different fracture locations.Sample SJCI and SJC2 shows similar locations of fracture i.e.on the AS of NZ-TMAZ mainly due to lower hardness [37,40] and larger grains on AS compared to RS.In addition to this,the microstructure variation between the NZ-TMAZ may also influence the fracture location of the samples. The fracture surface morphology of SSB,SJC1 and SJC3 samples shows dimples of various shapes and sizes,which indicates the ductile mode of failure [30]. Zhang et al. [31]and Zhao et al. [42] also reported a dimple in the fracture surface indicating the ductile mode of failure. Whereas in SJC2 and SJC4 samples, a few dimples with cleavage and intercalated layered morphologies particularly for SJC2 can be observed indicating a mixed mode of failure. Fadaeifard et al. [1] also concluded the presence of deep dimple void,layered morphologies and some flat spaces designates a ductile-brittle mode of failure.The observation discussed above complies with the stress-stain plot shown in Fig. 15(a). This can also be supported by the low magnified close photograph of the fracture sample shown in Fig.16.
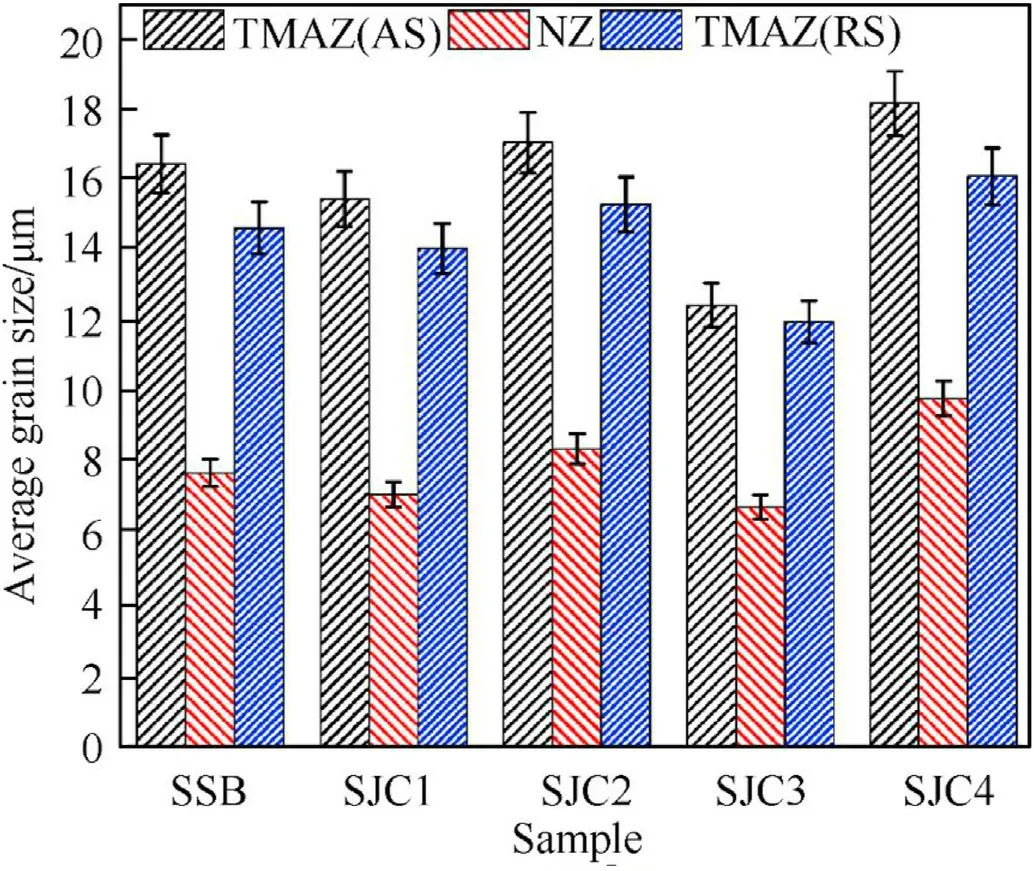
Fig.13. Comparison of grain size in a different region.
6. Conclusions
In the present study,an effort has been given to investigate the effect of scarf joint configuration on the overall joint quality, and mechanical properties of AA6061-T6 plate joint. The current investigation acts as the base study for implementing scarf joint configuration in FSW to check its capability to join AA6061-T6 over conventional butt joint techniques to enhance microstructural and mechanical properties.Based on the various analysis the important finding are listed below-
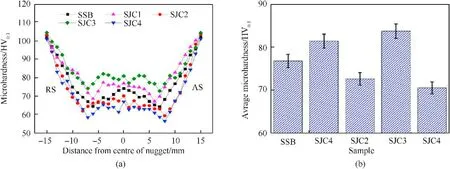
Fig.14. (a) Microhardness profile across the weld, (b) Variation of microhardness in different joint configuration.
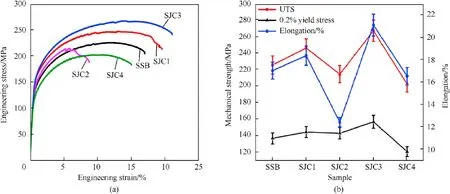
Fig.15. (a) Engineering stress/strain curves for different sample, (b) Comparison of UTS, 0.2% Yield strength and % elongation of different plate angle welded samples.
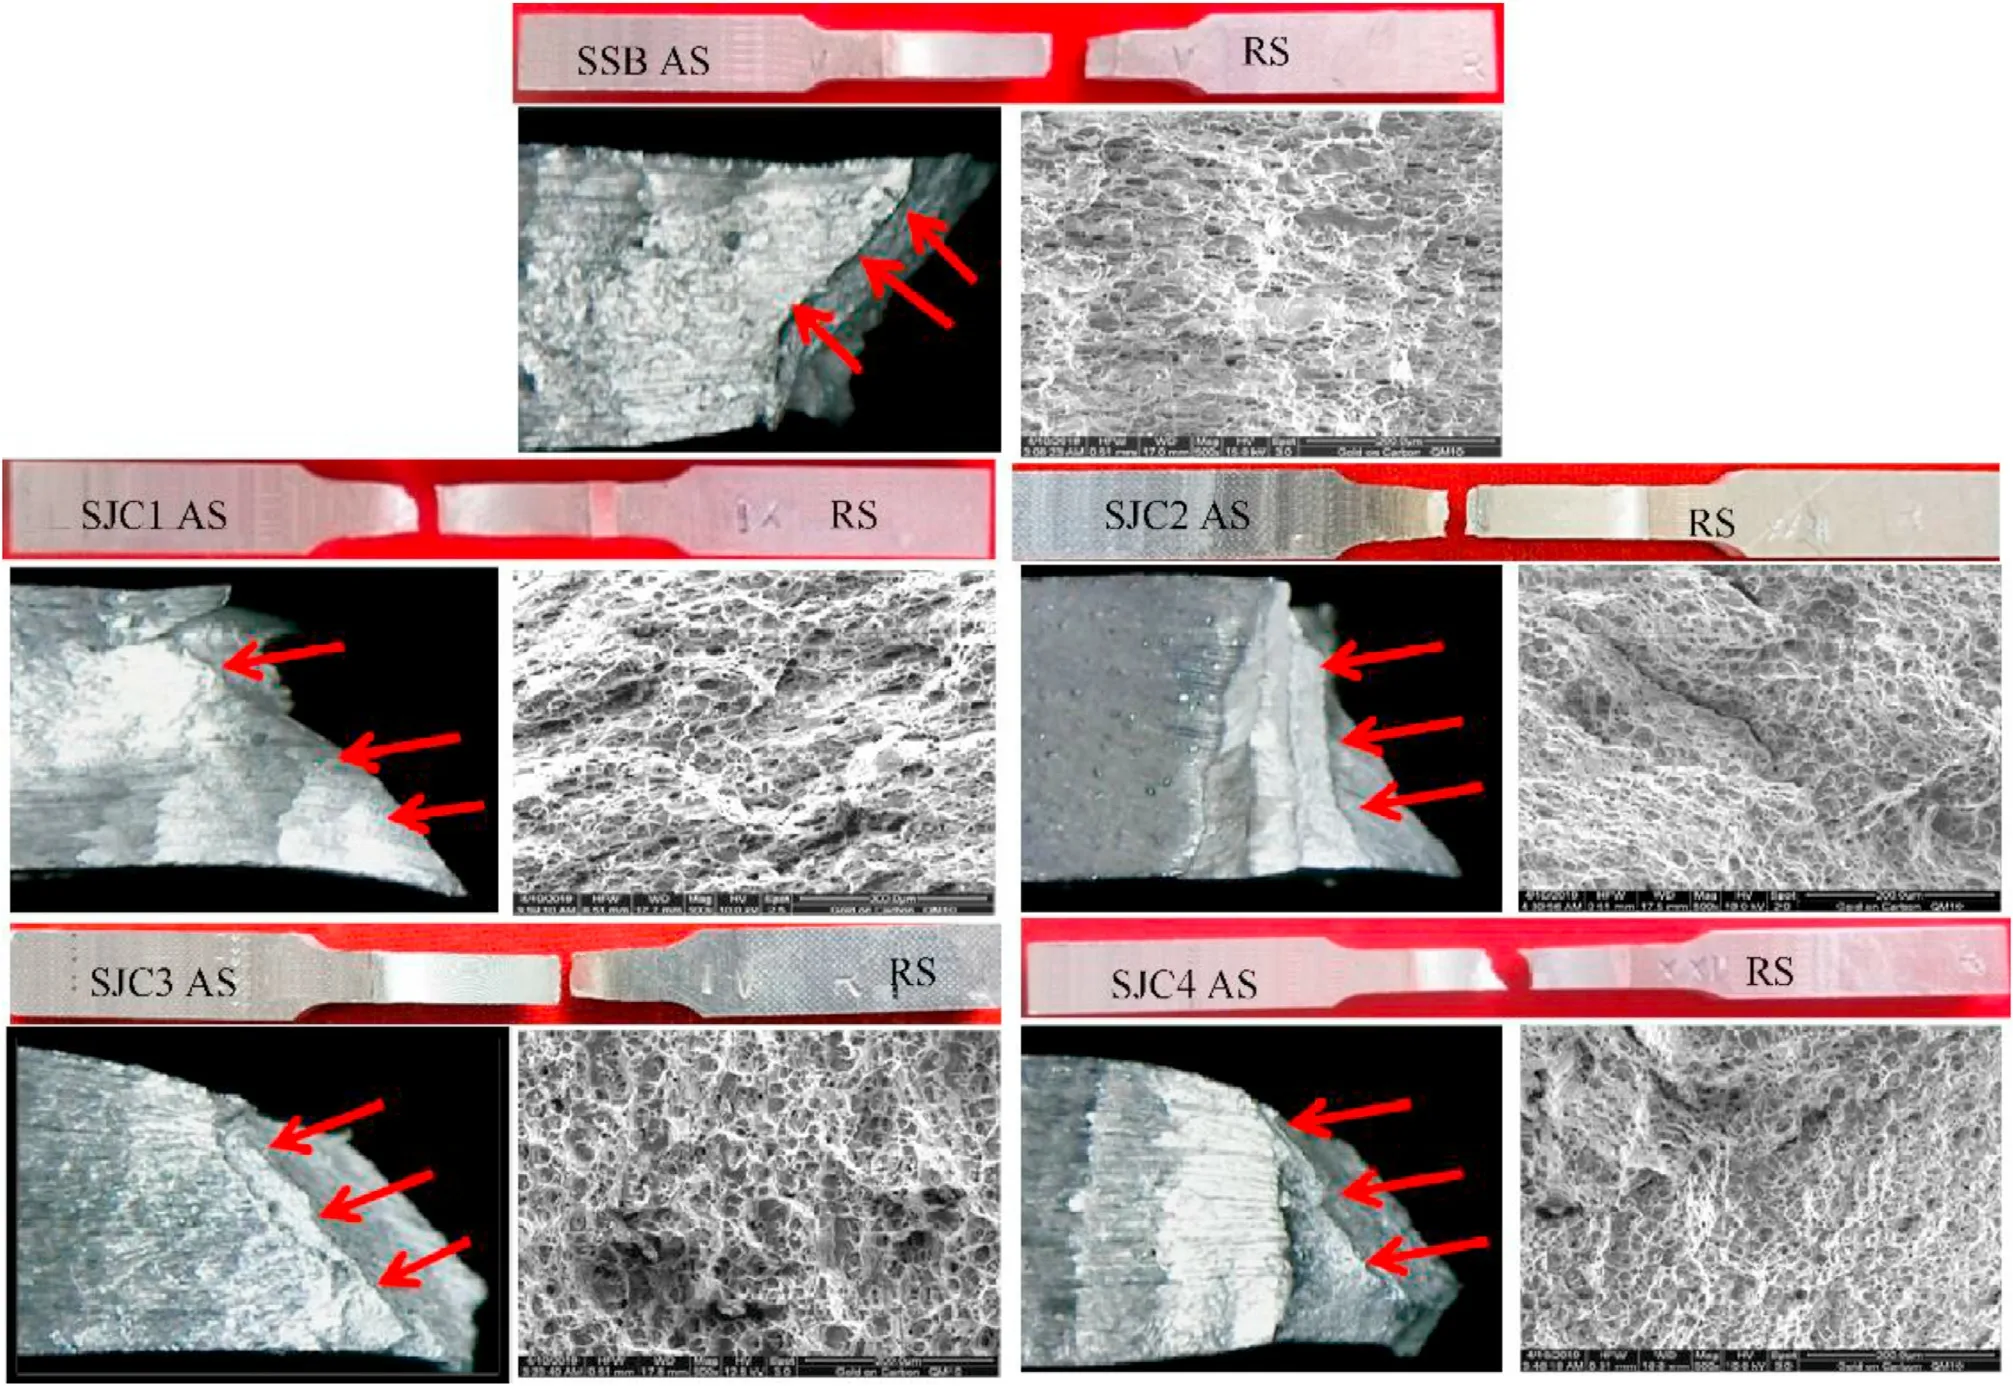
Fig.16. Variation of fracture type and fracture surface for different joint configuration.
• The force and torque distribution in the scarf joint configuration show a reduction in values compare to simple square butt joint.The decrease in X-force, Z-force and torque values has been recorded for SJC1 (1416 N, 10573 N, 15.99 N-m), and SJC3(1342 N, 10064 N, 15.47 N-m) compared to SSB (1463 N,11129 N,16.65 N-m). This suggested that using a proper scarf angle to minimize the energy required to deform the material,thereby reducing the welding’s operational cost.
• The study also indicates that with a decrease in scarf angle,AS’s material under the shoulder also escalates. This increase in the area further enterprises higher temperature (406C for SJC3 sample) associated with plastic deformation during welding compared to that of SSB type, thus facilitating better plasticization of the material.
• The size and the shape of grains and secondary precipitate reduce with decrease in scarf angle due to higher heat input in the weld zone. This assists the increase in average hardness in the nugget zone for weldment with using scarf angle(60)with maximum hardness of 80.91 HVcompared to 67.07 HVfor SSB.
• The use of Scarf joint also facilitates higher joint strength compared to conventional joint. The highest strength is observed for the SJC3 joint configuration with a scarf angle of 60, which is 13.5% more than the conventional SSB joint.
• The fractography of SJC1,SJC3 and SSB shows a ductile mode of failure,whereas the rest of the sample failed in a mixed-mode of failure.
• The mechanical property of scarf joints configuration indicates that the joints formed by SJC1 and SJC3 configuration are very much compatible with the joint formed by SSB type, having a higher mechanical strength, and ductility. This finding will definitely open a new arena for the mechanical property of welded joint.
The authors declare that they have no known competing financial interests or personal relationships that could have appeared to influence the work reported in this paper.
The authors like to acknowledge MSE and ACMS department,IIT Kanpur for their kind support and smooth conduct of the testing.The first author would like to acknowledge the Ministry of Human Resource and Development,Government of India for providing the financial assistantship in the form of fellowship.
- Defence Technology的其它文章
- Research on DSO vision positioning technology based on binocular stereo panoramic vision system
- Dynamics of luffing motion of a hydraulically driven shell manipulator with revolute clearance joints
- Blast performance of layered charges enveloped by aluminum powder/rubber composites in confined spaces
- Chemical design and characterization of cellulosic derivatives containing high-nitrogen functional groups: Towards the next generation of energetic biopolymers
- Multi-area detection sensitivity calculation model and detection blind areas influence analysis of photoelectric detection target
- Accurate analysis of limiting human dose of non-lethal laser weapons

