Analysis of inverse synthetic aperture radar imaging in the presence of time-varying plasma sheath
Yaocong XIE (谢曜聪), Xiaoping LI (李小平), Fangfang SHEN (沈方芳),Bowen BAI (白博文), Yanming LIU (刘彦明), Xuyang CHEN (陈旭阳)and Lei SHI (石磊)
School of Aerospace Science and Technology, Xidian University, Xi’an 710071, People’s Republic of China
Abstract The plasma sheath can induce radar signal modulation, causing not only ineffective target detection,but also defocusing in inverse synthetic aperture radar(ISAR)imaging.In this paper,through establishing radar echo models of the reentry object enveloped with time-varying plasma sheath,we simulated the defocusing of ISAR images in typical environment.Simulation results suggested that the ISAR defocusing is caused by false scatterings, upon which the false scatterings’formation mechanism and distribution property are analyzed and studied.The range of false scattering correlates with the electron density fluctuation frequency.The combined value of the electron density fluctuation and the pulse repetition frequency jointly determines the Doppler of false scattering.Two measurement metrics including peak signal-to-noise ratio and structural similarity are used to evaluate the influence of ISAR imaging.
Keywords: ISAR imaging, plasma sheath, time-varying, transmission line matrix, defocusing
1.Introduction
Inverse synthetic aperture radar (ISAR) imaging is a method for stationary radar to identify the type of target by observing moving targets [1, 2].Owing to its active, all-day and allweather imaging capability, the ISAR imaging technique has been widely used for civilian and military purposes.With respect to any hypersonic reentry objects, the ISAR can realize high-resolution two-dimensional images, which is of critical importance for subsequent operations of target recognition.Due to the reentry object’s high moving speed,it is difficult to obtain high-resolution ISAR images by using conventional imaging methods.On one hand, the high moving speed of the object will cause severe range migration,resulting in defocused ISAR images.On the other hand,when a reentry object penetrates through the Earth’s atmosphere,drastic friction happens to its surface with the atmosphere,generating extremely high temperatures.The tremendous heat dissociates and ionizes air molecules of the plasma sheath enveloping the object[3–5].This will change the propagation characteristics of electromagnetic (EM) waves, to which the amplitude attenuation and phase shift occur inevitably [6–9].Therefore, the plasma sheath enveloping the reentry object can deteriorate the performance of ISAR imaging.Most of the existing studies aim at correcting migration through range resolution cells (MTRC), whereas the work concerning the plasma sheath is still rare.In this work, we investigate the influence of the plasma sheath imposed on ISAR imaging.
Recently, researches concerning plasma sheaths have attracted much attention.Related studies have been conducted to evaluate the influence of the plasma sheath on the EM waves propagating within and through.Yang et al conducted an experiment and verified the parasitic modulation phenomenon of EM waves, in which sinusoidal time-varying plasma is considered [10].Bai et al established the spatiotemporal model of reentry object enveloped with timevarying plasma sheath, and explored the instantaneous transmission characteristics of EM wave propagation in timevarying plasma sheath [11].Yao et al proposed an electron density fluctuation model, which revealed the fluctuation law of electron density in the spatiotemporal frequency domain[12].These studies mainly focused on the transmission coefficient of time-varying plasma sheath.
Furthermore, the influence of plasma sheath on radar signals was investigated.Liu et al analyzed the mono-static radar cross section (RCS) of EM waves from X- to Ku-band by a blunt cone with nonuniform plasma enveloping.This indicated that the RCS depends heavily on the inhomogeneous plasma parameters [13].Song et al studied the intrapulse modulation of chirp signal caused by sinusoidal timevarying uniform plasma, and calculated the correlation between the continuous time-varying plasma and linear frequency modulation(LFM)pulse[14].The study revealed that the intra-pulse modulation causes the spectrum broadening phenomenon.Further, Chen et al studied the influence of sinusoidal time-varying nonuniform plasma sheath on radar echo.They revealed the relationship of the reflection coefficient with the varying electron density and thickness [15].Through investigating the one-dimensional range profile of the radar echo coupled with plasma sheath, Ding et al found that the plasma sheath not only causes many false targets but also mitigates the range profile,thus resulting in the detection failure [16].Despite the aforementioned achievements regarding radar detection in the presence of plasma sheath,however, those works mainly focused on one-dimensional radar signals.Hardly any research concerning two-dimensional ISAR is to be found so far.
In this work,we study the formation mechanism of ISAR imaging under the environment of time-varying plasma sheath, presenting a comprehensive analysis with respect to the effect of plasma sheath on ISAR imaging.Based on the transmission line matrix (TLM) method, the reflection characteristic of the time-varying plasma sheath is explored by calculating its magnitude and phase coefficients.Through incorporating the reflection coefficient, an ISAR imaging model enveloped with time-varying plasma is developed.Then, based on the obtained damaged ISAR image, a statistical analysis scheme is adopted and a comprehensive approach in terms of the range and azimuth dimensions is conducted.Simulation results suggest that the defocusing of ISAR images closely correlates with the time-varying characteristics of plasma sheath.The plasma sheath causes not only false peaks on the range dimension but also Doppler frequency diffusion on the azimuth dimension, thus resulting in defocusing of the ISAR images.In addition, the mechanism and property of the defocusing are verified through different simulations, and the performance of ISAR imaging is evaluated.
The remainder of this paper is organized as follows.Section 2 introduces the reflection coefficient of time-varying plasma sheath.Section 3 proposes the ISAR model of the reentry object enveloped by plasma sheath.Section 4 discusses the formation mechanism of false peaks on the range dimension.Section 5 analyzes the principle of Doppler frequency diffusion on the azimuth dimension.Section 6 analyzes simulation results of ISAR image defocusing caused by time-varying plasma sheath and evaluates the related influence effect.Section 7 summarizes conclusions.
2.Reflection coefficient of plasma sheath
In this section, the plasma sheath that envelopes the reentry object is studied, and the reflection coefficient is deduced based on TLM [17].
2.1.Reflection coefficient calculation of layered plasma sheath
As a nonuniform and non-magnetized plasma fluid, the plasma sheath enveloping the reentry object imposes a modulation effect on EM waves, causing amplitude attenuation and phase distortion of the reflected EM waves.The parameters of plasma sheath mainly include electron densityNe,plasma thicknesszmaxand collision frequencyve.In this paper, the time-varying parameter of plasma sheath is the electron density, which is commonly used in analyzing the time-varying characteristics of plasma.
In the RAM-C project,the distribution of electron density with distance at different altitudes is obtained in figure 1.According to the research of RAM-C, the electron density distribution approximates a double Gaussian distribution[18],which can be expressed as

wherezis the distance from the plasma sheath to the surface of its enveloped reentry object,Nepeakandz0are the peak electron density and its position, respectively,a1anda2are the shape parameters.
According to the distribution property of electron density[19], the nonuniform plasma sheath is stratified into a model withLlayer uniform plasma.Therefore, the plasma sheath can be modeled by its neighboring homogenous plasma layers that are stratified.Figure 2 shows a discrete approximation of the stratified plasma sheath, where the plasma sheath is stratified intoLlayers, and theL+ 1 layer is the object surface.In this case,the plasma frequency of the plasma sheath on the ith layer (denoted asωp,i) can be expressed as
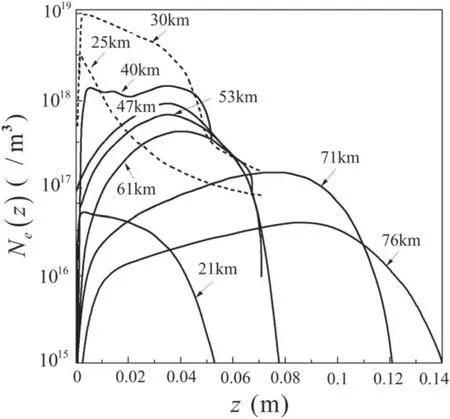
Figure 1.Mean profiles of electron density at different altitudes of RAM-C project.
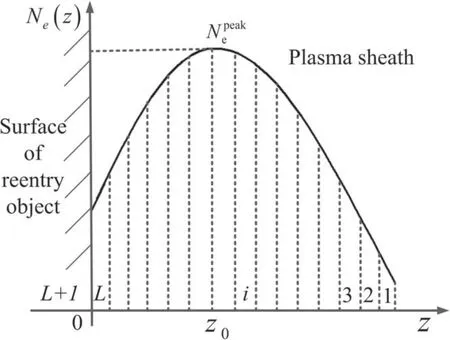
Figure 2.Neighboring homogeneous stratification model of the plasma sheath’s layers enveloping object surface.

wherei=1, 2, 3…L,eis the unit charge,meis the electron mass,ε0is the vacuum permittivity,Ne,iis the electron density of the ith layer.
The complex permittivity of the ith layerεiis expressed as

whereωis the angular frequency of the incident wave.
Then,we can calculate the transmission constant(ki)and intrinsic impedance (Zi) of the ith layer through using the following equations

whereμ0is the vacuum permeability.
Supposing thatθiis the incident angle of the ith layer,diis the plasma thickness of the ith layer, then the transmission matrix of the ith layer plasma sheath is obtained using TLM[20, 21], which is expressed as

whereAi,Bi,CiandDiare the elements of the transmission matrix.
According to microwave network theory, the total transmission matrix of the plasma sheath can be obtained by successively multiplying the transmission matrix of each layer, namely:

Since the reentry object is enveloped with plasma sheath,the reflection of EM waves comes from both the plasma sheath and the surface.For ease of calculation,we presuppose that the surface of the reentry object is made of metal.Then the reflection coefficient of the plasma-sheath-enveloped object surface can be obtained using the following equation[22]

whereZ0is the wave impedance of the EM waves in the incident medium.
Here, a simulation is conducted to evaluate the modulation effect of the plasma sheath.Specifically, a typical environment for an ISAR system is considered, where the transmitting frequency f0is set to X-band and the bandwidth is assumed as 1 GHz.The electron density and other parameters of the plasma sheath are obtained from computational fluid dynamics’ flow-field simulation data of the RAM-C for reentry vehicles[23].Throughout the simulation process,two scenarios involving steady-state and time-varying plasma sheaths are considered.
2.2.Reflection coefficient expression of steady-state plasma sheath
When the time-varying characteristics of electron density are not considered,the correlation among the incident frequency,the reflective amplitude and the reflective phase at different altitudes are shown in figure 3.Figures 3(a)and(b)show the amplitude and phase curves ofRversus ISAR bandwidth range with respect to different altitudes,respectively.It can be observed that during the bandwidth range, the amplitude remains almost constant at different altitudes, whereas the phase decreases linearly as the frequency increases.Based on the observation, the reflection coefficientRin frequency domain can be approximately expressed as
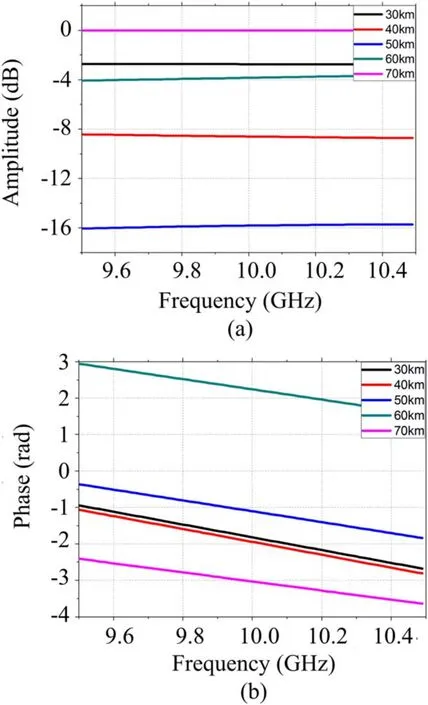
Figure 3.(a) Amplitude of reflection coefficient in ISAR frequency range, (b) phase of reflection coefficient in ISAR frequency range.

where the constantAdenotes the amplitude coefficient,θ0denotes the initial phase,kθdenotes the slope of the phase curve.
2.3.Reflection coefficient expression of time-varying plasma sheath
In practice,due to the presence of atmospheric turbulence and disturbance, the electron density of plasma sheath inevitably suffers from time-varying characteristics.The fluctuation frequency approximates to the burst frequency of the turbulence, which is supposed to vary from 20 kHz up to 100 kHz [24].For ease of analysis, in this paper, the sinusoidal fluctuation mode is therefore adopted to approximate its fluctuation properties.By using this mode, the sinusoidally-varying electron density can provide a universal model of nonlinear variation of the plasma sheath [15, 25, 26].
Supposing that the plasma sheath is uniformly discretized intoLlayers, then the time-varying electron densityNetvis the function of the timetand distancez,soNetvcan be expressed as

In the above equation, the electron densityNefollows a double Gaussian distribution,σis the fluctuation scale parameter,fNeis the electron density fluctuation frequency.Figure 4 illustrates the 3D diagram of the time-varying electron density,which shows that the time-varying electron density follows double Gaussian distribution in the distance domain and sinusoidal distribution in the time domain.
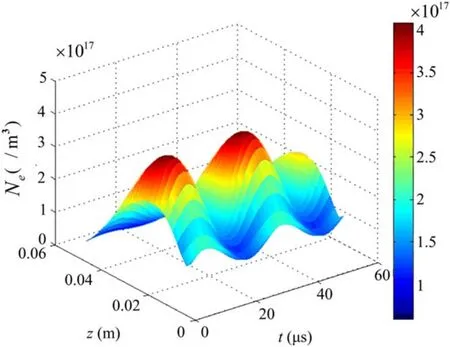
Figure 4.3D diagram of the time-varying electron density.

Figure 5.(a) Amplitude of reflection coefficient in ISAR frequency range, (b) phase of reflection coefficient in ISAR frequency range.
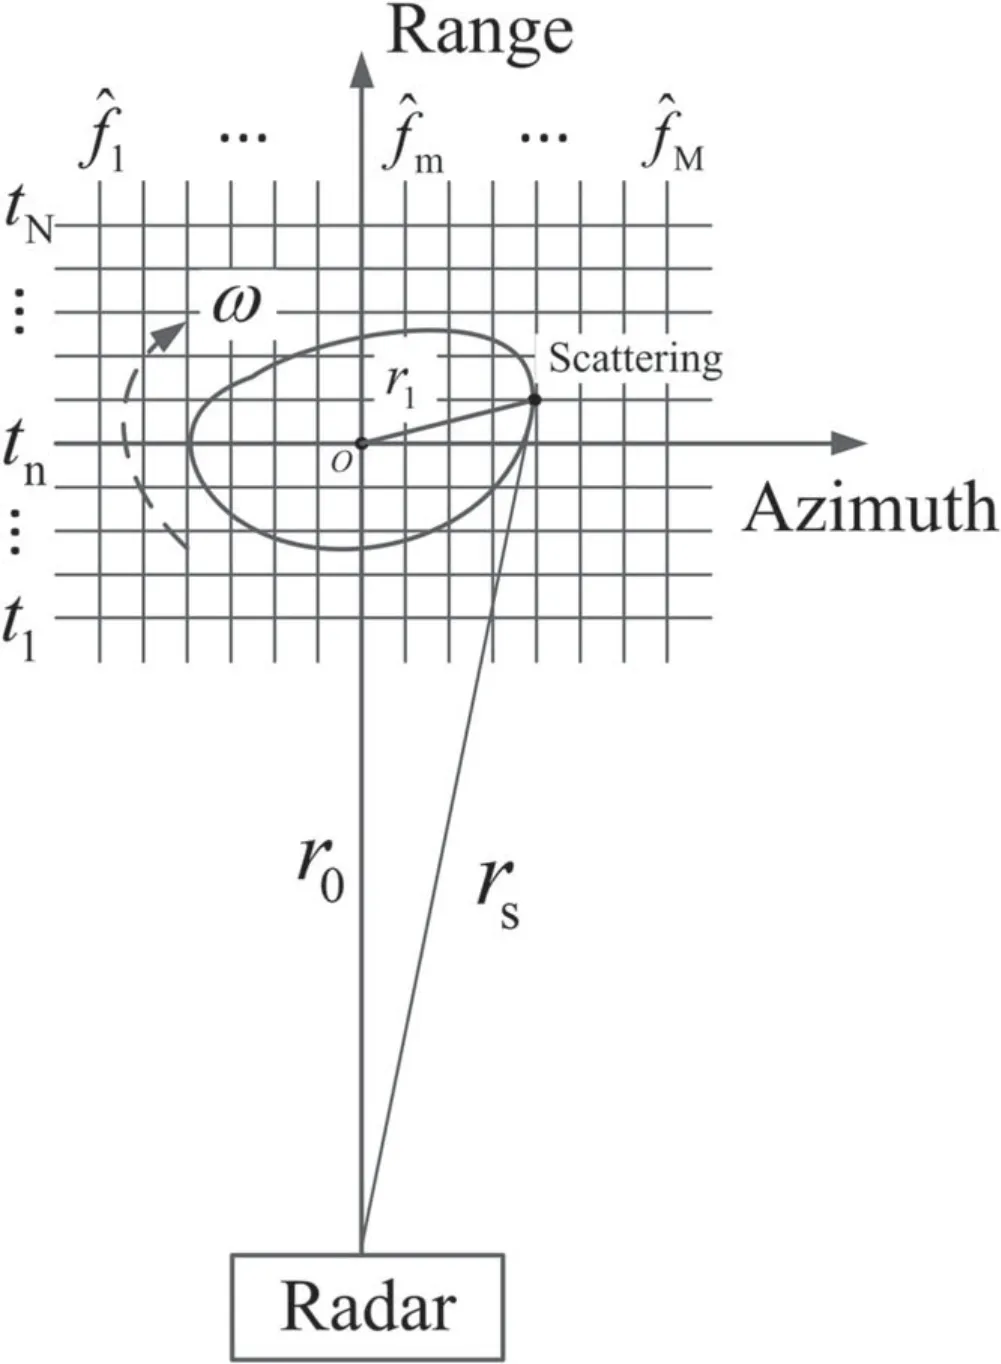
Figure 6.Diagram of ISAR imaging.
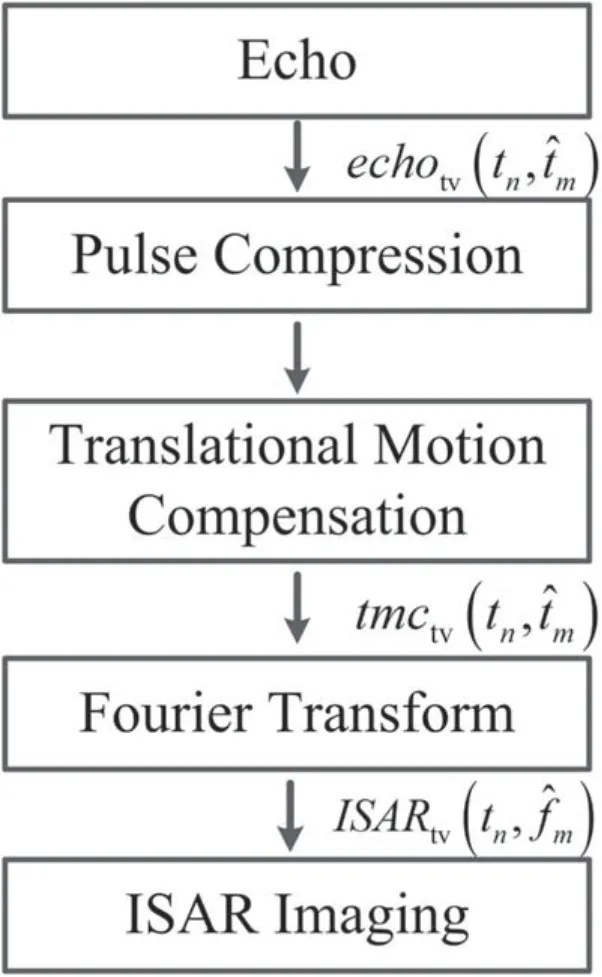
Figure 7.Flowchart of ISAR imaging using RD method.
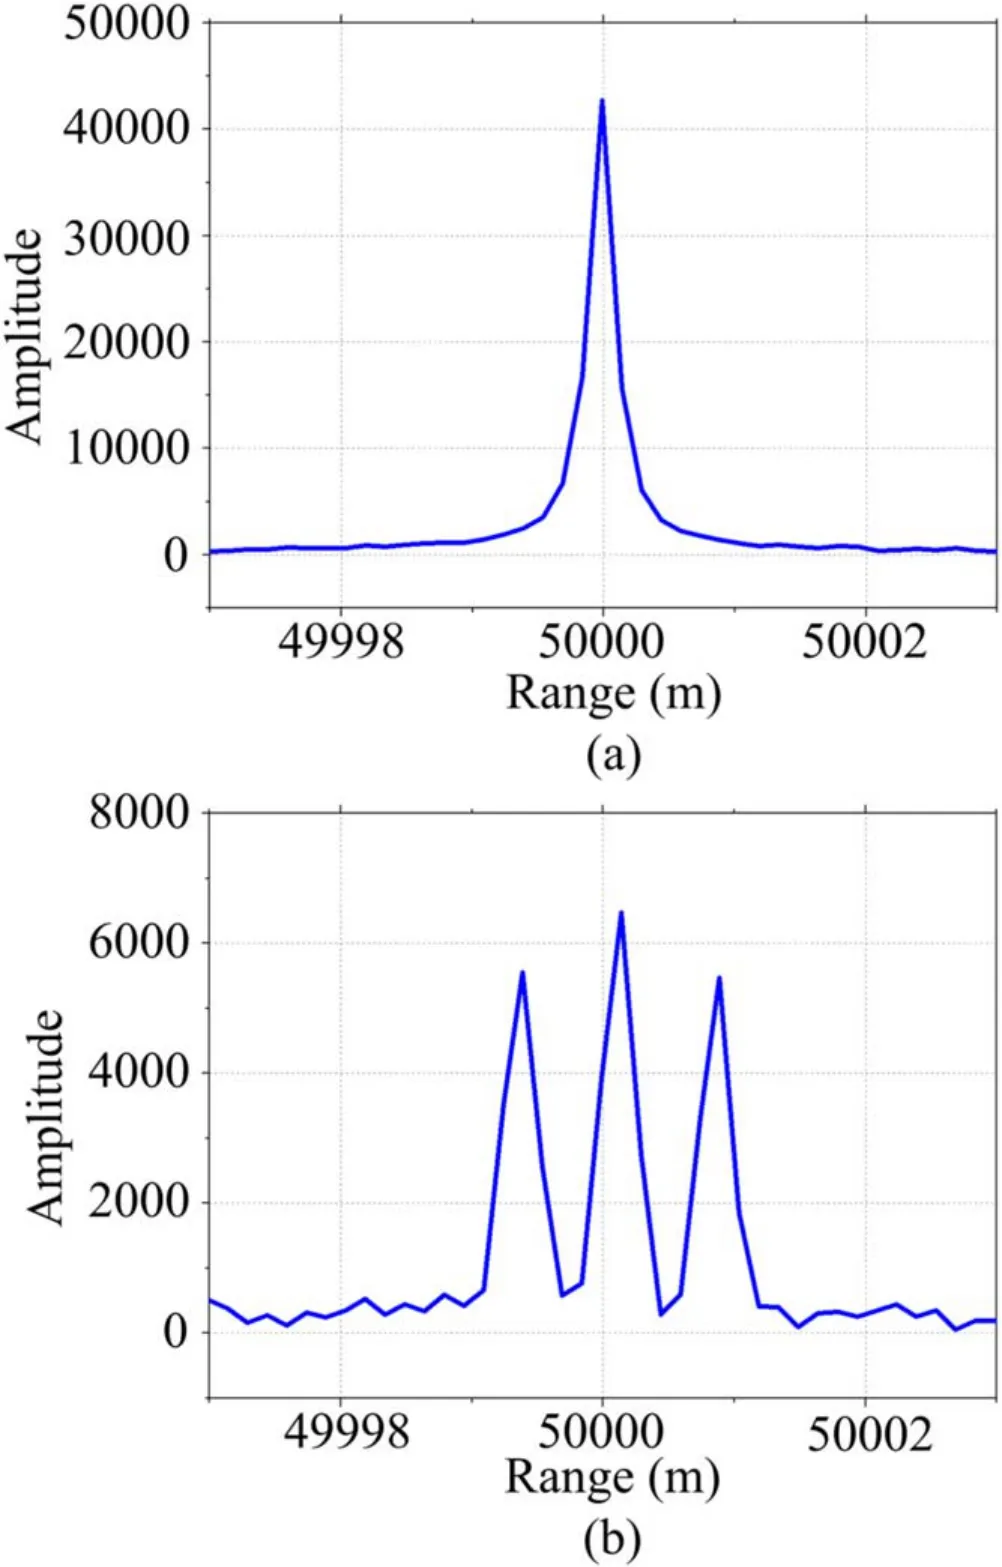
Figure 8.(a) Range profile without plasma sheath enveloping,(b) range profile enveloped with time-varying plasma sheath.
Similarly, the reflection coefficient in the presence of the time-varying plasma sheath is calculated using TLM.The amplitude and phase of the reflection coefficient at different altitudes are shown in figure 5.It can be seen from figures 5(a)and (b) that the reflective amplitude curve of each altitude fluctuates sinusoidally, whereas the phase curve exhibits an approximately linear decreasing as the frequency increases.
Motivated by the above findings, the frequency-domain reflection coefficient of the object surface enveloped with time-varying plasma sheathRtvcan be approximately expressed as

whereA0is the initial amplitude,A1is the sinusoidal curve amplitude of the reflective amplitude,fAis the sinusoidal fluctuation frequency of the amplitude curve,φ0is the initial phase of the sinusoidal curve.
3.ISAR imaging in the presence of time-varying plasma sheath
The relative motion between the reentry object and the radar includes two parts: translation and rotation [27, 28].In this work,the MTRC caused by translation motion is supposed to be compensated by translation motion compensation (TMC)[29].The motion target can be equivalent to the one rotating around the reference center in a fixed position during the coherent processing interval.Schematic diagram of the ISAR imaging is shown in figure 6, in whichois the reference center,r0is the radial distance between radar and reference center,rsis the radial distance between radar and scattering,r1is the distance of reference center and the scattering,ωis the rotation speed.The range dimension is divided intoNrange cells fromt1totN,the azimuth dimension is divided intoMDoppler cells fromto.
The LFM signal transmitted by the radar can be expressed as

whereTpis the pulse width,f0is the carrier frequency,μis the chirp rate,tnis the nth range cell in one pulse period being referred to as fast-time.
For multiple echoes,the echo expression can be obtained by

wherevis the radial velocity of the object,cis the speed of light,is the transmitting time of the mth pulse being referred to as slow-time.
When the time-varying plasma sheath is considered, the time-domain expression of reflection coefficient at the transmitting time ofcan be obtained by performing inverse Fourier transform (FT) on equation (11), which is expressed as
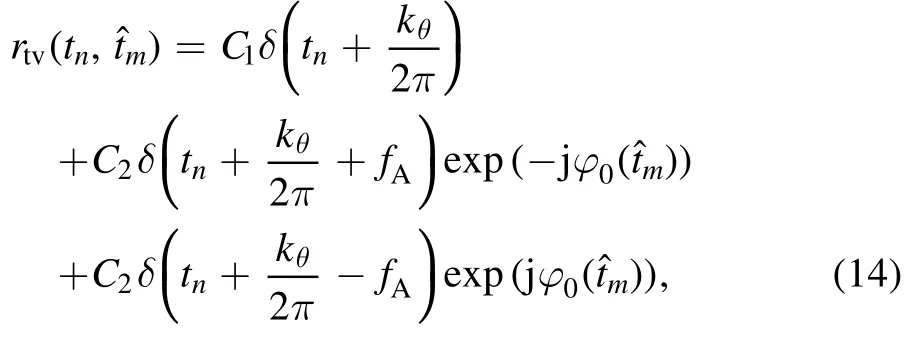
whereC1=A0exp ( jθ0),
Then the echo coupled with time-varying plasma sheath[13] is expressed as

where the symbol ⊗denotes convolution processing.
Range-Doppler (RD) algorithm has been widely used in ISAR imaging, whose flowchart is shown in figure 7.It can be observed that the range profile of scattering is obtained from pulse compression.Then, the pulse compression results of all echoes are compensated by the TMC method including envelope alignment and phase focus.The TMC result can be calculated by

whereρ0is the phase coefficient.
By performing FT on equation(16)with respect to slowtime, the ISAR image resultcan be expressed as

whereC0is a constant,τ0is the echo delay of scattering,fdis the Doppler frequency of scattering,is the mth Doppler cell,rtv(t n,)is the FT ofrtv(t n,)with respect to slowtime.The expressions of these parameters can be written as
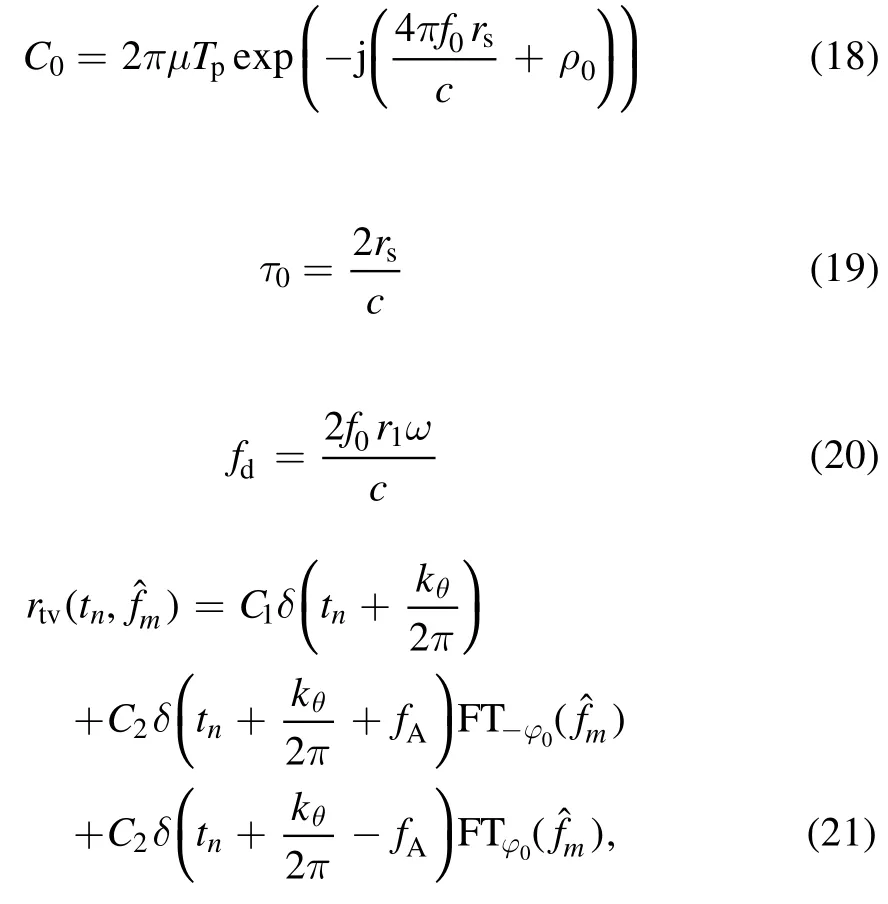
Then equation (17) can be rewritten as
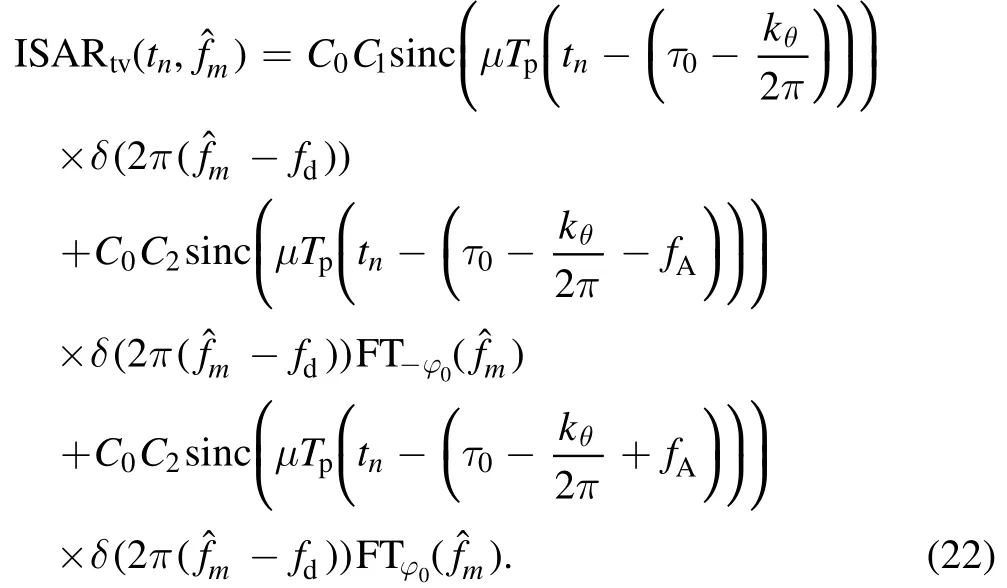
It can be obtained from the above equation (22)that the time-varying plasma sheath modulates the radar echo on the range and azimuth dimension, respectively.The existence ofδfunctions causes abnormal results of pulse compression.Furthermore,the presence of different initial phases destroys the coherence of the pulses, causing ineffective coherent accumulation.In subsequent sections, we analyze the influence of time-varying plasma sheath on ISAR imaging from two perspectives, i.e.range dimension and azimuth dimension.These analyses reveal the effect of pulse compression result on range dimension and the FT result on azimuth dimension caused by time-varying plasma sheath.
4.Influence mechanism on range dimension
In this section, we investigate the mechanism of abnormal range dimension result through deducing the pulse compression formula coupled with time-varying plasma sheath.
4.1.Formation mechanism of false scatterings
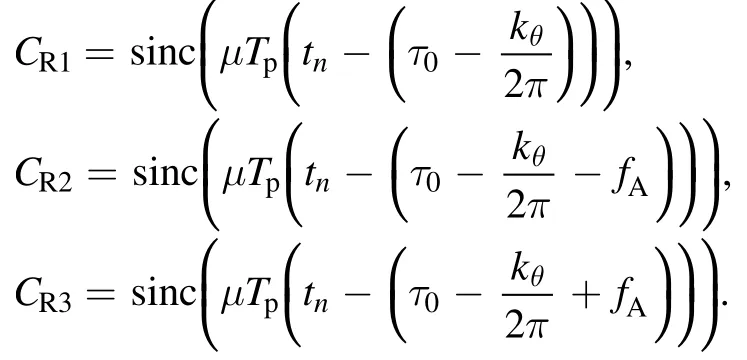
For ease of analysis on range dimension, the independent parameters of fast-time are replaced with constants, and equation (22) can be rewritten as
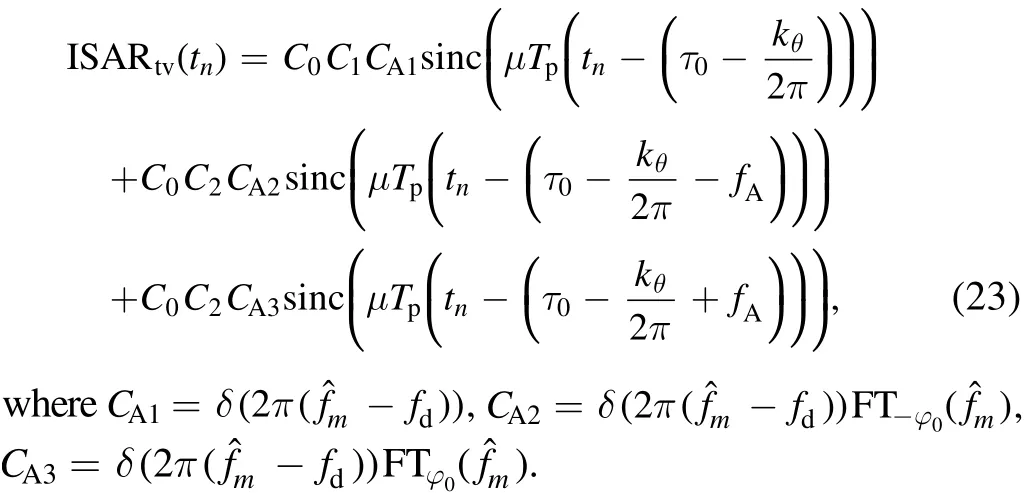
It can be seen from equation (23) that the range profile has three sinc functions with three peaks atrespectively.The above result suggests that the time-varying plasma sheath will cause an absolute echo delay offset offrom the actual echo delayτ0and produce two false scatterings.These scatterings distribute on the left and right sides of the real scattering,exhibiting a relative echo delay offset offAfrom the real one.
Figure 8 shows the range profile.In order to conduct a fair comparison, the range profile without plasma sheath is shown in figure 8(a).The abscissa is the distance corresponding to echo delay, the peak position represents the distance of the scattering.It can be seen from figure 8(a) that when the plasma sheath is not considered, single scattering represents a single peak,occurring at the position of 50 000 m(actual distance of the scattering).This position is assumed as the actual position of scattering.
Figure 8(b)demonstrates the range profile enveloped with time-varying plasma sheath.It can be seen that three peaks occur, among which the real scattering locates on the right of 50 000 m and the other two false scatterings distribute on both sides of the real one.This phenomenon demonstrates that the absolute echo delay offsetexists between the real peak and the actual position of scattering,and that the relative echo delay offsetfAexists between the real and the false scatterings.
4.2.Calculation of scattering position on range dimension
In equation(23),the offset parametersandfArepresent the values of echo delay.The function relation between distance and echo delay can be expressed as

Then the distance offset corresponding toandfAcan be written as

whereΔdθis the absolute distance offset on range dimension between the real scattering and the actual position,ΔdAis the relative distance offset on range dimension between the real and false scatterings.
For LFM waves,the signal frequency traverses the whole bandwidth during pulse width.This indicates that the fluctuation of electron density during pulse width matches with the amplitude fluctuation of reflection coefficient in signal bandwidth.
Then, the expression offAcan be written as

whereBis the bandwidth.
By substituting equation (27) into (26), we obtain

It can be seen thatΔdθis correlated with the phase-frequency characteristics of the plasma sheath’s reflection coefficient,and thatΔdAis proportional to the fluctuation frequency of electron densityfNe.
5.Influence mechanism on azimuth dimension
The azimuth dimension correlates with the Doppler frequency that is caused by scattering rotation, to which multiple echo data are needed to conduct coherent analysis.
5.1.Formation mechanism of Doppler diffusion
For ease of analysis on range dimension, independent parameters of slow-time are replaced with constants, hence,equation (22) can be rewritten as

where
The initial phase φ0()is the phase of plasma reflection coefficient amplitude curve when the pulse transmitted attime enters into the plasma sheath, which can be considered as sampling operation to the sinusoidal curve of the reflection coefficient amplitude.
The sampling frequency is fr,and the fluctuation frequency of amplitude curve is the same as the electron density fNe,which ranges from 20 up to 100 kHz, exceeding fr.For most of the time, fNeis not an integral multiple of fr.Therefore, the initial phases corresponding to each echo φ0()will differ.
The initial phase fluctuation frequency is denoted as fIP,so the initial phase φ0()can be expressed as


By substituting equations (31) and (32), equation (29)can be rewritten as

It can be seen from the above equation(33)that the azimuth profile has threeδ functions with three peaks at fd,fd-fIPand fd+fIP,which are the Doppler frequency of the real scattering and the other two false scatterings,respectively.
Figure 10 shows the azimuth profile, in which figure 10(a) is the azimuth profile without plasma sheath enveloping.The curve peak represents the Doppler frequency of the real scatter,which is denoted as fd.Figure 10(b)is the azimuth profile enveloped with time-varying plasma sheath.
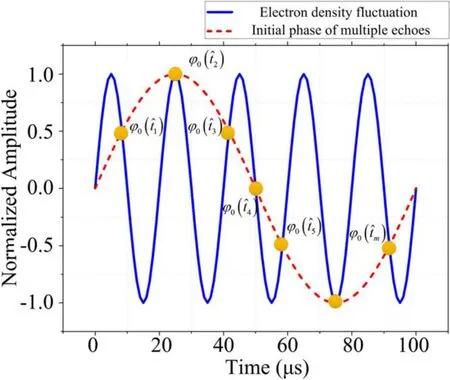
Figure 9.Electron density fluctuation and initial phase fluctuation.
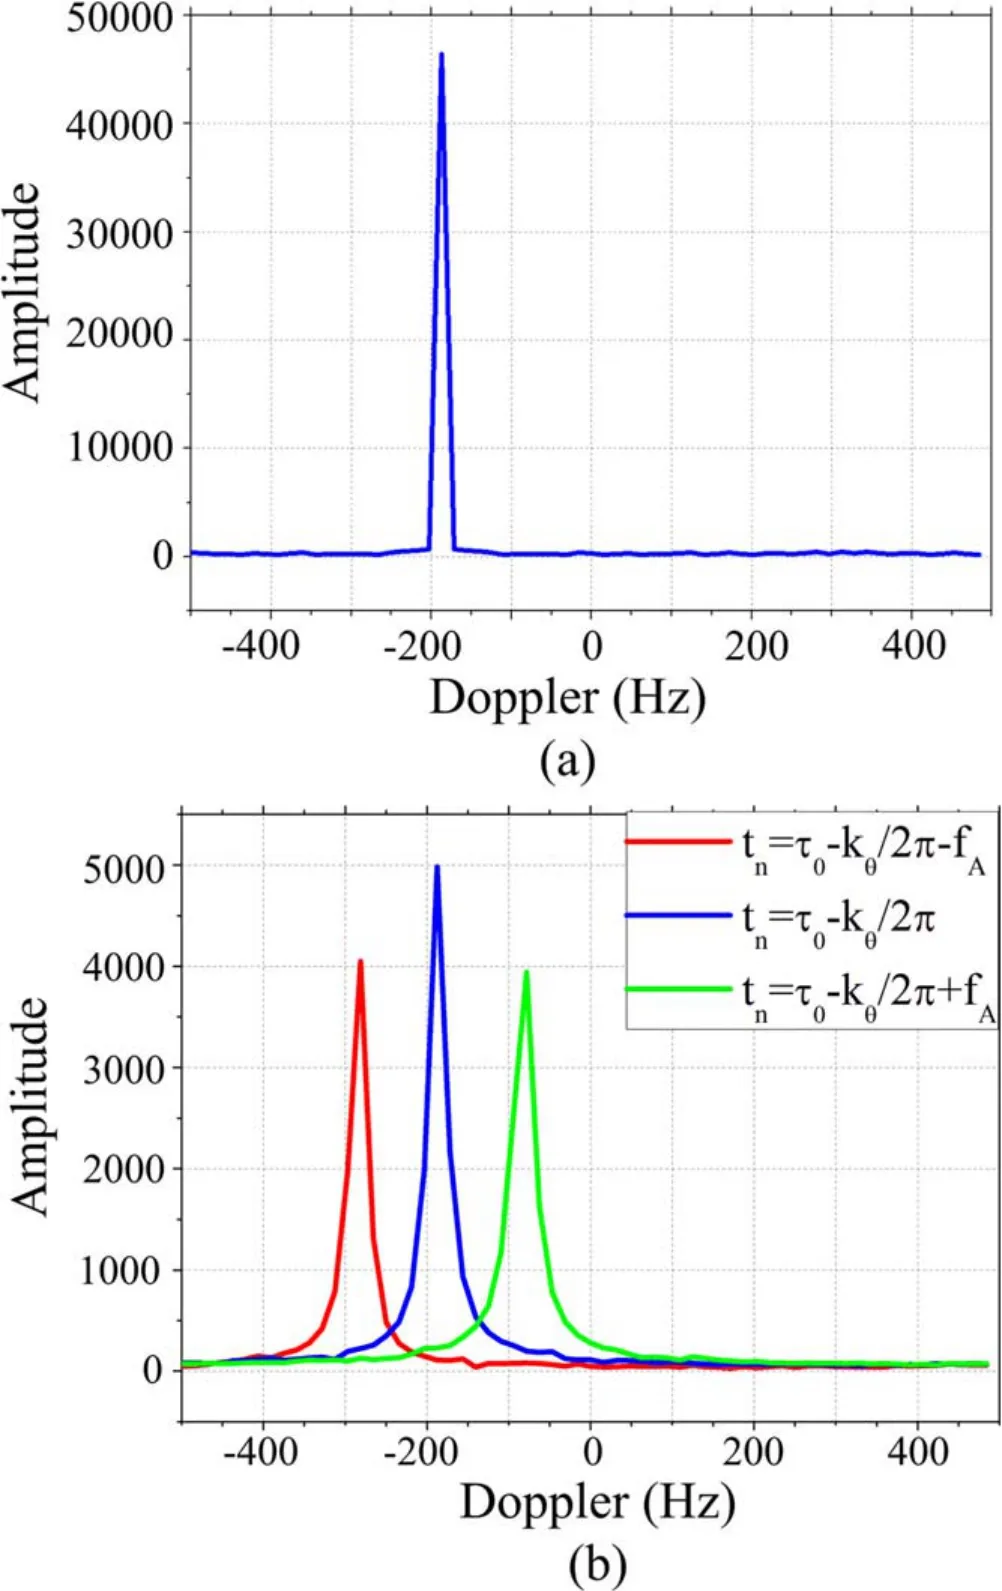
Figure 10.(a) The azimuth profile without plasma sheath enveloping, (b) the azimuth profile enveloped with time-varying plasma sheath.
In response to figure 10, the blue curve represents the azimuth profile with the range cell ofthe red curve and green curve represents the azimuth profile with the range cell ofrespectively.Accordingly, the peak of the blue curve is Doppler frequency fd,the red isfd-fIPand the green isfd+fIP.
5.2.Doppler frequency calculation of false scatterings on azimuth dimension
Due to the asynchronization existing between the fluctuation frequency of electron density and the pulse repetition frequency(PRF),the initial phase fluctuation frequency does not have a fixed value, which can be expressed as

where fris the PRF,k is an integer.
Considering the limitation of Doppler ambiguity, the Doppler frequencies of the aforementioned two false scatterings are variable between the interval of,thenk requires the following conditions to be satisfied

This suggests that the Doppler frequencies of the false scatterings can be any arbitrary value of the frequency ranging fromwith a certain combination of fNeand fr.
When fNeis an integral multiple of fr,the value of fIPis zero, at which moment these two false scatterings have the same Doppler frequency fdas that of the real one.
6.Simulation analysis on ISAR imaging
In this section, we analyze the simulation results of ISAR imaging, in which the modulation type of radar signal is LFM, the carrier frequency is 10 GHz, the bandwidth is 1 GHz, the pulse width is 100 μs, the PRF fris 1 kHz.The peak electron density Nepeak,the plasma thickness zmax,the collision frequency veand other parameters originate from the computational-fluid-dynamics’ flow-field simulation data of RAM-C for the reentry object with the altitude of 50 km and the speed of 15 Mach.The above parameters are listed out in table 1.
Based on the analysis results of ISAR imaging effect on range and azimuth dimensions, different fluctuation frequencies of the electron density are set as some specific values to iterate the possibilities of various defocusing results on range and azimuth dimensions.
6.1.Simulation results of false scattering distribution on range dimension
In order to simulate the distribution of the false scatterings on range dimension, the fluctuation frequencies of electron density were set from 20 to 100 kHz with 20 kHz interval,during which the radar system parameters are considered.The value ofΔdAwas calculated using equation (28),kandfIPwere calculated using equations (34) and (35), to which the results were presented in table 2.Δdθis the same value at different electron density fluctuation frequencies.The value ofΔdθis 0.036 m, which is calculated using equation (25).The ISAR imaging results of single scattering enveloped with time-varying plasma sheath featuring different electron density fluctuation frequencies are shown in figure 11.The ISAR image without plasma sheath enveloping is shown infigure 11(a).The range of real scattering is 50 km, and the Doppler frequency is -200 Hz.Figure 11(b) is the ISAR image of single scattering enveloped with 20 kHz timevarying plasma sheath.Two false scatterings appear above and below the real scattering respectively, and the relative distance offset between real and false scatterings is 0.3 m.The Doppler frequency of false scatterings is the same as the real one, suggesting that the value offIPis 0 Hz.

Table 1.Values of Ne peak ,zmax and ve.

Table 2.Values of f Ne ,ΔdA , k and fI P.
Figures 11(c)–(f) are the ISAR images with electron density fluctuation frequencies at 40–100 kHz, from which it can be seen that the higher electron density fluctuation frequency, the larger relative distance offset between false scatterings and the real one.
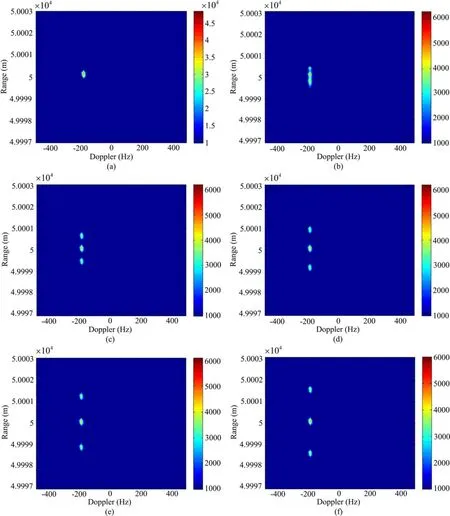
Figure 11.(a) ISAR image without plasma sheath, (b) ISAR image with time-varying plasma sheath when=20 kHz,(c) ISAR image with time-varying plasma sheath when=40 kHz,(d)ISAR image with time-varying plasma sheath when=60 kHz,(e)ISAR image with time-varying plasma sheath when=80 kHz,(f) ISAR image with time-varying plasma sheath when=100 kHz.
6.2.Simulation results of false scatterings distribution in azimuth dimension
In order to simulate the distribution of the false scatterings in azimuth dimension, considering the radar system parameters,the frequencies of electron density fluctuation were set from 50 to 50.5 kHz with 0.1 kHz interval.The Doppler frequency of real scatteringfdis -200 Hz, the values ofΔdAandfIPwere calculated.The results are listed in table 3.
The ISAR imaging results of single scattering with different electron density fluctuation frequencies of time-varying plasma sheath are shown in figure 12.WhenfNeis 50 kHz,the real scattering is accompanied with two false scatterings above and below it.SincefIPis 0 Hz, the real and the false scatterings have the same Doppler frequency-200 Hz,which is shown in figure 12(a).WhenfNeis 50.1 kHz,fIPincreases to 100 Hz, the Doppler frequencies of false scatterings(fd-fIPandfd+fIP) are no longer the same as that of the real one, and the false scatterings move along the azimuth dimension.
As shown in figure 12(b),the Doppler frequency of false scattering farther in range increasesfIP,moving to right,whereas the false scattering closer in range reducesfIP,moving to left.Figures 12(c)–(f) are the ISAR images with electron density fluctuation frequencies from 50.2 to 50.5 kHz,ΔdAof various frequencies exhibits small differences, and fIPincreases with the increasing of the frequency fNe.The Doppler frequency offset between the real and false scattering in azimuth dimension increases with fIP.When the Doppler frequency of the false scattering exceedsthe false scattering folds over to the other half of the ISAR image, as shown in figures 12(e) and (f).

Table 3.Values of f Ne ,ΔdA , k, fI P,fd-fIP andfd+fI P .
6.3.Simulation and evaluation on ISAR imaging of object enveloped with time-varying plasma sheath
In this subsection, the distribution of false scatterings on the range and azimuth dimensions is analyzed, which correlates with the electron density fluctuation frequency.The objective of the aforementioned study is single scattering, hereinafter the analysis focuses on multiple scatterings of the plasma-sheath-enveloped object (reentry spacecraft model),after which the quality of defocused ISAR imaging is evaluated.
Figure 13 shows the ISAR imaging results of the reentry object with different electron density fluctuation frequencies.Specifically, figure 13(a) is the ISAR image of the object without plasma sheath enveloping, in which all the scatterings consisting of the object image can be clearly identified.Figure 13(b)is the ISAR imaging of the object with a 20 kHz plasma sheath which begins to blur.Figure 13(c)is the ISAR imaging of the object with a 50 kHz plasma sheath, whose blurry profile expands along the range dimension with a more obvious trend.Figure 13(d)is the ISAR imaging of the object with a 50.1 kHz plasma sheath, expanding along the range and azimuth dimensions.The expansion along the azimuth dimension is greater than that along the range dimension,which appears to be an overlapping of three object images of one real image and two false images.Figure 13(e) is the ISAR imaging of the object with a 50.4 kHz plasma sheath,whose expansion along the azimuth dimension is further increased.The false images separate from the real image,which may result in the misjudgment of ISAR imaging on the number of reentry objects.Figure 13(f) is the ISAR imaging of the object with a 100 kHz plasma sheath, in which the expansion does not exist on the azimuth dimension but exists on the distance dimension significantly.
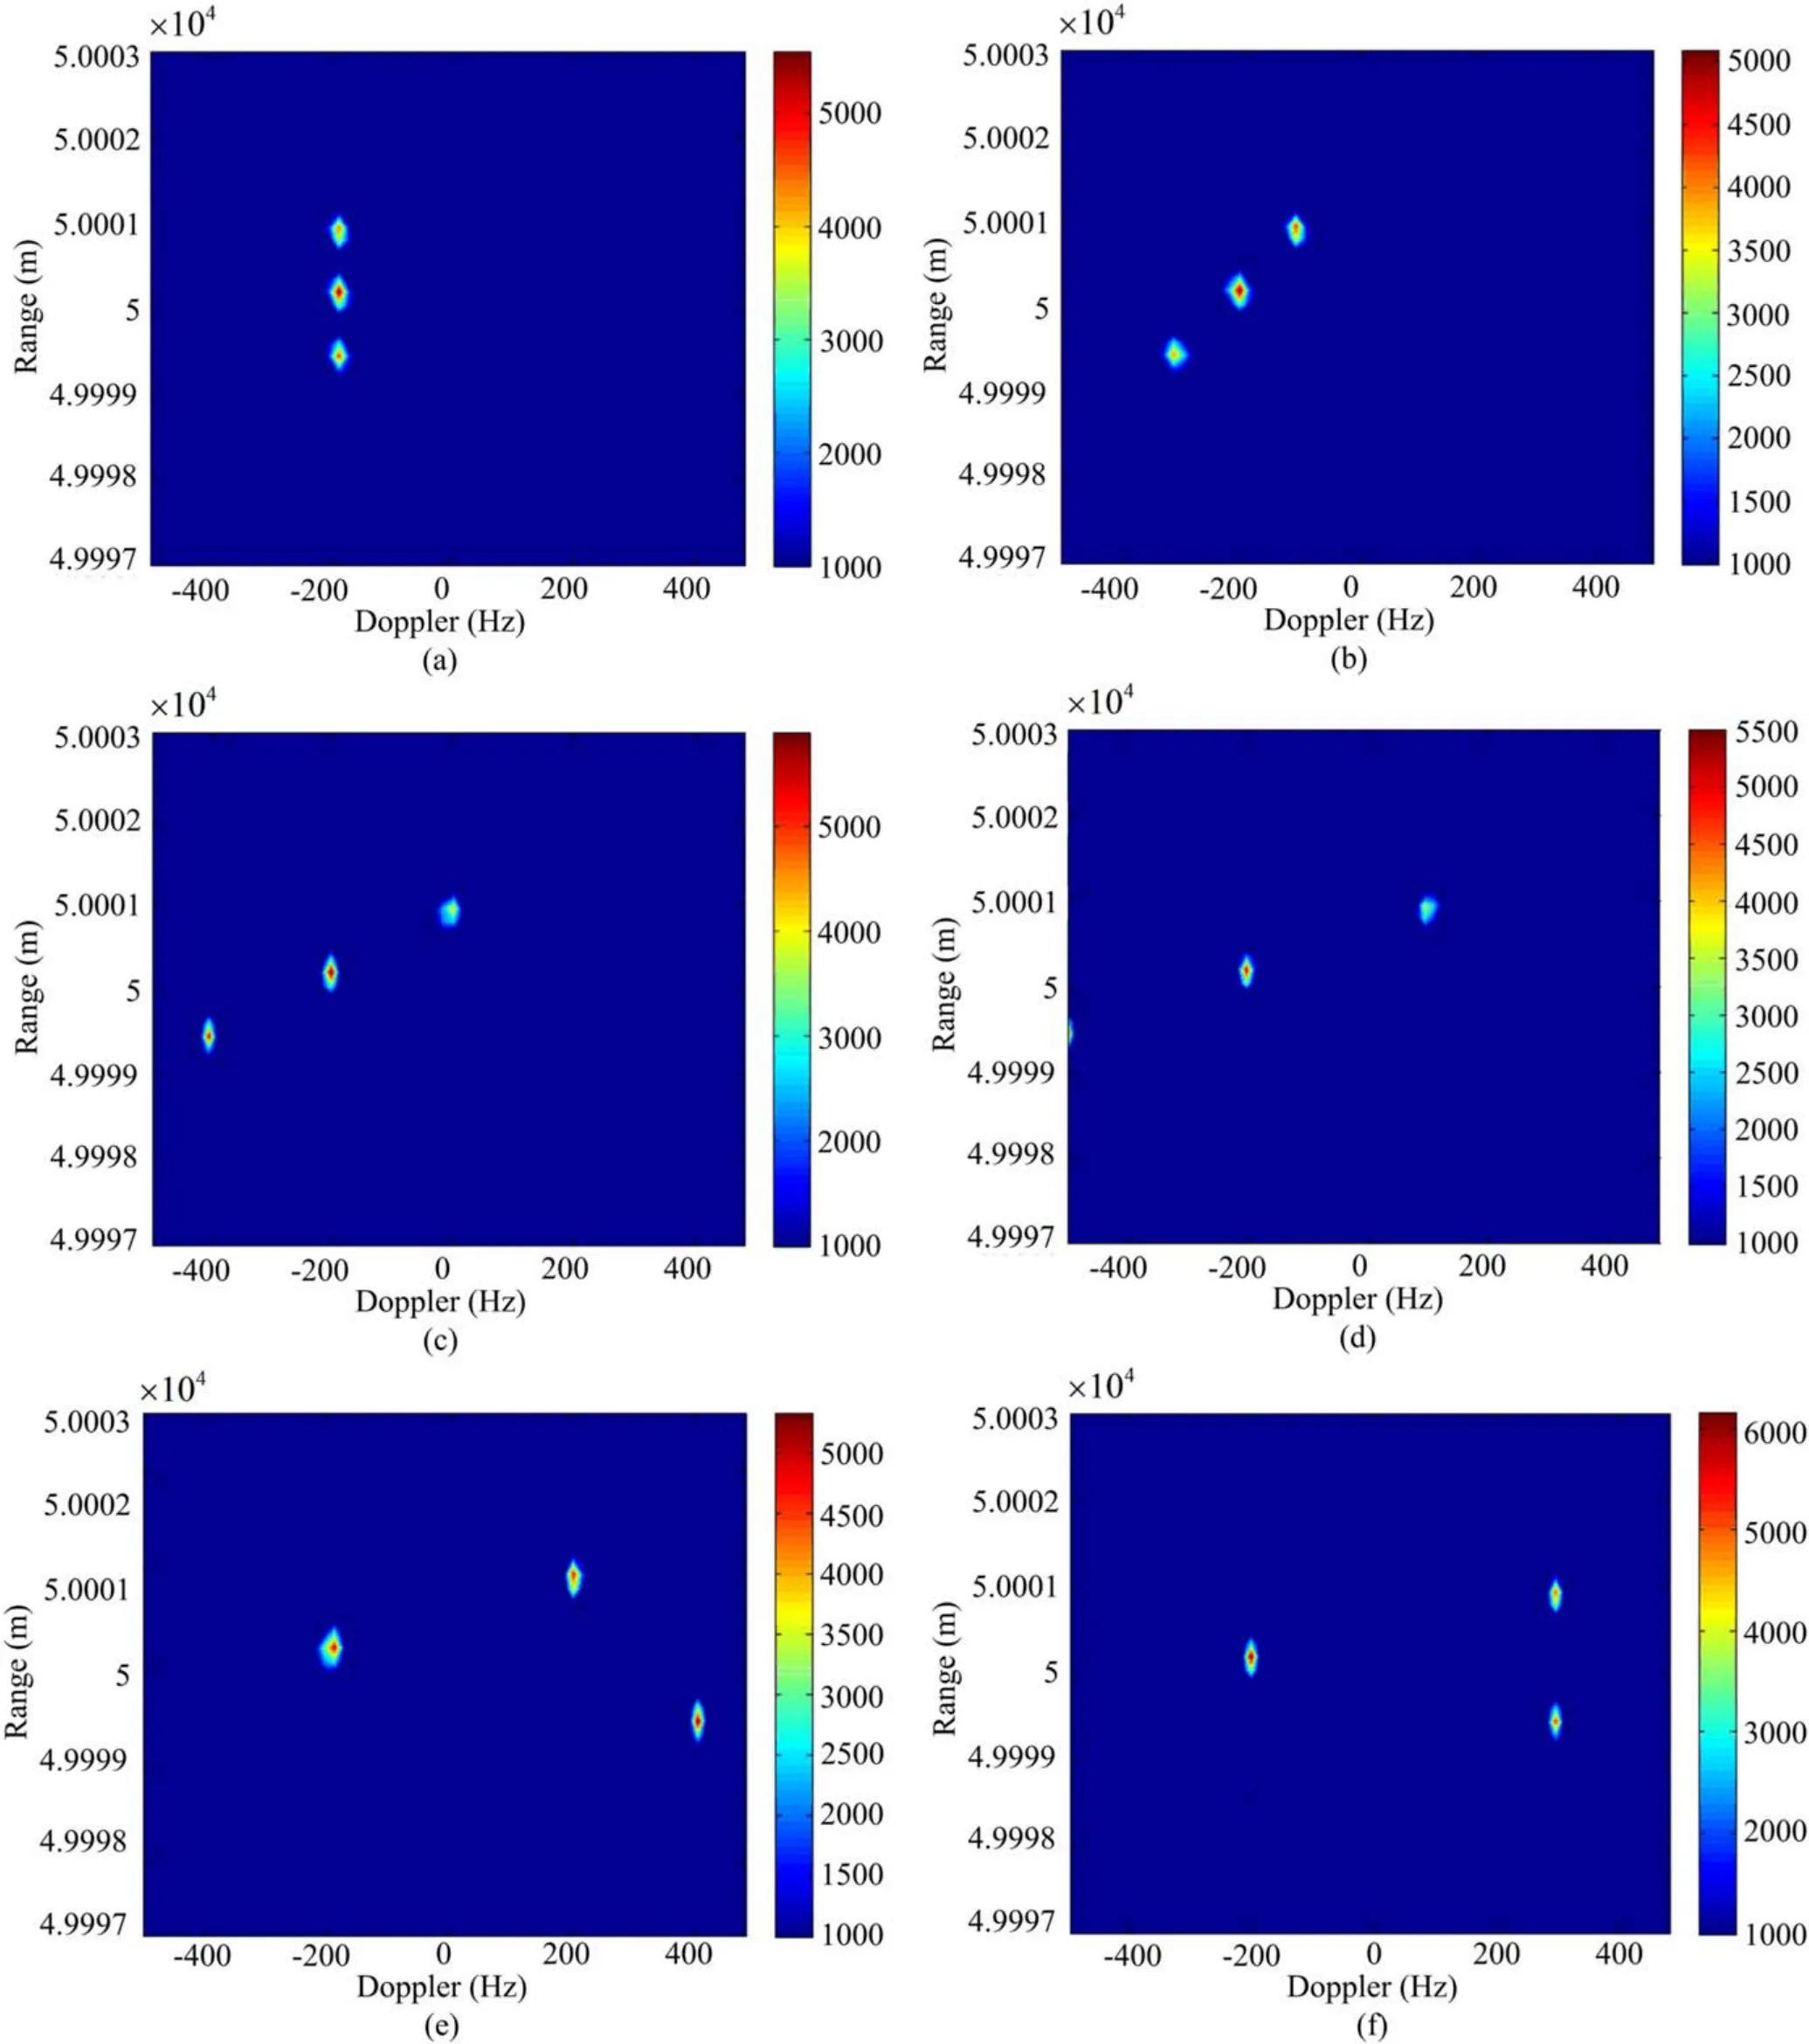
Figure 12.(a) ISAR image with time-varying plasma sheath when=50 kHz,(b) ISAR image with time-varying plasma sheath when=50.1 kHz,(c) ISAR image with time-varying plasma sheath when=50.2 kHz,(d) ISAR image with time-varying plasma sheath when=50.3 kHz,(e) ISAR image with time-varying plasma sheath when=50.4 kHz,(f) ISAR image with time-varying plasma sheath when=50.5 kHz.
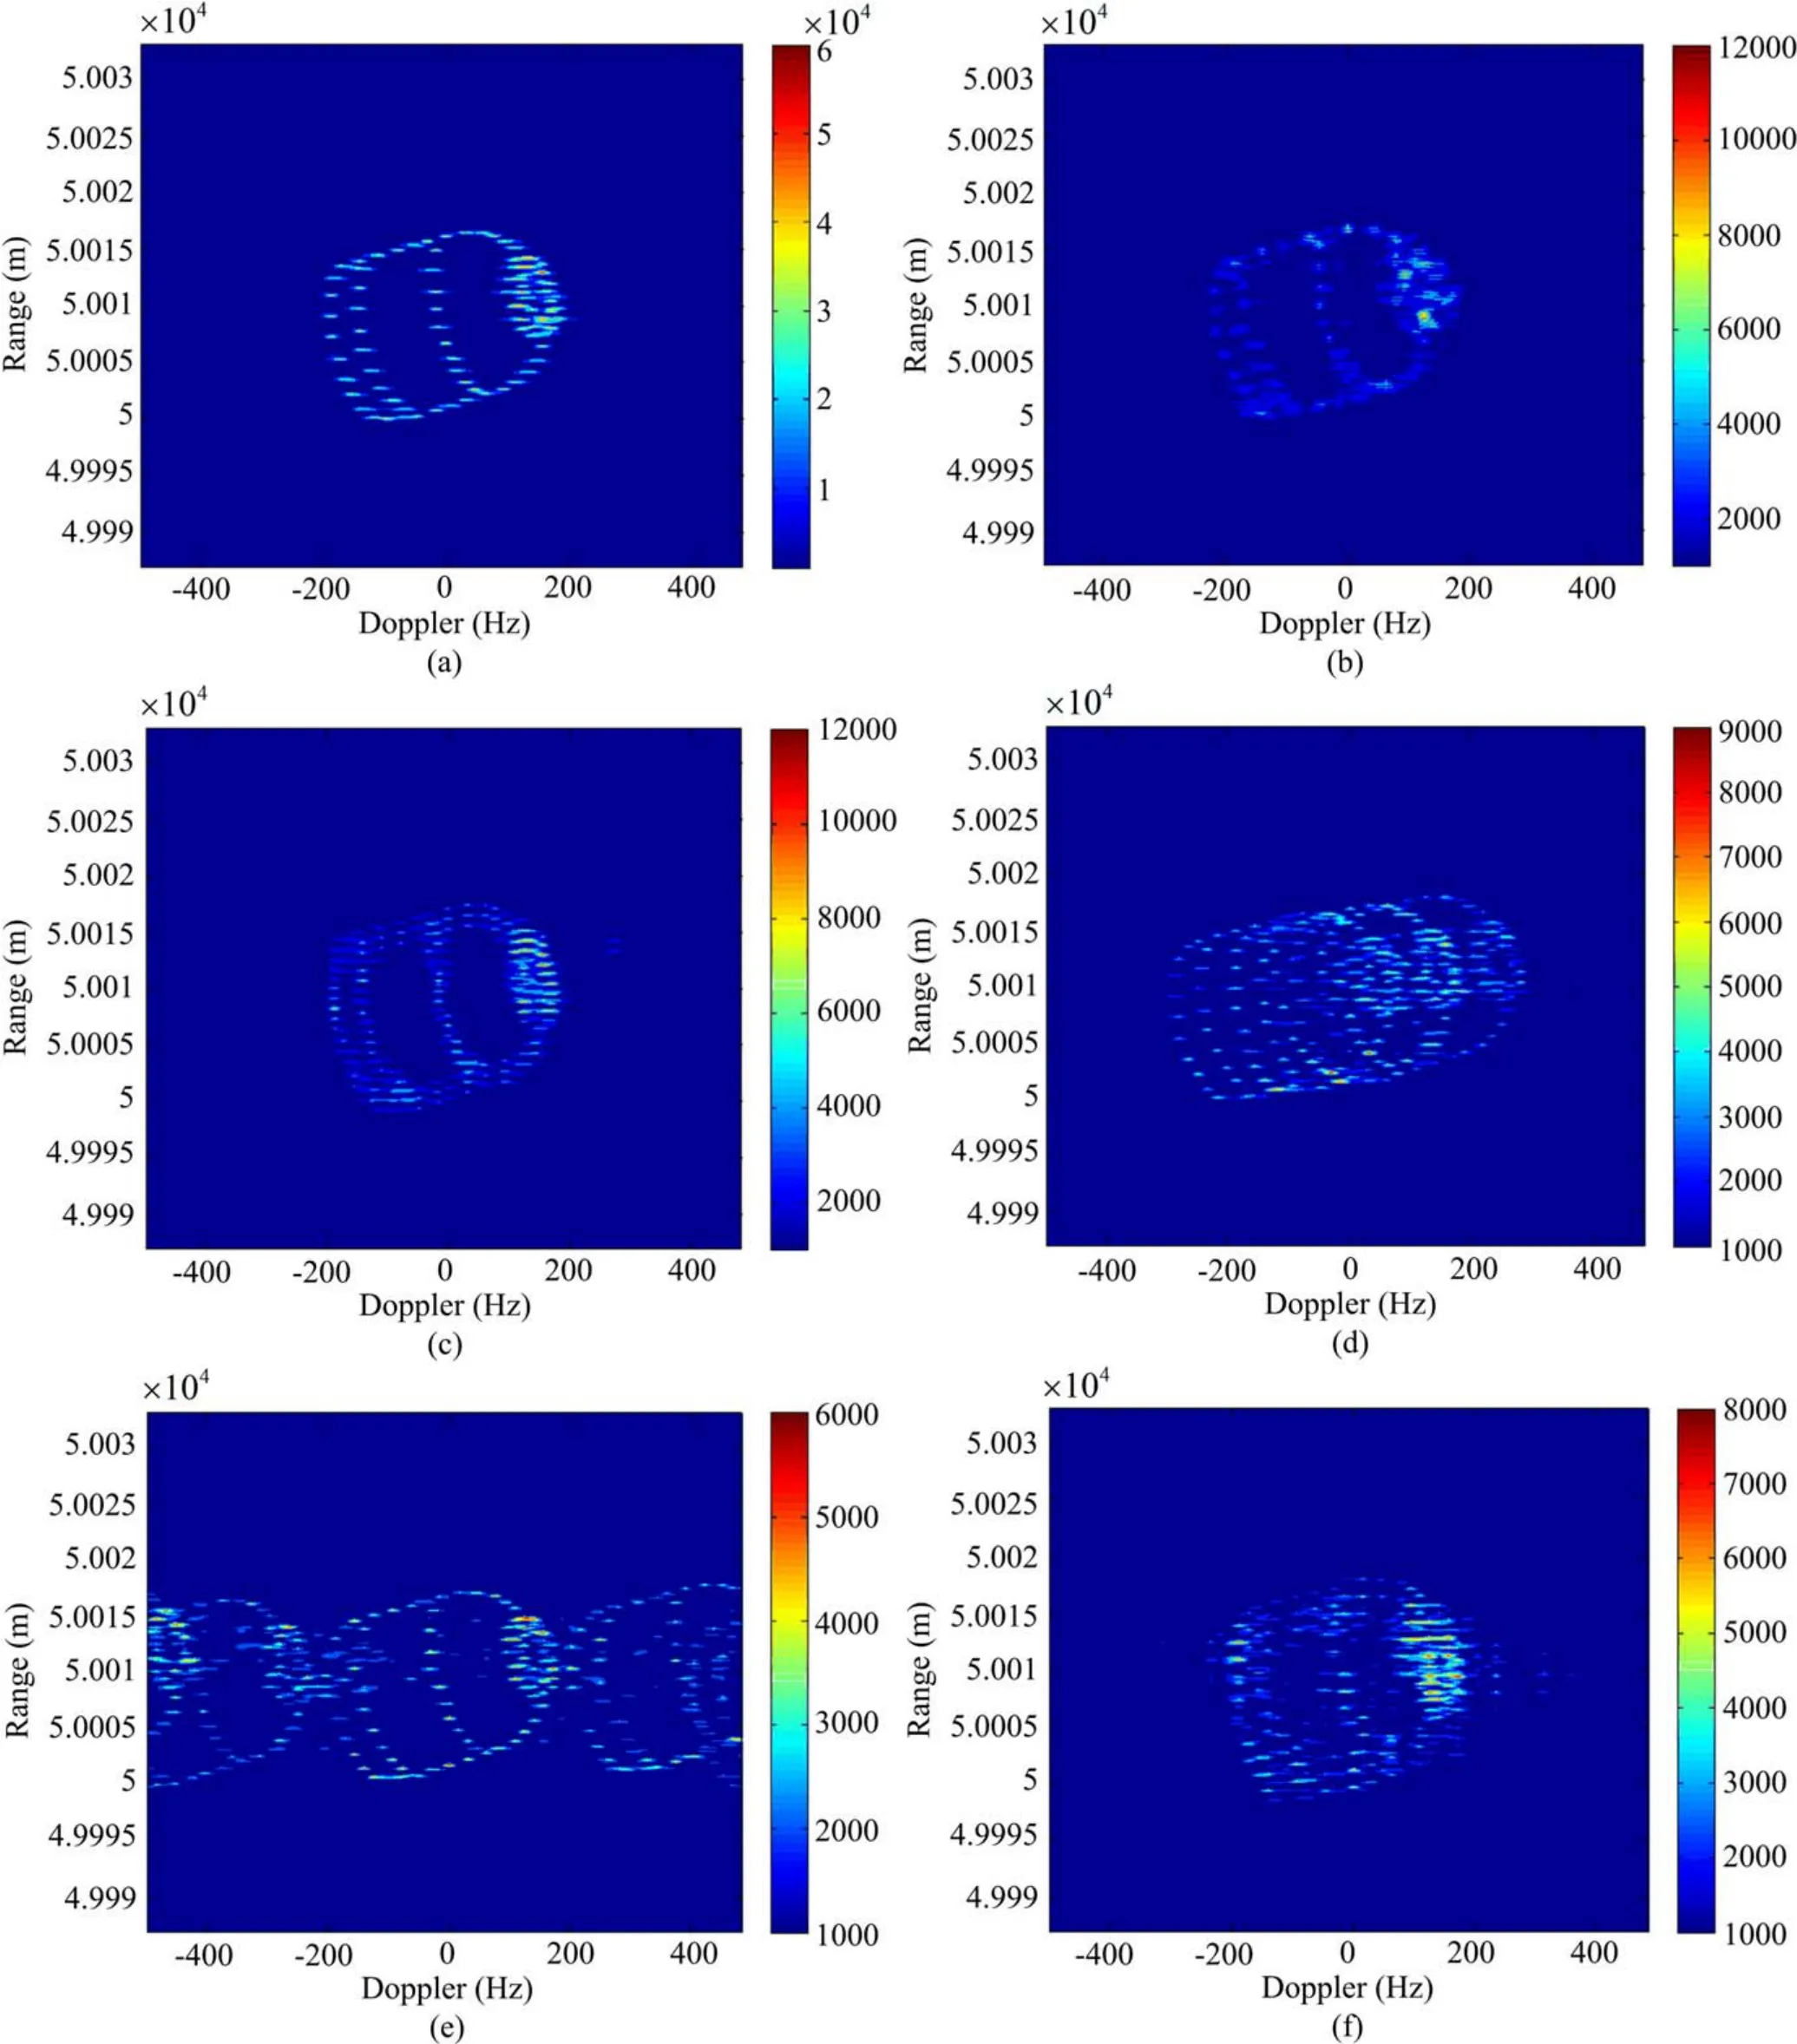
Figure 13.(a) ISAR image without plasma sheath, (b) ISAR image with time-varying plasma sheath when=20 kHz,(c) ISAR image with time-varying plasma sheath when=50 kHz,(d) ISAR image with time-varying plasma sheath when=50.1 kHz,(e) ISAR image with time-varying plasma sheath when=50.4 kHz,(f) ISAR image with time-varying plasma sheath when=100 kHz.
In order to evaluate the influence of false scatterings imposed on ISAR imaging,peak signal-to-noise ratio(PSNR)and structural similarity (SSIM) [30] were used to evaluate the results of ISAR imaging with plasma sheath.
PSNR is a common objective method being used to evaluate image quality.Supposing that the original image isP(u,v)and the noisy image isQ(u,v),then the mean square error (MSE) can be expressed as

where the two images have the same sizeU×V.
PSNR can be obtained using the following equation

whereMAX is the maximum pixel value of the image.A larger PSNR value implies less distortion and higher image quality.
SSIM is used to measure the similarity of two images.According to the realization of SSIM theory includes evaluation of brightness, contrast and structure.The expression can be obtained as

whereμPandμQare means of two images,σP2andσQ2are standard deviations,σPQis covariances ofP(u,v)andQ(u,v).h1andh2are stability constants.The value of SSIM ranges from 0 to 1.A larger SSIM value suggests higher similarity between original and noisy images.
The values of PSNR and SSIM jointly determine the level of image deterioration.The corresponding evaluation results are listed in table 4.It can be found thatfNeaffects the values of PSNR and SSIM whenfIP=0,suggesting thatfNeis negatively correlated with the values of PSNR and SSIM.WhenfIP≠0,fIPandfNejointly affect the values of PSNR and SSIM, which implies that the relation betweenfNeandfrimposes significant influence on the values of PSNR and SSIM.
7.Conclusions
With respect to reentry objects enveloped with time-varying plasma sheaths, this work analyzes the formation mechanism and the distribution rules of the ISAR imaging defocus.In this study, the TLM method is used to investigate the reflection coefficient of the plasma-sheath-enveloped object.Our research findings suggest that the coupling effect of echoes and reflection coefficient results in abnormal pulse compression results and the Doppler frequency diffusion,causing ISAR imaging defocus eventually.Furthermore, the corresponding analysis is conducted in terms of the range and azimuth dimensions.
In response to the range dimension, two false scatterings are caused by a single scattering of the object forms after pulse compression, distributing evenly on both sides of the real scattering.The real scattering is displaced from the actual position in distance and the absolute distance offset can be attributed to the phase-frequency characteristic of the reflection coefficient.The relative distance offset between the real scattering and either false scattering correlates with the electron density fluctuation frequency.
Regarding the azimuth dimension, the false scatterings have an additional Doppler frequencyfIPconfirmed by combined values of fNeand fr,in which one false scattering has Doppler frequencyfd+fIPwhereas the other one has Doppler frequencyfd-fIP.The distribution of the false scatterings on the azimuth dimension seriously impacts the ISAR images, thereby deteriorating the image quality.
Nevertheless,certain complicated changes in the electron density fluctuation frequencies and in the reentry object’s appearance were not fully considered.This paper investigates the formation mechanism of the false scatterings and the property of the ISAR imaging defocus of reentry objectsenveloped with time-varying plasma sheath.Our future research interest will be focusing on these changes and variations,laying a theoretical foundation for ISAR imaging and its applications in various fields.

Table 4.Evaluation results of the influence on ISAR image imposed by time-varying plasma sheath.
Acknowledgments
This work was supported in part by National Natural Science Foundation of China (Nos.61971330, 61701381, and 61627901), in part by the Natural Science Basic Research Plan in Shaanxi Province of China(No.2019JM-177),and in part by the Chinese Postdoctoral Science Foundation.
ORCID iDs
 Plasma Science and Technology2022年3期
- Plasma Science and Technology的其它文章
- A brief review: effects of resonant magnetic perturbation on classical and neoclassical tearing modes in tokamaks
- A classical relativistic hydrodynamical model for strong EM wave-spin plasma interaction
- Analysis of the influence of sheath positions,flight parameters and incident wave parameters on the wave propagation in plasma sheath
- Transmission characteristics of terahertz Bessel vortex beams through a multi-layered anisotropic magnetized plasma slab
- Measurement and analysis of species distribution in laser-induced ablation plasma of an aluminum–magnesium alloy
- Free-boundary plasma equilibria with toroidal plasma flows
