Numerical Simulations of a Florida Sea Breeze and Its Interactions with Associated Convection: Effects of Geophysical Representation and Model Resolution※
Nessa HOCK, Feimin ZHANG, and Zhaoxia PU
1Department of Atmospheric Sciences, University of Utah, Salt Lake City, Utah 84112, USA
2Air Force Institute of Technology, Wright-Patterson Air Force Base, Ohio 45433, USA
ABSTRACT The Florida peninsula in the USA has a frequent occurrence of sea breeze (SB) thunderstorms.In this study, the numerical simulation of a Florida SB and its associated convective initiation (CI) is simulated using the mesoscale community Weather Research and Forecasting (WRF) model in one-way nested domains at different horizontal resolutions.Results are compared with observations to examine the accuracy of model-simulated SB convection and factors that influence SB CI within the simulation.
Key words: sea breeze, convective initiation, lake breeze, numerical simulation
1.Introduction
A sea breeze (SB) is a local mesoscale circulation generated when a large temperature gradient between the warmer land surface and the colder ocean surface creates boundarylayer pressure differences, which in turn lead to a diurnal system of breezes that propagate inland (Abbs and Physick,1992).As an SB propagates inland, its frontal boundary will force the ascent of the continental air mass above the maritime air mass through low-level convergent forcing.If the ascending air reaches its level of free convection (LFC) and maintains sufficient buoyancy through significant upward displacement, shallow cumulus (cu) or deep convective initiation (CI) may occur (Miller et al., 2003; Trier, 2003).Thus, lengthy coastal areas, such as the Florida peninsula,have an almost daily occurrence of summertime SB thunderstorms, making them ideal locations to study SBs and their associated convection.Much progress has been made in understanding CI produced from SBs; however, this and other types of warm-season convection are still among the most difficult atmospheric events to predict as far as the exact timing, location, and intensity of storm cells (Clark et al., 2014; Lock and Houston, 2014).
The CI of Florida SBs has been investigated in numerous observational and numerical studies (e.g., Nicholls et al., 1991; Abbs and Physick, 1992; Boybeyi and Raman,1992; Fankhauser et al., 1995; Rao and Fuelberg, 2000;Miller et al., 2003; Etherton and Santos, 2008; Crosman and Horel, 2010).It has been shown that CI is produced along an SB’s convergent boundary, which occurs at discontinuous locations along the sea breeze front (SBF), rather than in an uninterrupted line.These locations of preferred CI have often been shown to occur where the SBF collides or merges with other boundary convergence lines such as thermally driven mesoscale breezes, including sea, lake,river, or land breezes (Blanchard and López, 1985; Boybeyi and Raman, 1992; Laird et al., 1995; Baker et al.,2001), gust front (GF) or outflow boundaries (Nicholls et al., 1991; Fankhauser et al., 1995; Rao and Fuelberg, 2000),or microscale horizontal convective roll (HCR) updrafts(Fankhauser et al., 1995; Rao and Fuelberg, 2000; Ogawa et al., 2003; Fovell, 2005).
Moreover, it has been found that CI can also occur ahead of or behind the SBF.Observations and numerical simulations by Nicholls et al.(1991) and Fankhauser et al.(1995) noted that CI could develop prior to the merger of two SBFs within an enhanced convergence zone formed as a natural consequence of declining surface heating and the inland progression of the two SBFs.In a high-resolution,three-dimensional numerical simulation conducted by Fovell (2005), an intersecting HCR’s moist updraft interacting with obstacle-generated gravity waves produced a convective roll cloud ahead of the SBF.More recently, Abulikemu et al.(2016) investigated CI prior to the merger of an SBF and gust front in North China and found that low-level convergence, conditional instability, and dynamic vertical forcing were the key ingredients for the CI produced between the two boundaries.Convection behind the stable SBF has been studied in high-resolution numerical simulations and was found to be produced from an outflow boundary intersecting a deep layer of upward motion that was enhanced and carried by microscale Kelvin–Helmholtz billows (KHBs) along the top of the SB gravity current (Rao and Fuelberg, 2000)or intersecting outflow boundaries modified and enhanced by SBF placement (Fankhauser et al., 1995).
From these studies, it is evident that mesoscale SBs and their associated convection are highly affected by locally driven boundaries and microscale features that change on a daily and even hourly basis, making forecasts of the exact timing, location, and intensity of convective systems difficult.Operational numerical weather prediction (NWP) models have long been used to bridge the gaps in forecasters’ ability to predict warm-season CI and aid in the generation of its forecast (Miller et al., 2003; Hahmann et al., 2006; Crosman and Horel, 2010).
Previously, numerical studies of Florida’s SBs and their associated convection have used simulations either in large mesoscale domains of several tens of kilometers or in much smaller large-eddy simulation (LES) domains of a hundred meters or less.Few studies have focused on prediction and simulation at the gray-zone scale (e.g., 1-km to 5-km horizontal resolution).Recently, numerical simulations at the gray-zone scale have been commonly used in operational mesoscale weather forecast systems.Research into the predictive performance of numerical models at different spatial resolutions at the gray-zone scale in simulating Florida SB and CI is of pressing importance in aiding future improvements to NWP forecasts in this region.In addition, increasing spatial resolution allows for the improved resolution of geographic features such as terrain height, coastline shape, lake dimensions, etc., which in turn affect geophysical properties such as instability, moisture, and lift that have been shown to be essential for CI (Lock and Houston, 2014).Although the systematic study by Schwartz and Sobash(2019) investigated 3- vs.1-km forecast performances over the entire CONUS, comprehensive systematic examinations on sea breeze applications have not been performed.In light of the above issues, this paper examines simulation performance for a Florida mesoscale SB and associated convection with different spatial resolutions at the gray-zone scale.Special attention is paid to verifying how the model resolves the timing, location, and intensity of the SB convection as well as the effects of changing geographic features(e.g., coastline shape, water body dimensions, etc.) with different spatial resolutions at the gray-zone scale on convective ingredients and the interactions between the SB and its associated convective characteristics.
The paper is organized as follows: section 2 briefly describes the real-data case used for the study, while section 3 briefly introduces the Weather Research and Forecasting (WRF) model configuration and setup used in the numerical simulation.Section 4 depicts the simulation results of the Florida SB CI.Section 5 discusses the response of geophysical change to different spatial resolutions at the grayzone scale and its influence on atmospheric ingredients and CI.Finally, a summary and conclusions are given in section 6.
2.A brief overview of the sea breeze case
SBs and associated convection developed along both the east and west coasts of the Florida peninsula on 6–7 September 2012.This case was characterized by SB convergence and convective development typified by a fast-moving west coast sea breeze (WCSB) and a slow-moving east coast sea breeze (ECSB).According to Blanchard and López (1985), this is a classic “Type 3” SB pattern, characterized by widespread rainfall amounts and SB convection that is sustained throughout the late evening hours.Figure 1 shows four soundings at 1200 UTC 6 September 2012 [hereafter all times are in UTC; UTC = EDT (Eastern Daylight Time) + 4 h] from four Florida stations: Tallahassee (TLH,Fig.1a), Jacksonville (JAX, Fig.1b), Tampa Bay (TBW,Fig.1c), and Miami (MFL, Fig.1d).These soundings represent the atmospheric conditions about an hour after sunrise,several hours before the SBs and their associated convection are initiated.All four soundings show convective inhibition (CIN) values of less than –25 J kg–1and convective available potential energy (CAPE) values ranging from almost 900 J kg–1(TLH, Fig.1a) to over 2500 J kg–1(MFL, Fig.1d).The level of free convection (LFC) of the four soundings is between 895 hPa and 850 hPa, while the lifting condensation level (LCL) of the four soundings ranges between 970 hPa and 950 hPa.Precipitable water (PW) values for the soundings are around 48 mm, except for JAX (Fig.1b),which is slightly less than the other soundings, at 42 mm.Consequently, the soundings across the peninsula show a warm,moist, and unstable atmosphere favorable for the SB convection event, given that the weak subsidence and associated CIN over the peninsula could be overcome in the afternoon through convective heating and lifting effects.

Fig.1.Observed soundings for four Florida stations: (a) Tallahassee (TLH), (b) Jacksonville (JAX), (c) Tampa Bay(TPA), and (d) Miami (MIA) at 1200 UTC 6 September 2012.Images courtesy of University of Wyoming[http://weather.uwyo.edu/upperair/sounding.html].Locations of sounding stations can be found in Fig.3a.
A day before this event (5 September 2012), SB convection occurred during the afternoon and extended into the evening hours (not shown).However, by 0600 UTC 6 September 2012, the sky over Florida was mostly clear and remained cloud free for the rest of the morning, allowing for plenty of solar insolation to occur over the peninsula.Both the WCSB and ECSB developed between 1320 and 1400 UTC 6 September 2012, while convection began along the WCSB at 1400 UTC (Fig.2a) and along the ECSB at 1500 UTC (Fig.2b) 6 September 2012, respectively.The enhanced WCSB and its associated convection traveled significantly inland, while the ECSB and convection remained adjacent to the east coast for most of this period (Fig.2c); consequently, the two SBs collided just inland from the eastern coast of Florida at approximately 2030 UTC 6 September 2012 (Fig.2d), producing a strong squall line of enhanced deep convection.The deep convection produced by the colliding SBs was oriented in a north-to-south line along Interstate 95 from Jacksonville (JAX) to Vero Beach (VRB),while the convection to the south was oriented in a northeast-to-southwest line across the peninsula from VRB to just inland and north of Naples (APF).Shortly following the production of this squall line at 2100 UTC 6 September 2012, there were several reports of −27 m s−1winds along the southeast coast of Florida.The last remnants of SB convective precipitation ended at 0500 UTC 7 September 2012 in east-central portions of the Florida peninsula (not shown).

Fig.2.Geostationary Operational Environmental Satellite-East (GOES-E) visible satellite images of convective cloud cover over the Florida peninsula at (a) 1401 UTC, (b) 1515 UTC, (c) 2001 UTC, and (d) 2031 UTC 6 September 2012.Red lines show the location of the WCSB and ECSB fronts.Yellow line in panel (d) indicates formation of the squall line due to the collision of the SBFs.Images courtesy of College of DuPage[http://www.cod.edu/] and Carl Jones [https://northflwx.wordpress.com/2012/10/01/florida-coast-to-coast-seabreeze-convergence/].
3.Simulation and data description
The numerical simulations of SB convection presented in this paper were performed using the Advanced Research WRF (WRF-ARW) model (version 3.7.1, Skamarock et al.,2008).A four-level, one-way nested domain configuration centered over the Florida peninsula is employed for the simulation.The outermost, two middle, and innermost horizontal domain grids consist of grid spacings of 27 km (d01),9 km (d02), 3 km (d03), and 1 km (d04), respectively (not shown).Note that the spatial resolutions of d03 and d04 are both at the gray-zone scale.The outermost domain (d01) and d02 were chosen to cover the southeastern US and the surrounding Atlantic Ocean in order to capture dynamics that might influence the SB and convection.The innermost domain covers the Florida peninsula and its surrounding local waters (see areas covered by d03 and d04 in Figs.3a and 3b).
All four domains contain 62 vertical eta levels with 26 levels in the lower atmospheric region (below 850 hPa).The model top is set at 5 hPa.The physics options used in this study include the Unified Noah land surface model(LSM, Chen and Dudhia, 2001), Mellor-Yamada-Janjić(MYJ, Mellor and Yamada, 1974) PBL, New Thompson microphysics (Thompson et al., 2008), New Kain-Fritsch(KF, Kain, 2004) cumulus (d01 and d02 only), MM5 Dudhia shortwave radiation (Dudhia, 1989), and Rapid Radiative Transfer Model (RRTM) longwave radiation (Iacono et al., 2008).Table 1 gives a full list of the configurations used for each of the four domains.Different configurations of physical parameterization impact the onset, intensity, and merging of the SBFs.The selection of the physical parameterization options was based on sensitivity experiments with various physical schemes in the early phase of this study (not shown).
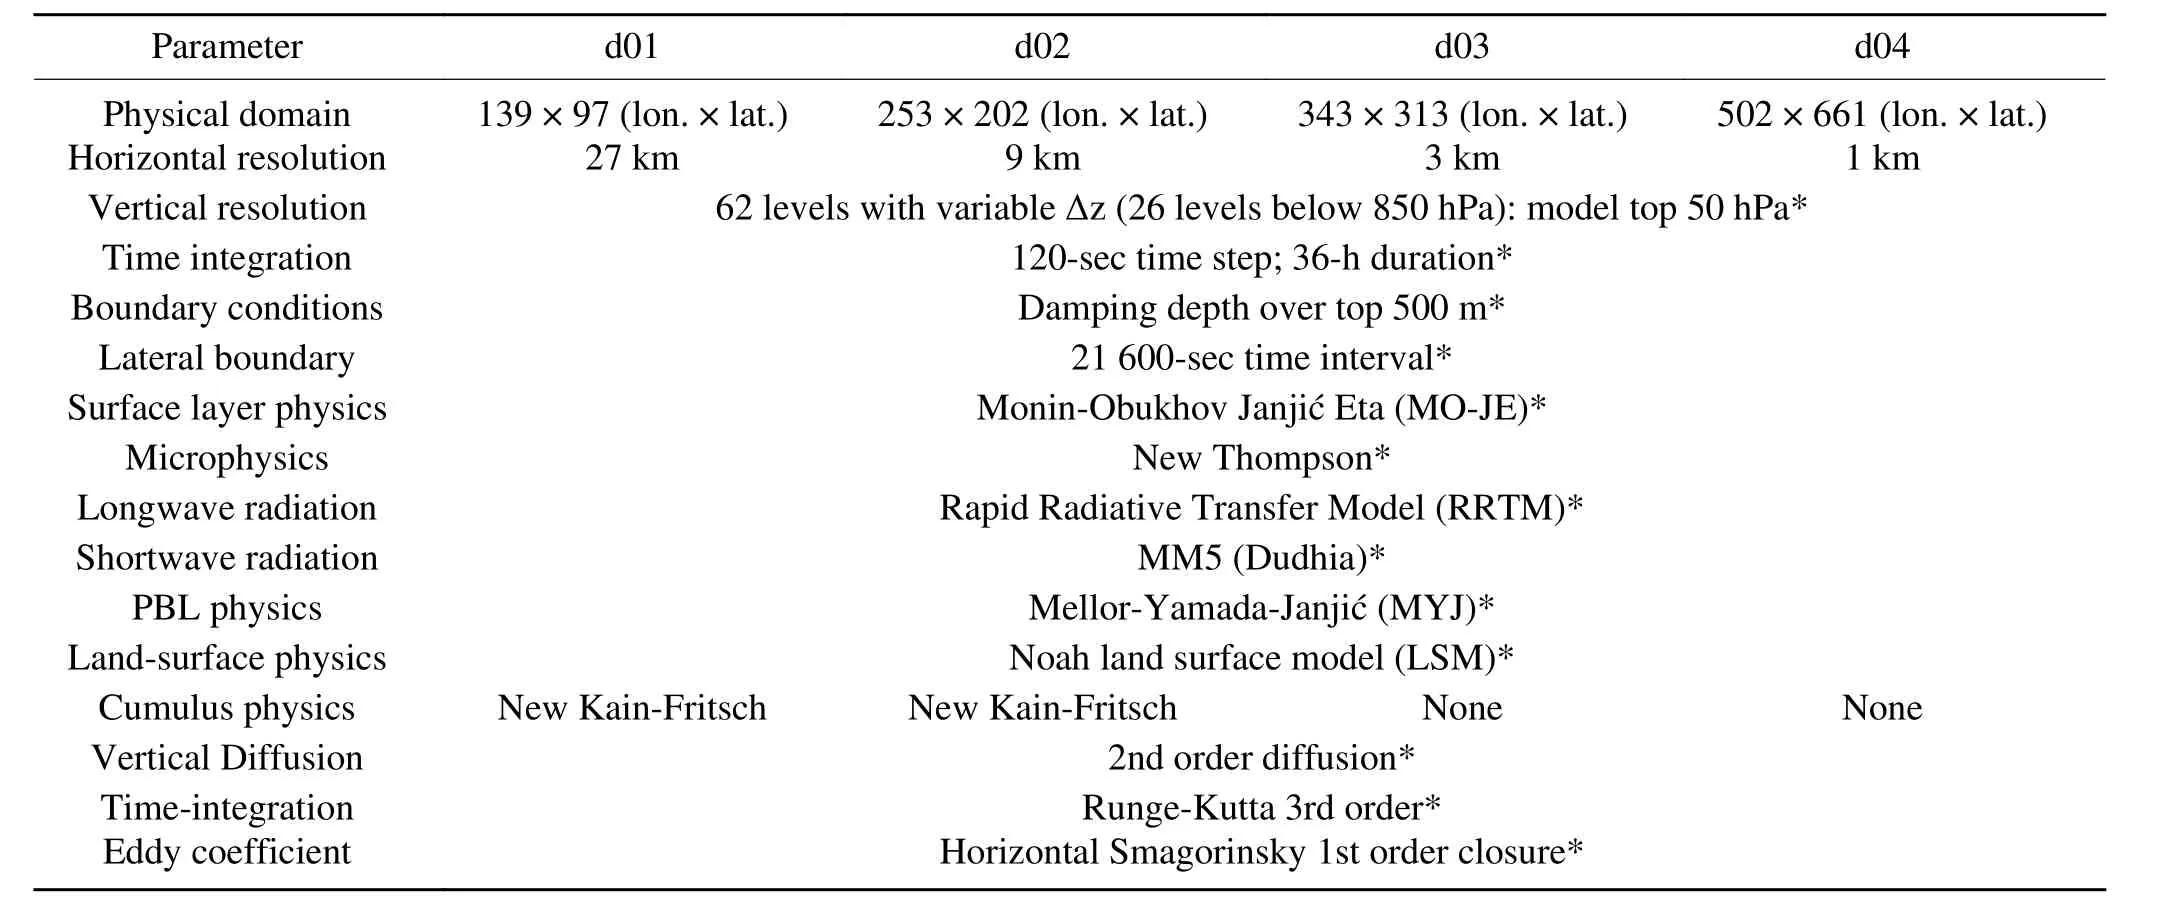
Table 1.WRF model parameter settings for domains d01, d02, d03, and d04.

Fig.3.Terrain heights and water body locations for (a) d03 and (b) d04.Red lines indicate the locations of the vertical cross sections cut west-to-east through MacDill, Air Force Base (MCF, northernmost) and Lake Okeechobee (OBE,southernmost).The colored boxes indicate locations used later in the study for a zoomed-in analysis.The locations of the 23 observing stations used to aid in the verification of the WRF simulation are also plotted.Note the increased number of lakes in (b) compared to (a).Water body names and locations are annotated in panel (c).The left corner inset of panel (c) is a zoomed-in area over Tampa Bay.(d) Locations of WRF model domains for all four-level nested domains.
The model initial and boundary conditions are provided by the NCEP North American Mesoscale (NAM) Forecast System analysis at 12-km grid spacing from 0000 UTC 6 September 2012 to 1200 UTC 7 September 2012 at six-hour intervals.After initialization, the model was integrated into a one-way nested mode for 36 hours until 1200 UTC 7 September 2012.The simulated SB events are verified using surface parameters obtained from local aviation routine weather reports (METARs) and aviation special weather reports (SPECIs) from 23 locations across the peninsula.A detailed comparison of the simulated results is made with NCEP’s Stage IV precipitation analysis (Lin and Mitchell, 2005) and the Climatology-Calibrated Precipitation Analysis (CCPA) (Hou et al., 2014).Furthermore,NCEP’s 32-km horizontal grid spacing/45-level vertical resolution North American Regional Reanalysis (NARR;Mesinger et al., 2006) is also used to verify the WRF simulation output.
4.Simulation results
The SB and its associated convection were examined on a five-minute basis for the WRF simulation.As both the d03 and d04 grid scales were very similar in their ability (spatially and temporally) to resolve the SB, only the results from d03 are shown in this section.It is noteworthy that the higher resolution of d04 did allow the SBF to more closely follow the coastline shape upon initiation and produced a more intense and narrower SBF, which will be discussed in later sections.
4.1.Sea breezes
Figure 4 shows the initiation and evolution of the WRF-simulated ECSB and WCSB as seen by the zonal surface winds and total wind vectors.Specifically, the WRF-simulated SB is initiated between 1405 and 1435 UTC 6 September 2012 on both sides of the peninsula (Figs.4a and 4b), as seen in the turning of the coastal winds, which is in line with the SB initiation time in the surface observations and NARR data.By 1500 UTC, both SBs are well established(Fig.4c) and continue to strengthen and propagate through the afternoon.Due to the opposing low-level synoptic flow,the ECSB is quite discernible in the simulation, while the WCSB that is parallel to the synoptic flow becomes much harder to discern in the analysis (Fig.4d).Simulated surface temperature also indicates that coastal areas are warmer than the nearby ocean before the SB, which leads to surface pressure decreases over land and then the land breeze turning into an SB (not shown).
Figure 5 shows a temporal evolution of the zonal wind cross sections, indicating the inland progression and height of the ECSB and WCSB during the afternoon.Initially, the simulated WCSB extends higher (700 m) than the ECSB(400 m, Fig.5a).However, by 1700 UTC 6 September 2012, the ECSB has reached 700 m at its frontal head, while the WCSB extends 900 m (Fig.5b).The two SBFs reach a maximum height of around 1 km by 1930 UTC (Fig.5c).The two SBs gradually approach each other (Fig.5d) and eventually meet inland of the eastern coast of Florida at 2120 UTC 6 September 2012, which is 50 minutes after the SB frontal merger in surface observations.
4.2.Convective systems
Figures 6a and 6b compare the WRF-simulated accumulated precipitation to CCPA data from 1200 UTC 6 September 2012 to 0600 UTC 7 September 2012 (18-h accumulated precipitation in total) for domains d03 and d04.Both of the WRF simulation domains and the CCPA analysis observe relatively sparse areal coverage of rainfall along the west coast and in northern Florida, while distinct patterns of rainfall are observed along the east coast and in central Florida.In addition, an obvious lack of rainfall occurs northeast of Lake Okeechobee in both the CCPA analysis and the WRF simulations, although the “rain shadow” is more pronounced in d03 (Fig.6a) than in d04.Meanwhile, light rainfall occurs across the north-central and northeast portions of the Florida peninsula in the d04 simulation (Fig.6b), while the d03 grid scale shows almost no precipitation in those areas (Fig.6a).
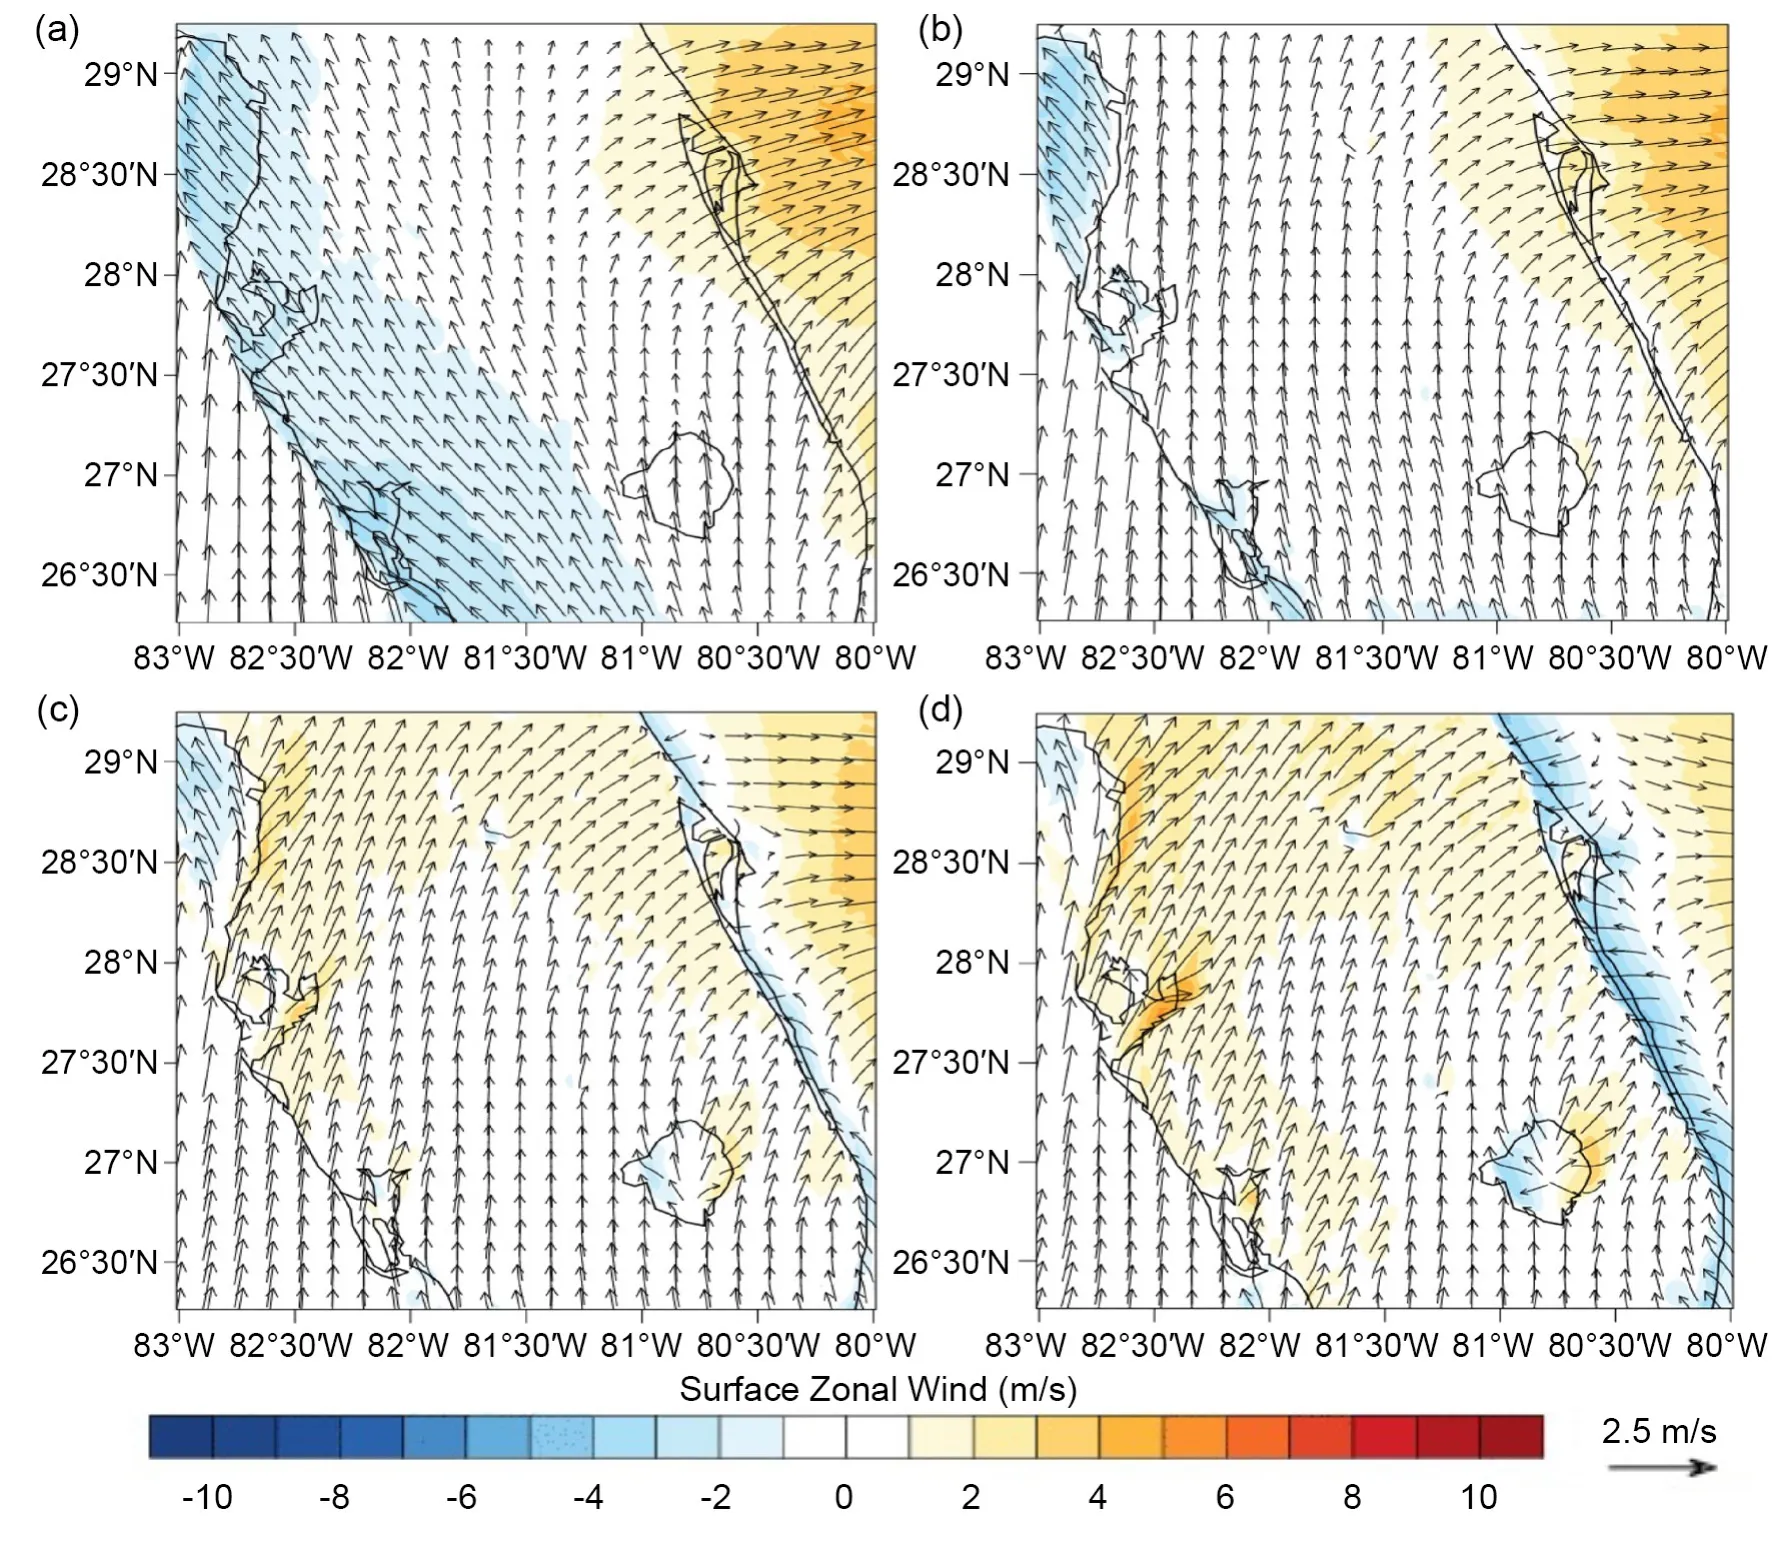
Fig.4.WRF-simulated zonal (u-component) winds (color: red easterly, blue westerly; units: m s–1) and total wind(black arrows; unit reference vector 2.5 m s–1) at surface level for a zoomed-in region of d03 (yellow box in Fig.3a)at: (a) 1300 UTC, (b) 1400 UTC, (c) 1500 UTC, and (d) 1600 UTC 6 September 2012.
Figure 7 further compares the hourly WRF precipitation accumulations for d03 and d04 with hourly Stage IV data.Simulated timing of the initial convection along the west coast of Florida at 1400 UTC 6 September 2012 for an inland location just northeast of Waccasassa Bay (see Fig.3c for the location of the bay) in d03 and d04 (Figs.7a and 7b) is concurrent with observations; however, d03 fails to resolve the convection produced east of Waccasassa Bay, contrary to the Stage IV analysis.In contrast, the higher resolution d04 is able to capture the convection east of Waccasassa Bay (Fig.7b) but also overestimates the WCSB convection just north of Naples (APF in Figs.3a and 3b).At this time, there are also small convective cells not associated with the SBF in the central portion of the peninsula in d04(Fig.7d) that are not present in d03 (Fig.7c).By 1800 UTC 6 September 2012, d04 resolves the convection along the east coast of Florida, while d03 has only a small convective cell in the southeast corner of the peninsula associated with the ECSB (Figs.7c and 7d).It is not until 1900 UTC 6 September 2012 that d03 begins to resolve significant convection along the ECSB.
The WRF-simulated SBFs collide and merge at 2030 UTC 6 September 2012 and produce an enhanced convective squall line that is clearly visible at 2100 UTC 6 September 2012, which is markedly similar to the Stage IV analysis convective pattern (Figs.7e and 7f).However, from 2230 UTC 6 September 2012 until 0200 UTC 7 September 2012, the orientation of the convection in the d03 WRF simulation becomes north-to-south, while the Stage IV analysis data clearly show the convective line in southern Florida maintaining a northeast-to-southwest orientation (Fig.7g).The convection produced in d04 better captures this northeast-to-southwest convective orientation (Fig.7h).Finally,the duration of the convection across the Florida peninsula in the d03 simulation lasts until 0530 UTC 7 September 2012, rather than 0500 UTC 7 September 2012 as seen in Stage IV and CCPA analyses, or 0400 UTC as seen in the d04 simulation (not shown).A comparison of 18-h accumulated precipitation (1200 UTC 6 September 2012 to 0600 UTC 7 September 2012) between the d03 and d04 WRF simulations (Figs.6c and 6d) and the CCPA analysis (Figs.6a and 6b) shows that despite good spatial coverage of the WRF-simulated convective precipitation, the maximum precipitation accumulations produced by the WRF simulation cover much smaller spatial areas than what is observed in the CCPA analysis.

Fig.5.Cross section (through northernmost red line in Fig.3a) of d03 WRF-simulated zonal (u-component) winds(color: red easterly, blue westerly; units: m s–1) and total horizontal wind (black arrows represent horizontal winds at each height level along longitude, reference vector 10 m s–1; upward arrows mean north direction) at: (a) 1600 UTC,(b) 1700 UTC, (c) 1930 UTC, and (d) 2030 UTC 6 September 2012.Red contour lines indicate the zero-wind contour heights, which are indicative of approximate SBF heights.
4.3.Quantitative precipitation forecasting (QPF)
To further examine the intensity differences between the two spatial resolutions at the gray-zone scale, a quantitative precipitation forecasting (QPF) analysis was conducted using the Equitable Threat Score (ETS), also known as the Critical Success Index (CSI), and Bias Score (BS) calculations.The values used to calculate these scores are given in a 2 × 2 contingency table (Table 2).Four specific precipitation thresholds are used in the QPF statistics calculations:2.54 mm, 6.35 mm, 12.7 mm, and 25.4 mm.Knowing information about the forecast area (F), observed area (O), and the correctly forecasted “hits” (H), the CSI seeks to answer the question of how well the forecasted “hits” correspond to the observed “hits”.The BS seeks to answer the question of how similar the frequencies of forecasted and observed“hits” are.The BS is mathematically defined as:
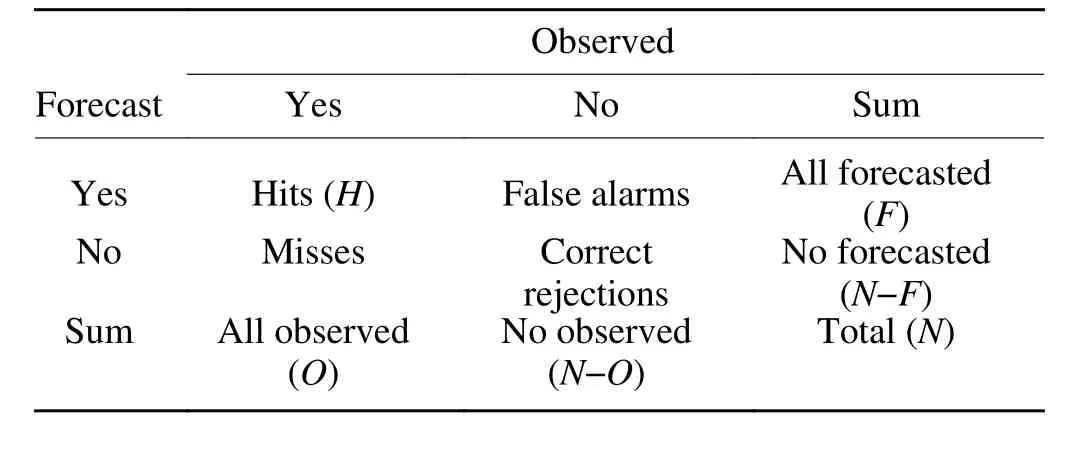
Table 2.Contingency table illustrating the counts used in verification statistics of dichotomous (e.g., Yes/No) forecasts and observations.

The ETS score can be obtained using the following equation:

For a given threshold, A represents the number of grid points that exceed the threshold in both the model forecast and the CCPA data; B denotes the number of grid points that exceed the threshold in the model forecast, but not in the CCPA data; and C is the number of grid points that do not reach the threshold in the model forecast, but that exceed the threshold in the CCPA analysis.

Fig.6.18-h rainfall accumulation totals from 1200 UTC 6 September 2012 to 0600 UTC 7 September 2012 for (a)d03 WRF-simulated precipitation accumulation totals (blue contours; units: mm) and CCPA data (color; units: mm).Panel (b) is the same as (a) but for d04.WRF-simulated precipitation accumulation totals (color; units: mm) for (c)d03 and (d) d04 for the same times as (a) and (b).
ETS values range from 0 to 1, with 0 indicating no skill in the forecast.BS values range from 0 to infinity, with a bias of less than 1 indicating a tendency to underforecast,while a bias greater than 1 indicates a tendency to overforecast in the forecast system.The ETS and BS values for the d03 and d04 simulation results are given in Table 3.As seen by the relatively low ETS values in both domains for all four precipitation thresholds, the simulations are relatively poor at forecasting the correct intensities for the SB event,and the BS shows that the simulations underforecast the precipitation intensity events.d04 performs slightly better than d03 at nearly all precipitation thresholds.

Table 3.Equitable Threat and Bias Score values for four rainfall thresholds over an 18-h forecast period (1200 UTC 6 September 2012 to 0600 UTC 7 September 2012).
Thus, it is evident that the WRF simulation is able to capture the overall spatial locations and timing of the convective mesoscale systems (MCSs) that occurred during the 6–7 September 2012 SB event reasonably well.However, the intensities of the WRF-simulated convective precipitation are overall much weaker as compared to the CCPA and Stage IV analyses in subjective and QPF evaluations.It is also found that increasing spatial resolution at the gray-zone scale has impacts on convection activities: namely, increasing the spatial resolution at the gray-zone scale can reasonably reproduce and capture the timing of the CI, as well as the orientation of the convection after the SBF merger into the squall line over the peninsula, although it degrades the simulation of the size and organization of convective cells.
The spatial resolution of the gray-zone scale commonly ranges from 1 km to 5 km; therefore, different spatial resolutions mean different geophysical features, which in turn affect atmospheric features.In order to further understand the geophysical features at different spatial resolutions and their impacts on the simulation of spatial, timing,and intensity of MCSs and precipitation, additional analysis of the atmospheric and convective features resolved at these two grid scales (d03 and d04 domains) is performed in the next section.
5.Influences of geographical features and model resolution
5.1.Convection over coastlines and bays
A significant difference in the ability of the two grids(d03 and d04) to resolve the observed convective precipitation occurs east of Waccasassa Bay at 1600 UTC 6 September 2012.D03 is unable to resolve this convection, while d04 is able to produce convection in this area.At 1500 UTC 6 September 2012, the WCSB is initiated in both gray-zone domains, as seen in u wind and total wind vectors.d04’s higher-resolution grid scale allows the WCSB to be initiated more closely along the coastline shape and with slightly stronger winds, leading to areas of enhanced convergence (Figs.8b and 8d) that are absent in d03 (Figs.8a and 8c).This narrow band of convergence produced by the SBF in d04 leads to the CI seen east of Waccasassa Bay (Fig.8d),which is absent in d03.Simulation results also show that over the ocean surface, west of the Florida peninsula, the structures of the divergence field are similar to the less organized open boundary layer convective cells.At the same time, over the ocean surface, east of the Florida peninsula,the structures of the divergence field are similar to well-organized boundary layer horizontal convective rolls.These results agree with those discussed in Xue and Martin (2006a,b) and can be further addressed in future work.
In addition, the flow of the winds through the Y-shaped Tampa Bay area (see inset in Fig.3c) to the south at this same time also shows significant enhancement in d04 due to its better resolution of the bay’s coastline.The marine air flowing through Tampa Bay is deflected to the northwest and northeast around the Interbay Peninsula into Old Tampa Bay and Hillsboro Bay, respectively, due to the SB flow.This produces strong convergent flow from the SB along the Pinellas and Interbay Peninsulas.The Tampa Bay breeze and WCSB create a narrow band of enhanced surface convergence, which aids in lifting air to its LFC and initiating convection at this time, as seen in the bright red reflectivity contours just north of the Pinellas Peninsula at 1500 UTC 6 September 2012 (Fig.8d).
5.2.Lake effects
In addition to the bay breezes and coastlines affecting the CI in the gray-zone simulations, lake breezes (LBs) also play an important role in CI.LBs, like SBs, are frequent in the summertime when the cooler lakes create a pressure gradient effect that generates a lake-to-land flow of air.Lakes are known to significantly impact convection during summer by producing “rain shadows” on the downwind side of the lake(Segal et al., 1997).This occurs when the synoptic wind blows over the cooler lake surface and the air is cooled and moistened, generating subsidence and the suppression of the convective boundary layer, leading to more stable conditions as the wind begins to flow back over land (Segal et al.,1997).It has long been established that Lake Okeechobee,Florida’s largest lake at 1825 km2, affects convection in terms of LB and rain shadow effects, in both observations and numerical experiments (e.g., Blanchard and López,1985; Boybeyi and Raman, 1992; Segal et al., 1997).As previously mentioned in section 3b, the Lake Okeechobee “rain shadow” is also seen in observations on 6 September 2012,as well as in the gray-zone WRF simulations (Figs.6a and 6b), suppressing convection directly downwind of the lake.In addition, both grid spacings resolve many of the smaller Florida lakes, not merely Lake Okeechobee.Little research has been done on how the smaller Florida water bodies affect the SB, with the exception of studies done on the smaller water bodies surrounding Cape Canaveral (e.g., Laird,1995; Rao and Fuelberg, 2000).In both gray-zone WRF simulations, midsized lakes (lakes between 30 km2and 200 km2),the St.Johns River, and the Indian River are all resolved and effectively produce lake/river breezes.Small lakes (i.e.,lakes between 10 km2and 30 km2) are not resolved in d03,but the higher resolution d04 is able to resolve these lakes and produce associated LBs (see Fig.9).Very small lakes(less than 10 km2) are not resolved at either gray-zone grid scale.?

Fig.7.Stage IV precipitation accumulation (color; units: mm) and d03 (left column) and d04 (right column) WRFsimulated precipitation accumulation (black contours; units: mm) at: (a–b) 1400 UTC, (c–d) 1800 UTC, (e–f) 2100 UTC, and (g–h) 2300 UTC 6 September 2012.The red arrows in (e) and (f) indicate squall lines.
The midsized lakes (30–200 km2) in d03 and the small lakes (10–30 km2) in d04 both produce LBs of similar strength.The depths of the LBs produced by these smaller lakes are on the scale of 150–350 m.Figure 10 shows a cross section through the center of the peninsula at 1600 UTC 6 September 2012.The d04 WRF-simulated WCSB and ECSB frontal heads (indicated by blue arrows) show depths of ~600 m to 750 m, while in comparison, the LBs(indicated by red arrows) show depths from ~250 m for Lake Weohyakapka (30 km2) and Lake Marian (23 km2), to~375 m for the southern tip of Lake Kissimmee (140 km2).

Fig.8.WRF-simulated divergence (color: red convergence, blue divergence; units: s–1) and total wind (black arrows;reference vector 2.5 m s–1) at surface level for a zoomed-in region of d03 (yellow box in Fig.3a) at: (a) 1500 UTC and (c) 1530 UTC 6 September 2012.Panels (b) and (d) are the same as a) and (c) respectively, but for the zoomedin region of d04 (yellow box in Fig.3b) and include max reflectivity (red contours; units: dBZ).
In both WRF gray-zone simulations, the LBs produced by the midsized and small lakes in d03 and d04 are important areas for CI.LBs produce convergent boundary areas on the windward side of the lake that extend in an elongated semicircle around the sides of the lake (due to interactions with the opposing synoptic flow).In the WRF simulations,these convergent frontal areas produced by the LB interacting with the synoptic winds intersect with other boundary areas, such as SBs or other LBs, producing CI.A clear example of this is seen in the interactions of the ECSB,Lake George, Crescent Lake, and Lake Apopka at the d03 grid scale (Fig.11).At 1825 UTC 6 September 2012, a strong area of convergence from Lake George and Crescent Lake perpendicularly intersects the ECSB, producing a convective cell (Cell 1 in Fig.11).Twenty minutes later, at 1845 UTC, the convergence area between Lake George and Crescent Lake generates a convective cell (Cell 4 in Fig.18),while just fifteen minutes later, the Crescent Lake breeze again intersects the ECSB (north of the lake), producing a convective cell at 1900 UTC (Cell 5 in Fig.11).A final area of CI due to the LB–ECSB collision in the example occurs at 1910 UTC 6 September 2012 due to the convergent area produced by Lake Apopka (Cell 7 in Fig.11).
In addition to convection produced by the LBs intersecting with other boundary areas, the interaction of the LBs with synoptic winds also leads to CI.Figure 11f shows this interaction.As the LB produced by Lake Apopka interacts with synoptic winds, the convergence area surrounding the lake becomes more and more elongated downstream of the lake in narrow bands.As these convergent bands narrow, vertical velocities also increase, causing CI to occur on the synoptic-wind parallel sides of the lake (Cell 8 in Fig.11f).Because the higher resolution of d04 is able to resolve more of the smaller Florida lakes, the d04 simulation shows more numerous convergent LB boundary areas, leading to more convective cells being initiated along these LB convergence lines (as seen in Fig.7c) in central Florida, compared to the d03 simulation (Fig.8d).
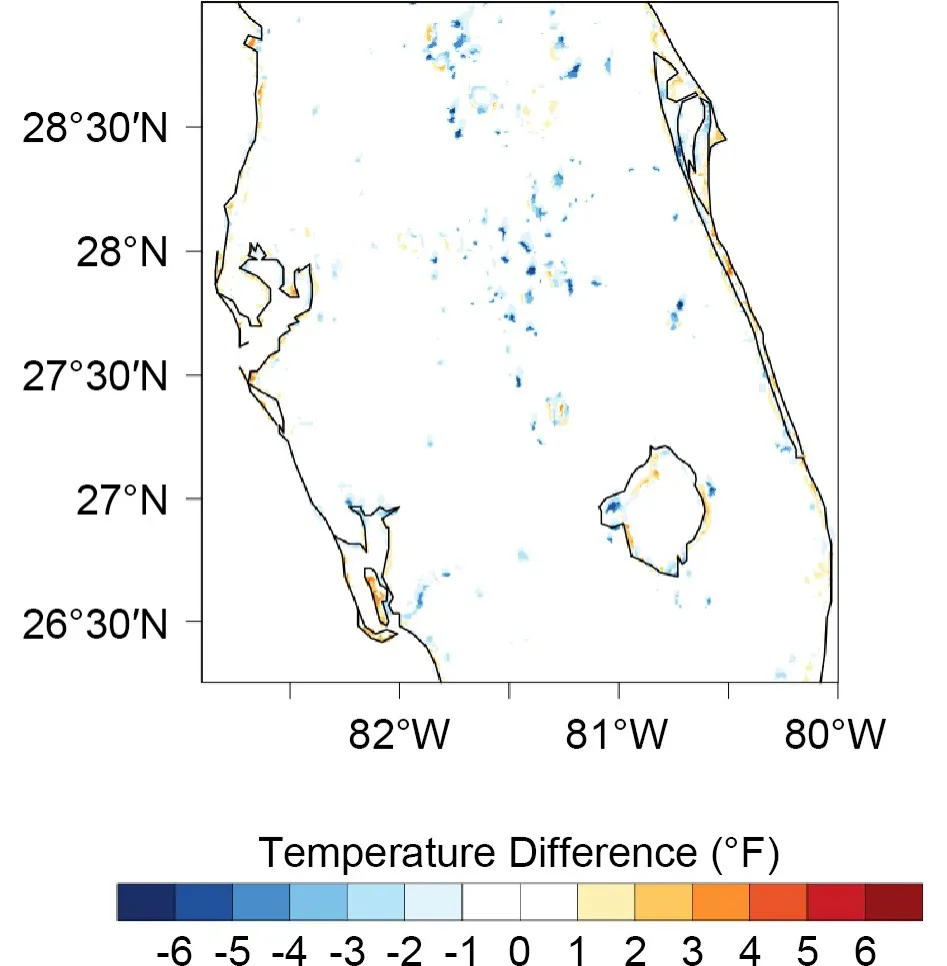
Fig.9.Temperature difference [color contours; units: oF , oF =(oC × 9/5) + 32] between the d03 and d04 WRF simulations at 0330 UTC 6 September 2012 for a zoomed-in region of d03 and d04 (yellow boxes in Figs.3a and 3b).
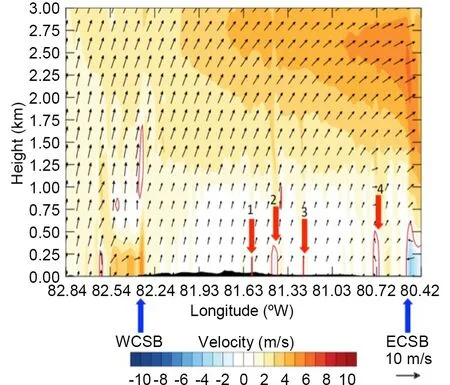
Fig.10.Cross section (through southernmost red line in Fig.3b) of d04 WRF-simulated zonal (u-component) winds (color:red easterly, blue westerly; units: m s–1) and total horizontal wind (black arrows represent horizontal winds at each height level along longitude, reference vector 10 m s–1; upward arrows mean north direction) at 1600 UTC 6 September 2012.Red contour line indicates the zero-wind contour heights,which indicate Lake Okeechobee’s approximate lake breeze heights.Blue arrows indicate the locations of the SBs, while the red arrows indicate the lake breezes for 1) Lake Weohyakapka, 2) Lake Kissimmee, 3) Lake Marian, and 4)Indian River.
5.3.Post-squall line convection
Besides differences in the ability of gray-zone grids to resolve the convection between the SBFs, postfrontal squall line convection is also quite different between the two simulations.In both high-resolution simulations of the innermost domains, the observed squall line produced by colliding SBs at 2130 UTC 6 September 2012 is captured reasonably well in terms of timing and spatial location (Figs.8e and 8f).However, following the generation of this squall line from the colliding SBs (until 0100 UTC 7 September 2012),the convective system’s orientation in d03 evolves quite differently from the orientation of the observed convective system and d04 simulation results (Figs.8g and 8h).CCPA and Stage IV analyses show that the observed post-squall line convective system tends to have a northeast–southwest orientation, while the d03 simulation creates a distinct north–south band of convective cells instead.
The discrepancies in the post-squall line convective orientation are due to differences in the strength of the squall lines produced in the two gray-zone simulations.Figure 12 shows the zonal winds of d03 and d04, just after the SBF merger and generation of the squall line convection.It is evident that the SBF and associated convective cells produced by the d04 output are much stronger than those produced by the d03 output along the squall line.An hour later, at 2200 UTC 6 September 2012, the northern half of the d04 squall line continues to propagate eastward (Fig.12d), while the weaker squall line in d03 remains essentially motionless in the east-central portion of the peninsula (Fig.12c).By 2300 UTC 6 September 2012, the d03 post-squall line convection is still in the central portion of the peninsula (Fig.12e),while the d04 post-squall line convection system has propagated eastward to Florida’s eastern coast (Fig.12f).
D04’s stronger SBF is induced in part by the higher-resolution grid’s ability to resolve a slightly higher (1°C–2°C)land-surface temperature (not shown), that is, at 1230 UTC 6 September 2012, the d04 simulation begins to show higher surface temperatures (1°C–3°C over the d03 surface temperatures) along the southern tip of Florida.By 1400 UTC 6 September 2012, d04’s higher surface temperature has extended along the western coast of Florida, and to Florida’s east coast by 1700 UTC 6 September 2012.As the atmosphere above the land and large bodies of water is sensitive to the specified temperature (Knievel et al., 2010), even this small temperature difference is enough to produce a stronger land–ocean temperature gradient in d04.
A larger land–ocean surface temperature gradient (as seen in the d04 simulation) will lead to increased low-level flow within the SBF and increased low-level convergence at the SBF (for offshore flow).This difference in low-level convergence between the d03 and d04 resolutions can also be clearly seen in the WRF-simulated divergence fields (Fig.8).The d03 ECSB band of frontal convergence (Figs.8a and 8c) is much broader than the d04 ECSB band of frontal convergence (Figs.8b and 8d), showing a much weaker d03 ECSB kinematic front (location of the SBF’s maximum near-surface wind convergence; Miller et al., 2003).Based on the wind field (Fig.12) and divergence field (Fig.8), it is clear that d04’s enhancement of the SBFs, as compared to d03, also leads to increased vertical velocities at the SBF,leading to stronger CI and updrafts along the front as well.When the two simulated SBFs merge into the squall line between 2030 UTC and 2130 UTC 6 September 2012, the stronger SBF and convective cells in d04 aid the propagation of the convection system eastward, rather than it stagnat-ing the MCS in the central peninsula as seen in the d03 simulation of the post-squall line convection.It should be noted that the simulated discrepancies of the divergence fields(Fig.8) correspond well with the differences in the resolved and unresolved lake distribution between d04 and d03, suggesting that the refined geophysical features by the grid resolution resulting from increasing spatial resolution are important for the simulation of Florida SB and CI.
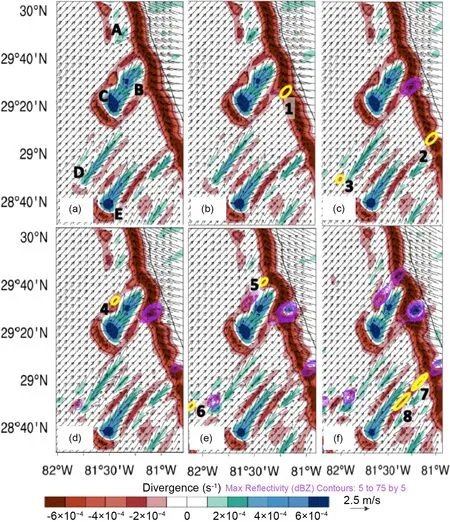
Fig.11.D03 WRF-simulated divergence (color: red convergence, blue divergence; units: s–1) at surface level, max reflectivity (yellow and purple contours; units: 5 dBZ), and total wind (black arrows; reference vector 2.5 m s–1) at surface level for a zoomed-in region of d03 (purple box in Fig.3a) at: (a) 1820 UTC, (b)1825 UTC, (c) 1840 UTC, (d) 1845 UTC, (e) 1900 UTC, and (f) 1910 UTC 6 September 2012.Yellow reflectivity contour lines indicate the convective cell’s first appearance in the simulation and are numbered accordingly in panels (b–f); thereafter, the reflectivity contour lines are purple.Panel (a) indicates the lake effect divergence from the following water bodies: A—St John’s River, B—Crescent Lake, C—Lake George, D—Lakes Griffin, Harris, and Eustis, E—Lake Apopka.See text for more details.

Fig.12.WRF-simulated zonal (u-component) winds (color: red easterly, blue westerly; units: m s–1) and total wind (black arrows; reference vector 2.5 m s–1) at surface level for a zoomed-in region of d03 (yellow box in Fig.3a) at (a) 2100 UTC, (c) 2200 UTC, and (e) 2300 UTC 6 September 2012.Panels (b), (d), and (f) are the same as (a), (c), and (e) respectively, but for the zoomed-in region of d04 (yellow box in Fig.3b).The black circles denote the locations of squall lines.
6.Summary and concluding remarks
This study simulated an enhanced WCSB, or “Type 3”SB convective event (Blanchard and López, 1985), that occurred 6–7 September 2012 using the WRF model at the gray-zone grid scale with two nested inner-domain grids of 3 km and 1 km, respectively.Results indicate that the WRF model can properly simulate SBs and associated convection.Although the two spatial resolutions are both at the gray-zone scale, they have different impacts on the Florida SB and CI.In other words, the simulation improvements of d03 are manifested mainly in the organization of the convective system, while the simulation improvements of d04 are manifested mainly in the timing and location of CI along the WCSB.
The numerical results were further investigated to see how geophysical features respond to different spatial resolutions at the gray-zone scale and how they impact convection.Results indicate that more accurately resolving geophysical features such as bays, coastlines, and small lakes(10–30 km2) by the high-resolution grids has significant impacts on the location and timing of CI along SBFs.Compared with the 3-km grid scale, the 1-km gray-zone grid scale enables better resolution (i.e., more grid points for better representation) of the Florida coastline and the smaller Florida lakes (10–30 km2), which leads to increased areas of atmospheric low-level convergence, and in turn, to stronger SBFs and LBs.The enhanced SB and LB fronts are key locations for CI; they are clearly seen in d04 but not seen in the coarser WRF grid domains (d03).In addition, the refined geophysical features in d04 also produce stronger SBFs, leading to a more intense squall line being produced following the SBF mergers.This stronger squall-line convection in d04 is key in determining more accurate postfrontal locations of the convective systems as compared to the d03 grid scale.In summary, improving the representation of geophysical features such as bays, coastlines, and small lakes(10–30 km2) leads to enhancements of low-level convergence and surface sensible heating, which are key ingredients to strengthening SBFs and aiding CI.
The results of this study show that CI due to the Florida SB is sensitive to geophysical features that are closely related to the grid resolution of numerical models at the gray-zone scale.As this study presents one convective SB case, additional case studies are still needed, especially for simulations of Type 1 and Type 2 SB cases (Blanchard and López, 1985).In addition, an ensemble of simulations with various parameterizations or perturbed initial conditions as well as data assimilation could be useful areas for analysis and forecasts of SB convection in the future work.
Acknowledgements.The first author gratefully acknowledges the support of the US Air Force Institute of Technology(AFIT) program during her graduate study.The views expressed in this article are those of the stated authors and do not reflect the official policy or position of the US Air Force, Department of Defense, or the US government.
Computing resources for the simulations were provided by the Center for High-Performance Computing (CHPC) at the University of Utah.Stage IV precipitation data were provided by the NCAR/Earth Observing Laboratory (EOL) at its website http://data.eol.ucar.edu/.CCPA precipitation data were provided by the NCEP/Environmental Modeling Center (EMC) at its website http://www.emc.ncep.noaa.gov.NCEP reanalysis data were provided by the National Oceanic and Atmospheric Administration (NOAA)/Oceanic and Atmospheric Research (OAR)/Earth System Research Laboratory (ESRL) Physical Science Division(PSD) from its website, http://www.esrl.noaa.gov/psd/.ERAInterim reanalysis data were provided by ECMWF from its website, http://apps.ecmwf.int/.
 Advances in Atmospheric Sciences2022年5期
- Advances in Atmospheric Sciences的其它文章
- Contributions of Fuqing ZHANG to Predictability, Data Assimilation,and Dynamics of High Impact Weather: A Tribute※
- The Impact of Moist Physics on the Sensitive Area Identification for Heavy Rainfall Associated Weather Systems※
- Correlation Structures between Satellite All-Sky Infrared Brightness Temperatures and the Atmospheric State at Storm Scales※
- Improving the Analyses and Forecasts of a Tropical Squall Line Using Upper Tropospheric Infrared Satellite Observations※
- A Survey of Statistical Relationships between Tropical Cyclone Genesis and Convectively Coupled Equatorial Rossby Waves※
- Initiation and Evolution of Long-Lived Eastward-Propagating Mesoscale Convective Systems over the Second-Step Terrain along Yangtze-Huaihe River Valley※
