基于无人机多光谱影像的土壤盐分反演模型
赵文举,马芳芳,马 宏,周 春
基于无人机多光谱影像的土壤盐分反演模型
赵文举,马芳芳,马 宏,周 春
(兰州理工大学能源与动力工程学院,兰州 730050)
为探究不同作物覆盖下不同深度的土壤盐分快速反演模型,该研究采集苜蓿、玉米覆盖下0~15、>15~30、>30~50 cm层深度的土壤盐分含量,基于无人机多光谱影像数据,提取各地块采样点的光谱反射率,在此基础上引入红边波段计算光谱指数作为特征变量,采用支持向量机递归特征消除算法(Support Vector Machine-Recursive Feature Elimination,SVM-RFE)以筛选光谱指数及未经过筛选的全指数组作为模型输入组,共构建出36个基于随机森林(Random Forest,RF)、极限学习机(Extreme Learning Machine,ELM)、BP神经网络(Back Propagation Neural Network)等机器学习模型,确定不同作物覆盖下的最佳土壤盐分反演模型。结果表明:SVM-RFE算法筛选光谱指数构建模型精度优于未进行筛选构建的模型。对于苜蓿和玉米覆盖土壤,整体上,RF反演效果优于ELM模型和BPNN模型,反演结果能体现真实土壤盐分含量,在0~15和>30~50 cm土层上,RF模型反演效果优于其他模型,苜蓿样地验证集决定系数p2分别为0.71、0.58,验证集均方根误差RMSEp分别为0.026、0.033,玉米样地p2分别为0.67、0.64,RMSEp分别为0.111、0.094,在>15~30 cm土层上ELM反演效果较好,苜蓿样地p2为0.58,RMSEp为0.039,玉米样地p2为0.68,RMSEp为0.059。0~15 cm是作物覆盖下的土壤含盐量最佳反演深度,验证集平均决定系数2为0.65,均方根误差RMSE为0.084。研究结果可为土壤盐分的快速反演提供理论依据。
无人机;土壤;盐分;多光谱;SVM-RFE;反演模型
0 引 言
土壤盐碱化严重影响作物根系吸水能力和土壤结构,造成了大面积耕地退化和作物减产[1],据统计中国盐碱土面积约3 600万hm2,分布广泛,其中耕地占26.6%[2],严重威胁中国1.2亿hm2耕地红线,盐碱地治理迫在眉睫。如何高效地获取土壤盐分信息是盐碱地治理的关键。传统方法获取土地盐碱化分布及变化规律精度高但费时费力、易受地形限制[3],低空遥感为土壤盐碱化反演提供科学、高效的技术手段。无人机搭载光谱仪器可快速获取地面大范围光谱信息,许多学者使用无人机搭载高光谱、多光谱等仪器,实现了土壤墒情监测和作物生长监测[4-5]。此外,红边波段可很好地反映绿色植被生长状况,与表征植被长势的重要参数间有较好的相关性[6-7]。
敏感光谱变量作为反演模型最重要的输入数据,其选择方法一直是该研究领域的研究热点。使用合适的变量选择方法不仅可以提高模型预测精度[8],还可加快机器学习速率,孔钰如等[9]采用连续投影算法、最佳指数法以及逐波段组合法分别进行无人机高光谱数据最佳波段筛选,结合支持向量回归、偏最小二乘回归和随机森林回归模型对冬小麦叶片LAI进行估算。Zhao等[10]使用相关系数法选取相关性高的光谱指数构建不同植被覆盖表层土壤含盐量反演模型,所构建模型等较好地反映真实土壤盐分含量。杨宁等[11]通过ENET(Elastic Net)变量选择算法构建不同深度土壤含盐量反演模型,结果显示ENET可以有效筛选出最优光谱变量,且使用该方法建立的变量组构建模型精度相较于未使用变量选择方法构建的反演模型精度有了明显提高。近年来,支持向量机递归特征消除(Support Vector Machine-Recursive Feature Elimination,SVM-RFE)逐步被用于遥感领域,张睿等[12]通过对比在高光谱数据分类中SVM-RFE和OneR、Info Gain、Relief F 3种特征选择方法对其精度影响,发现SVM-RFE选择特征较优。甄佳宁等[13]使用SVM-RFE算法选取了光谱波段及光谱指数组成的最优变量组合,从而建立基于Sentinel-2影像的红树林冠层氮含量反演模型。在特征数目较少的情况下,SVM-RFE法可有效去除冗余特征,但将SVM-RFE结合机器学习算法构建作物物候期不同深度土壤盐分反演模型的相关研究较少。
为此,本文基于无人机搭载多光谱成像系统获取作物物候期遥感影像并对苜蓿和玉米覆盖下不同深度土壤层盐分含量进行同时段野外实测,通过引入红边波段构建出与实测土壤含盐量相关性较高的光谱指数组,采用SVM-RFE算法对光谱指数进行筛选,将筛选前的全指数组和筛选后新指数组作为模型输入层,构建基于随机森林(Random Forest,RF)、极限学习机(Extreme Learning Machine,ELM)、反向神经网络(Back Propagation Neural Networks,BPNN)机器学习算法的盐分反演模型,通过对所建36个反演模型的反演效果评估,以讨赖河灌区边湾农场为例,确定出灌区不同作物覆盖下适宜的土壤盐分反演模型,以期为快速反演土壤盐分提供理论依据。
1 材料与方法
1.1 研究区概况
边湾农场位于酒泉市肃州区,隶属于讨赖河灌区,农场气候干旱,降雨稀少,蒸发量大,海拔约1 390 m,农场总面积约15.6 km2,其中耕地面积占34.7%,是讨赖河灌区盐碱地代表性区域,见图1。苜蓿和玉米作为西北内陆盐碱地主要种植作物,将其作为主要作物覆盖有着重要意义。本研究以边湾农场种植的苜蓿和玉米覆盖土壤作为主要研究对象。
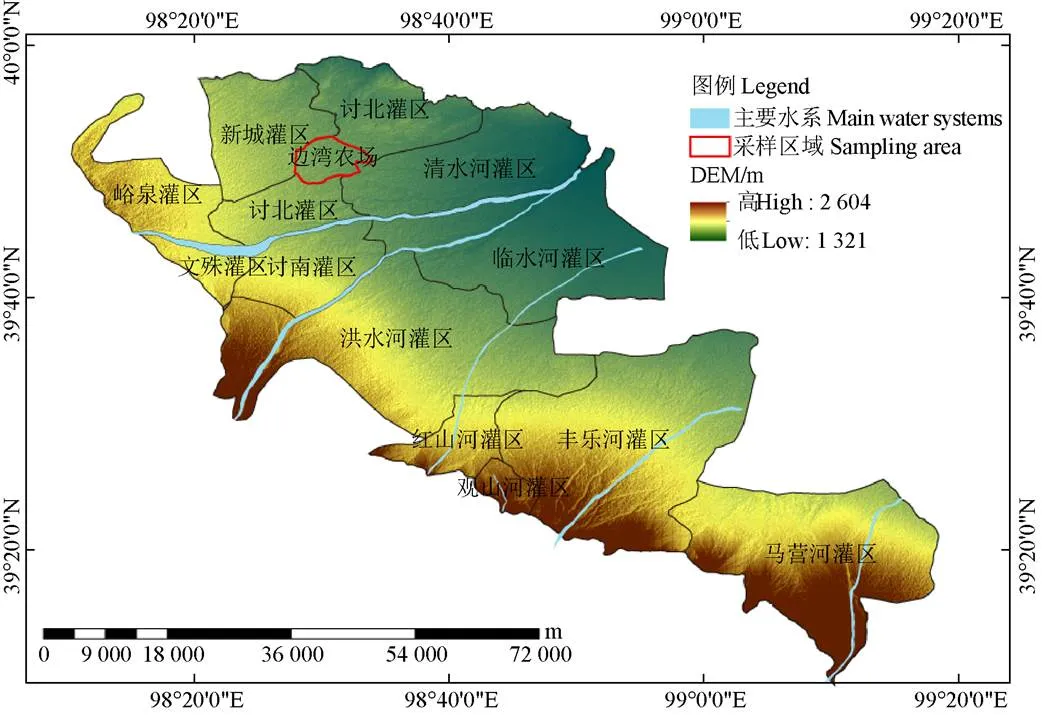
图1 研究区示意图
1.2 试验数据采集与预处理
1.2.1 无人机多光谱遥感影像
使用DJI精灵4,搭载一体式多光谱成像系统,该相机集成可见光以及红光650 nm、绿光560 nm、蓝光450 nm、近红外840 nm以及红边730 nm共5个波段,2022年6月7日在酒泉市边湾农场进行影像实地采样,天气晴朗,无降雨。设置飞行高度40 m,航线重叠率70%,旁像重叠率65%,无人机平均速度4 m/s。采集好的多光谱影像导入大疆智图进行图像校正、拼接等。
1.2.2 野外实测采样
2022年6月8至10日在酒泉市边湾农场进行野外实测采样,采样点分布见图2。
此时该区苜蓿正处于盛花期,玉米处于拔节期,分别在苜蓿样地均匀布设62个取样点,玉米样地布设56个取样点,使用土钻分别对取样点0~15、>15~30以及>30~50 cm深度的土壤进行取样,并记录各点位置信息。每份样品均称量30 g放入铝盒中,烘箱烘干8 h,放凉后进行研磨过筛(孔径2 mm),筛好的土样中加入150 mL蒸馏水并充分搅拌[14],静止数小时后,使用雷磁DJS-1C测定土壤溶液电导率(EC1:5,mS/cm)。根据经验公式SSC=0.288 2EC1:5+0.018 3计算土壤盐分含量(SSC,%)[15]。
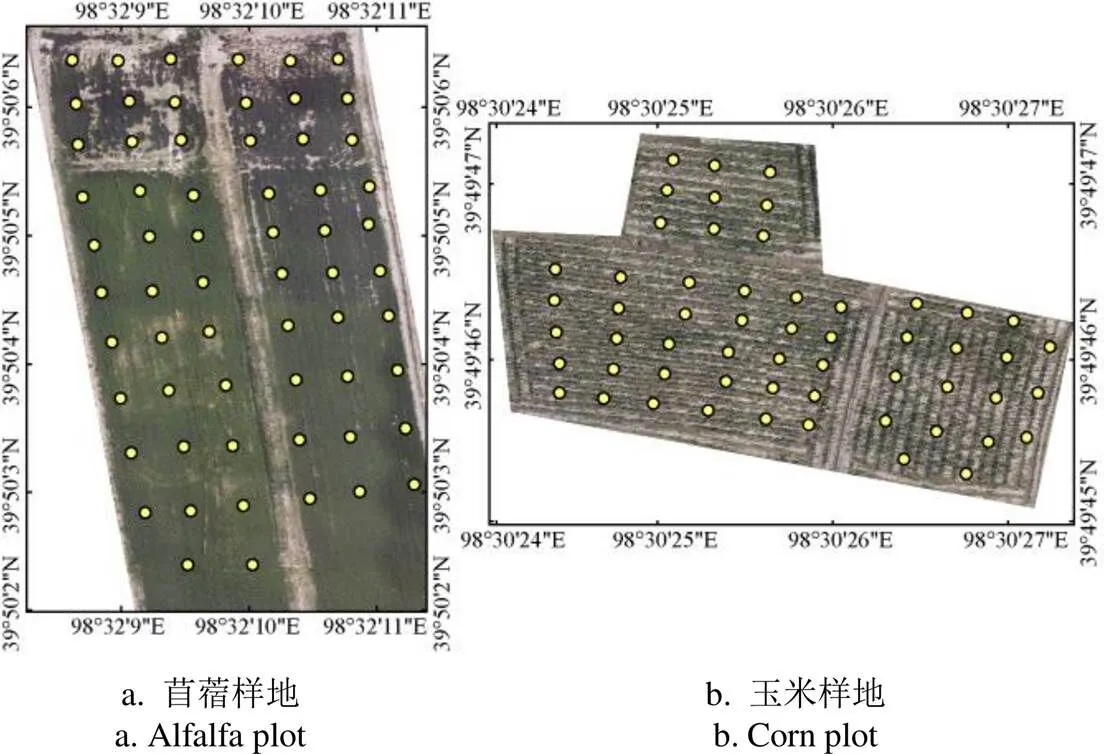
图2 采样点分布图
1.3 光谱指数筛选
SVM-RFE算法是一种基于支持向量机的向后迭代递归特征变量选择方法,主要是利用SVM算法对所研究特征变量进行排序,并评估每个特征变量的重要程度,按照向后迭代逐一剔除重要性低的变量[13],相较于相关性筛选法,该算法有效避免部分变量在进入模型前被过滤的情况,常用于遥感研究[16-18]。本研究将32个常见光谱指数,其中包括16个盐分指数和16个植被指数,通过引入包含更加广泛光谱信息的红边波段来替代红光波段,与传统光谱指数一起共计58个光谱指数参与筛选。
1.4 模型构建与精度评价
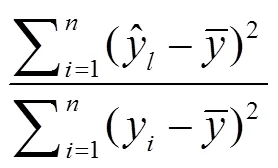
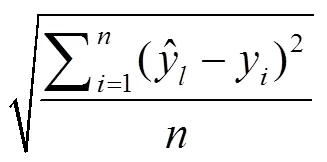
采用RF、ELM和BPNN共3种机器学习算法构建土壤盐分反演模型。以苜蓿和玉米覆盖土壤样本的70%即苜蓿样地43、玉米样地39个样本作为建模集,余下样本作为验证集。通过评估决定系数2、均方根误差RMSE和标准均方根误差nRMSE对模型建模集及验证集进行精度评价。2介于0和1之间,越接近1说明模型精度越高,RMSE越接近0模型精度越高。nRMSE评价模型差异,当其小于10%时说明模型无差异,10%~20%间模型差异较小,20%~30%间模型差异一般,大于30%时,认为模型差异较大[19]。各参数计算公式如下:

2 结果与分析
2.1 土壤盐分含量的分布特征
试验共采集0~15、>15~30、>30~50 cm土层的苜蓿样地样本点62个,玉米样地样本点56个,共计354个采样点,所有样本点的土壤含盐量特性分析见表1。由表1可知,苜蓿样地0~15 cm表层土壤样本重度盐化(土壤含盐量在0.5%~1%)、中度盐化(土壤含盐量在0.2%~0.5%)、轻度盐化(土壤含盐量<0.2%)[15]的样本分别占总样本的1.6%、83.9%、14.5%;>15~30 cm土层中3个等级的样本占比为0%、83.9%、16.1%;30~50 cm土层的样本占比为0%、72.6%、27.4%。玉米样地0~15 cm表层土壤中重度盐化、中度盐化、轻度盐化样本分别占总样本的62.5%、37.5%、0%。>15~30 cm和>30~50 cm中3个等级的样本占比均为51.8%、48.2%、0%。3个土层的样本数量变异系数均小于0.4,变异程度小,最值均在合理范围内,无异常值,可全部用于模型数据集。

表1 土壤含盐量特性描述分析
2.2 光谱指数筛选
本研究选取常见的16个传统盐分指数,分别为NDSI、Int1、Int2、SI、SI1、SI2、SI3、SI-T、S1、S2、S3、S4、S5、S6、SR、BI和16个传统植被指数NDVI、DVI、EVI、RVI、GCI、GSAVI、GRVI、GOSAVI、GNDVI、GLI、GDVI、LAI、IPVI、MSAVI、NNIP、NLI作为模型输入,计算公式见表2。
通过研究引入红边波段对作物参数或土壤水盐反演精度的影响,发现引入红边波段可有效提升反演模型精度[20-22]。本文通过引入红边波段,将以上传统光谱指数中的红光波段用红边波段替代(记为X-reg,如EVI-reg),从而衍生出26个改进光谱指数,共构成58个光谱指数。
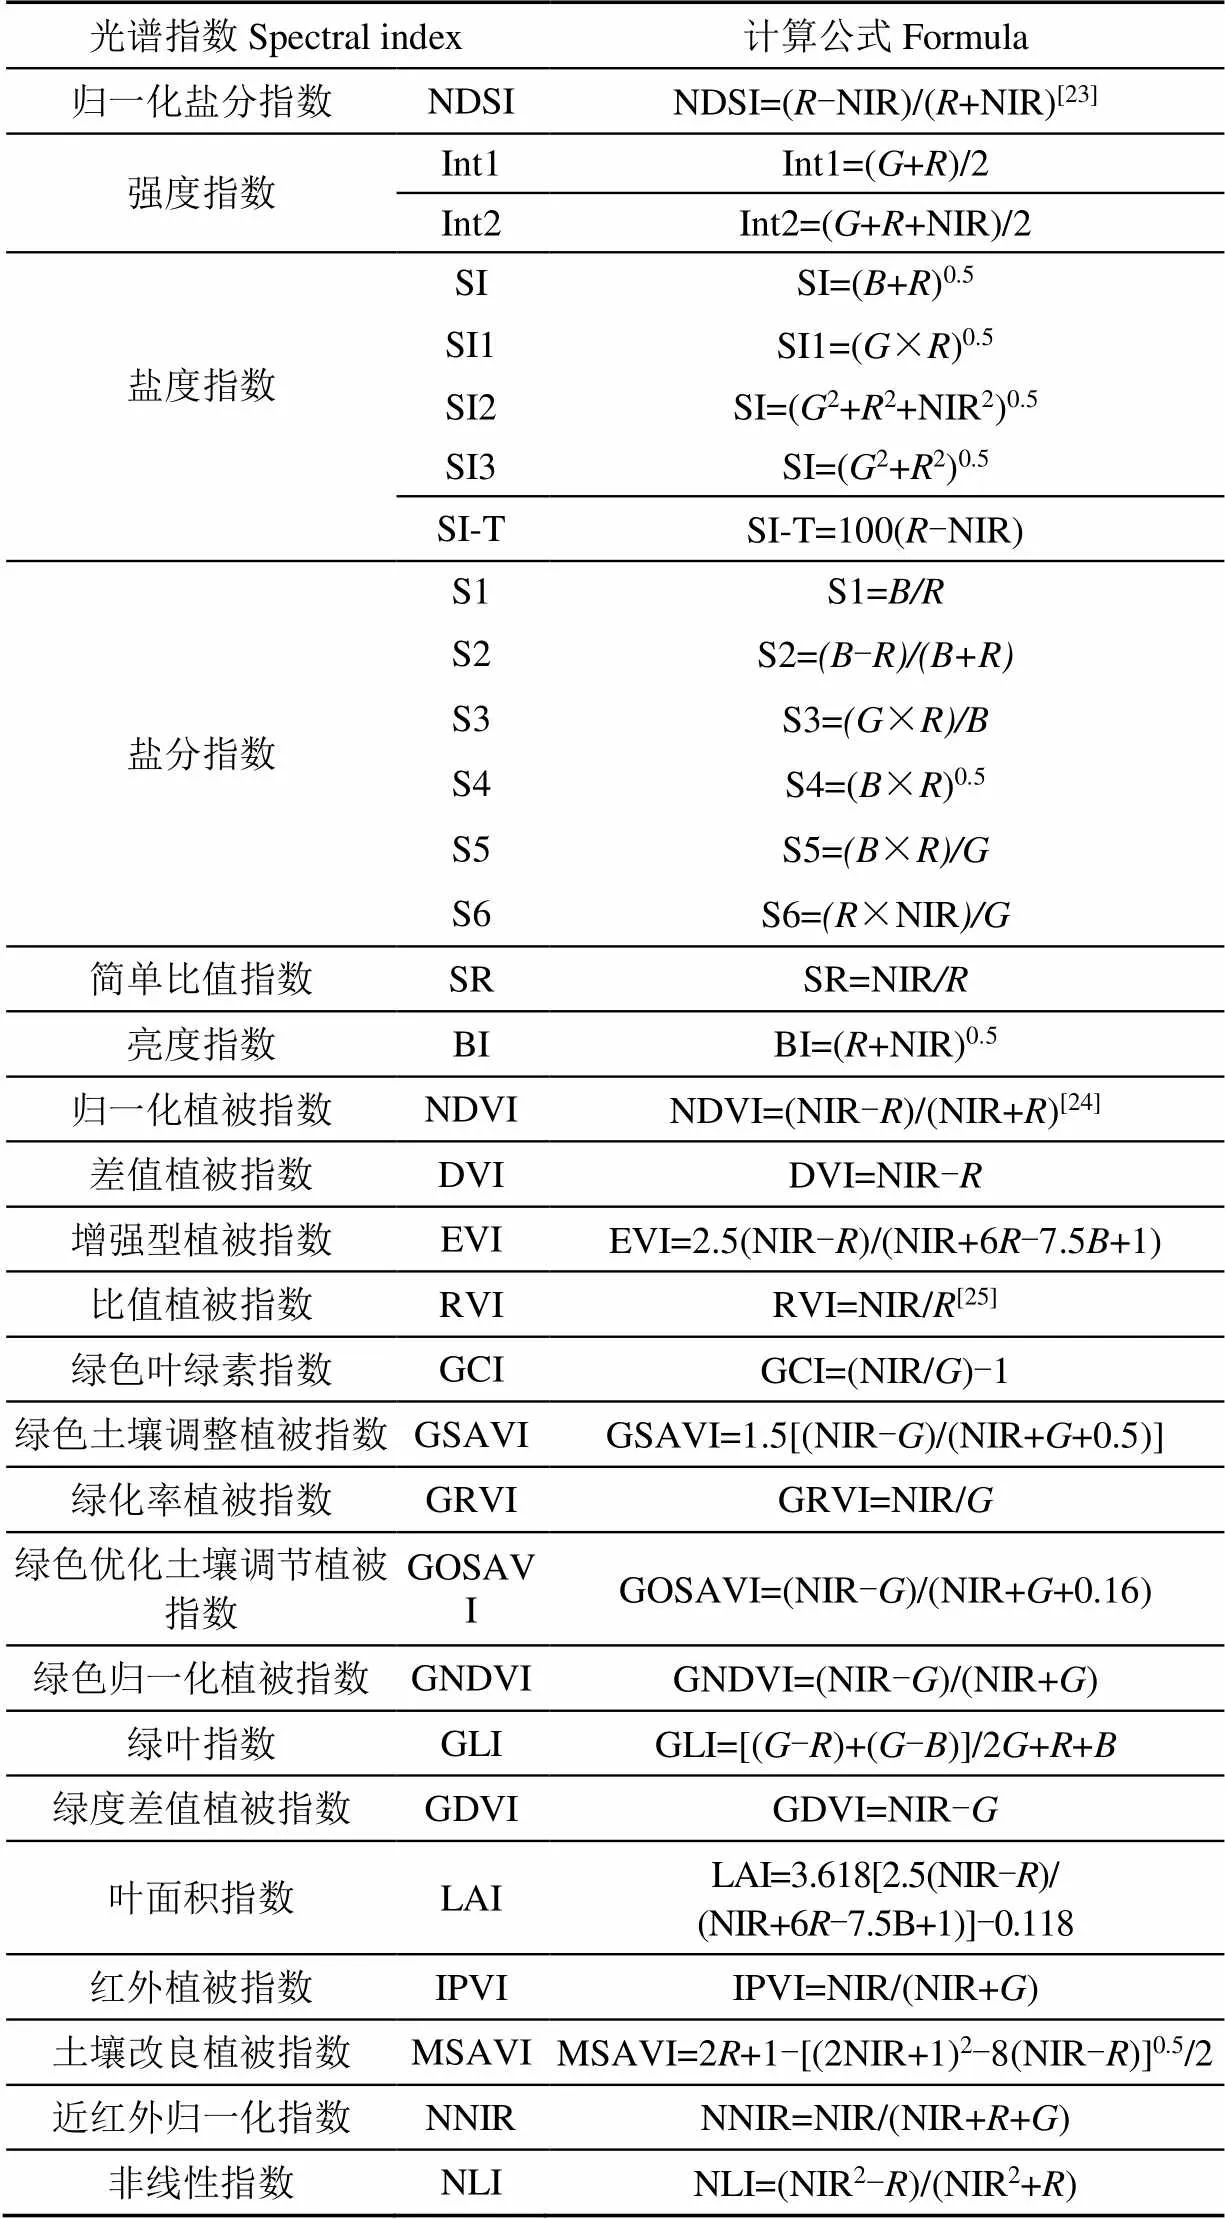
表2 光谱指数计算公式表
注:、NIR代表多光谱影像中红光、绿光、蓝光、近红外波段的反射值。
Note:,,, NIR represent the reflection values of red band, green band, blue band and near-infrared band in multispectral images.
采用SVM-RFE算法对原光谱指数和引入红变波段后共58个光谱指数进行筛选(该算法用MATLAB R2018a实现),通过逐次增加筛选个数,发现设置保留特征为14个时,反演模型精度最好,为避免筛选特征数量对模型精度的影响,对每层土壤均筛选14个光谱指数作为模型的输入量。SVM-RFE使用SVM机器学习模型精度作为度量对特征进行排序,去掉最小特征得分的特征,用剩余特征再次训练模型,进行下一次迭代,直到没有特征,排在前面的单个特征并不一定是最优特征子集,而是特征变量组合在一起才使得模型达到最优学习效果,通过不停迭代,每次减少一个保留特征数量,得到重要程度排序表3。
从表3可知,苜蓿样地筛选结果多为植被指数,且引入红边波段计算出的改进光谱指数占比较大,而玉米样地多为盐分指数。对筛选后的光谱指数组进行相关性检验(图3),发现大部分光谱指数与实测值相关性显著,可用于后续建模。
2.3 基于机器学习的土壤盐分含量反演模型
2.3.1 全指数组模型反演结果分析
为探究SVM-RFE在光谱指数筛选中的适用性,用SVM-RFE算法筛选光谱指数建立模型与未筛选光谱指数组建立模型进行对比,全指数组模型反演结果见表 4,可知将红边波段引入不同作物覆盖下不同深度土壤盐分反演模型的构建中是可行的。全指数组构建模型中,苜蓿和玉米覆盖地0~15 cm土壤层反演效果为最优,其他2个深度层反演效果接近,苜蓿样地RF模型验证集p2在0.50~0.57间,RMSEp在0.030~0.036间,玉米样地RF模型验证集p2在0.60~0.62间,RMSEp在0.044~0.102间,nRMSEc和nRMSEp均小于20%,模型差异小,RF模型表现能力突出,其次是ELM模型。
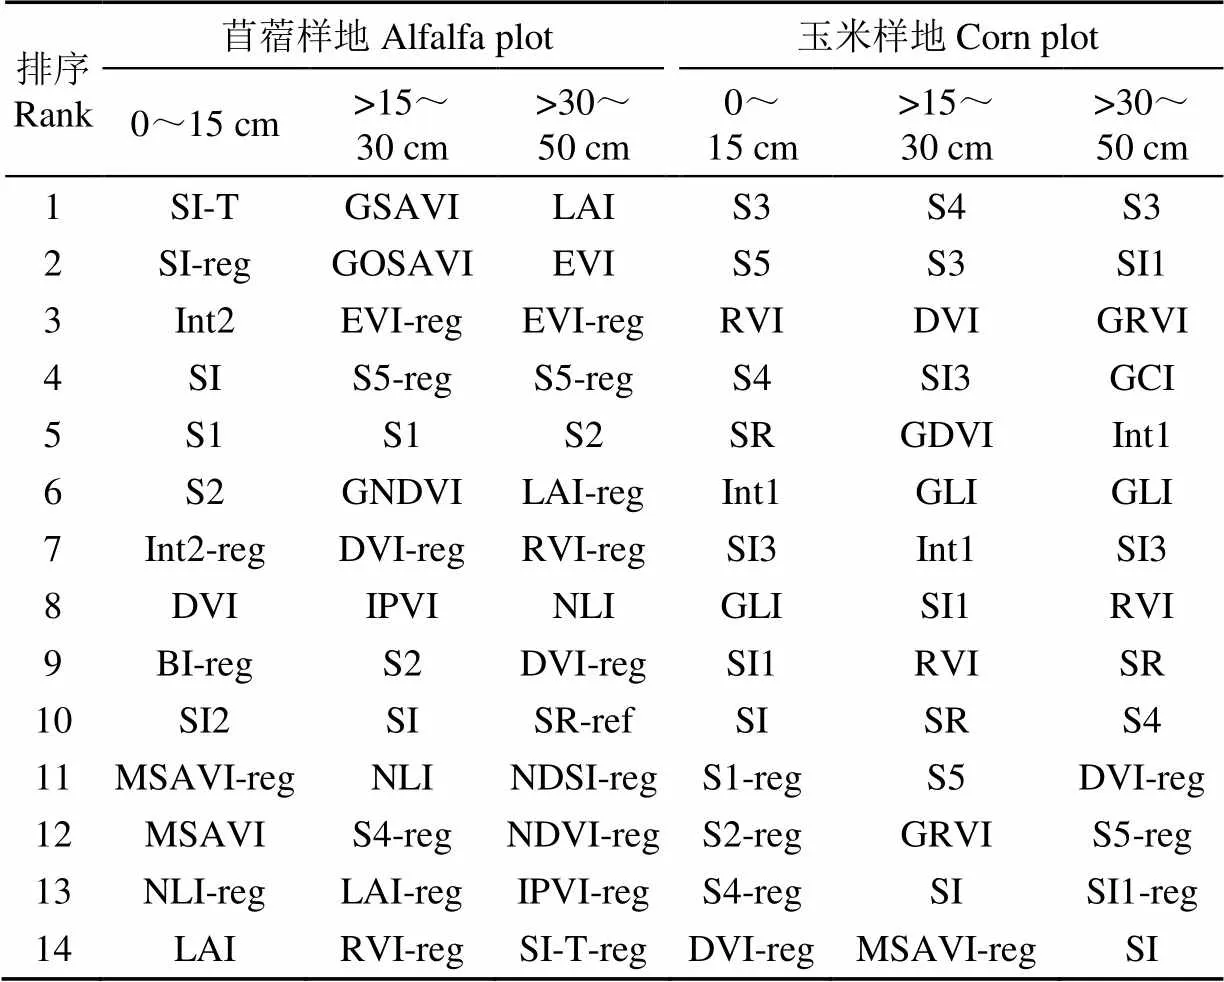
表3 基于SVM-RFE筛选的光谱指数重要性排序
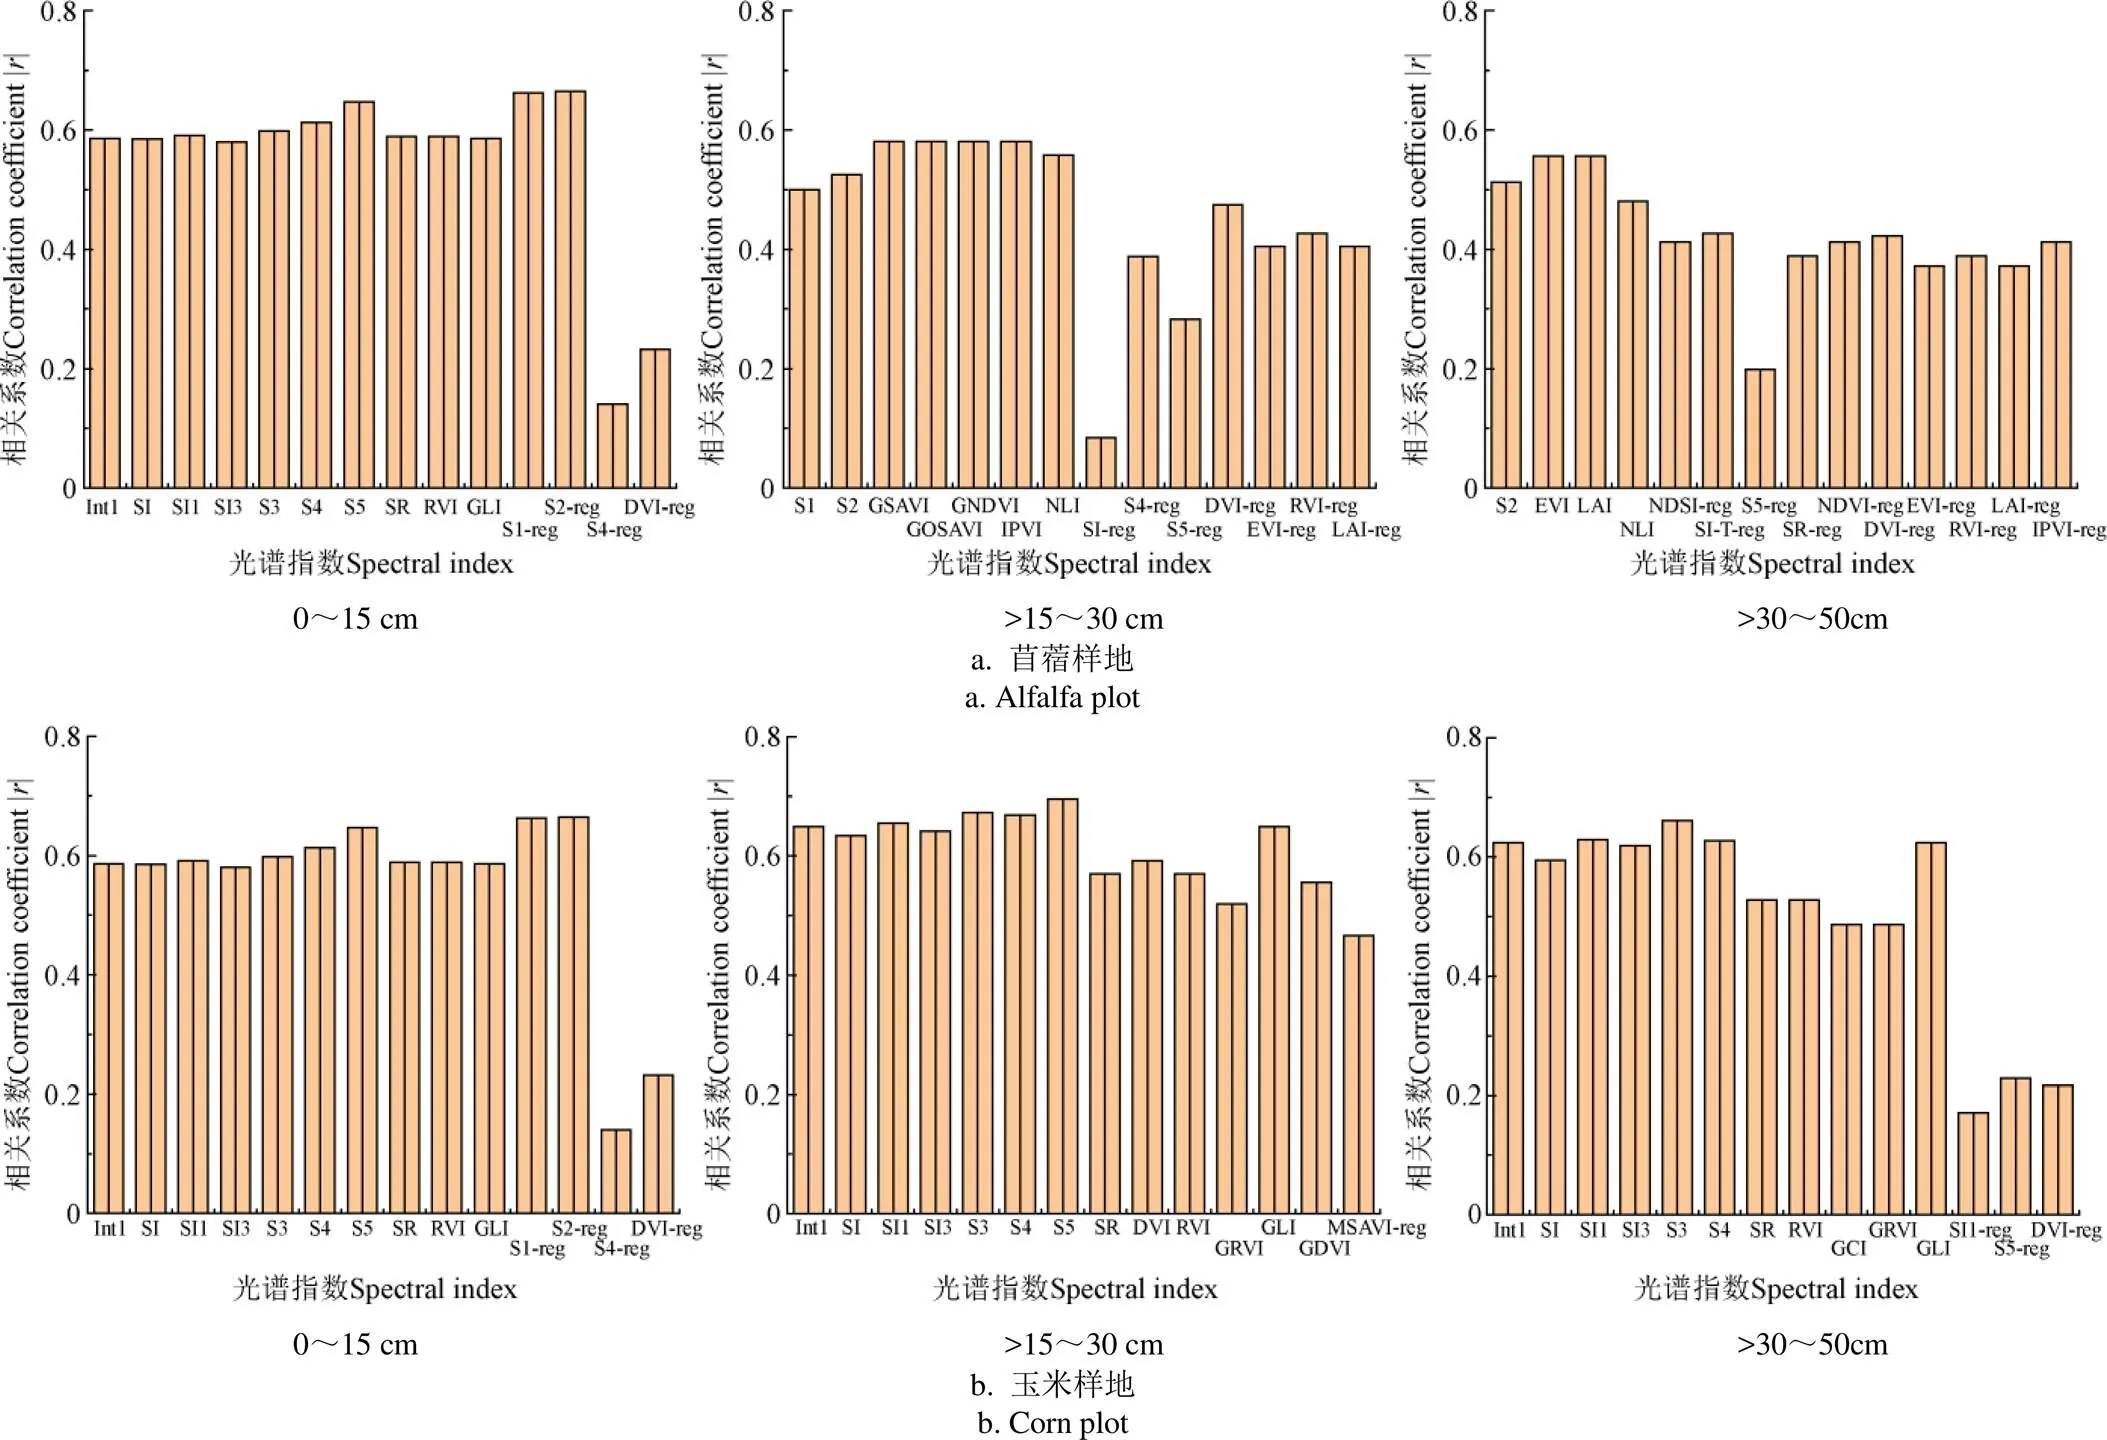
图3 光谱指数与实测土壤含盐量相关系数图
2.3.2 筛选后指数组模型反演分析
用SVM-RFE算法筛选光谱指数后的14个光谱指数建立模型,对比表4和表5,经过指数筛选构建的模型精度优于未进行指数筛选的全指数构建的模型。由表5和图4a可知,对于苜蓿样地,从深度看,0~15、>15~30 和>30~50 cm土层构建的反演模型p2分别在0.61~0.71、0.43~0.58、0.54~0.58之间,RMSEp分别在0.026~0.69、0.030~0.54、0.032~0.39间,0~15 cm土壤盐分反演明显优于其他深度,其次是>30~50 cm。从模型看,对于0~15和>30~50 cm土层盐分反演模型,RF反演效果优于ELM和BPNN,p2分别为0.71、0.58,RMSEp分别为0.026、0.033,其次是ELM;对于>15~30 cm土层,ELM反演精度最高,p2为0.58,RMSEp为0.039,其次是RF模型。综上,苜蓿覆盖下土壤盐分反演最佳深度是0~15 cm,其次是>30~50 cm,且RF整体表现最优,如图 5所示。
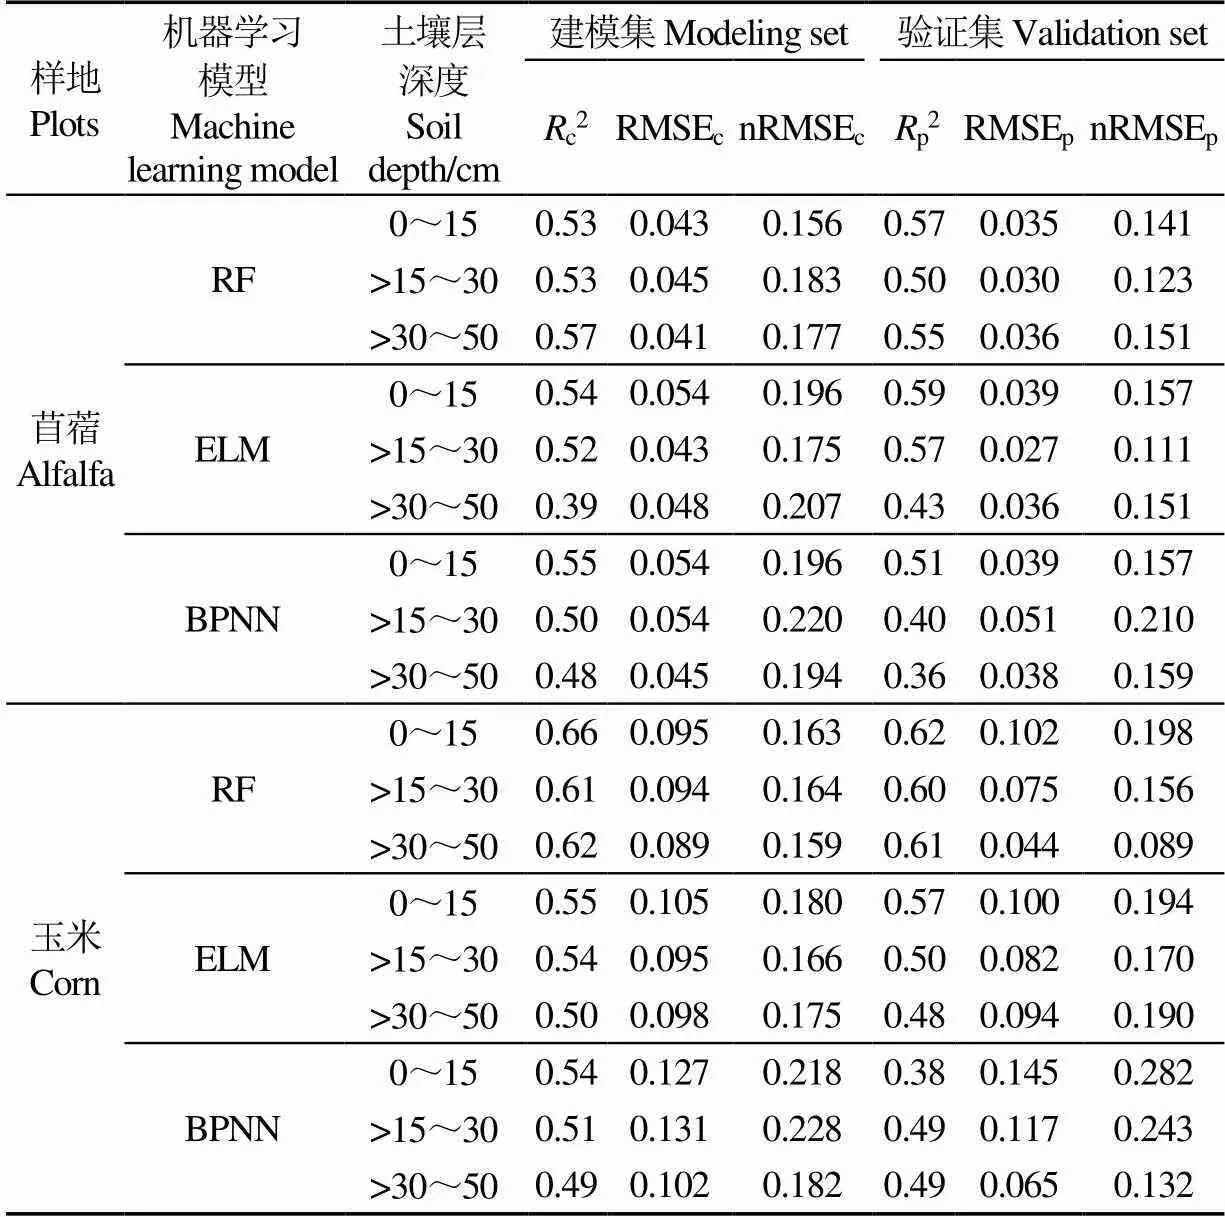
表4 基于全指数组的不同深度土壤盐分含量反演结果
注:c2、RMSEc、nRMSEc分别为建模集的决定系数、均方根误差和标准均方根误差,p2、RMSEp、nRMSEp分别为验证集的决定系数、均方根误差和标准均方根误差。下同。
Note:c2、RMSEcand nRMSEcare the determination coefficient, root mean square error and standard root mean square error of the modeling set, andp2、RMSEpand nRMSEpare the determination coefficient, root mean square error and standard root mean square error of the validation set. The same below.
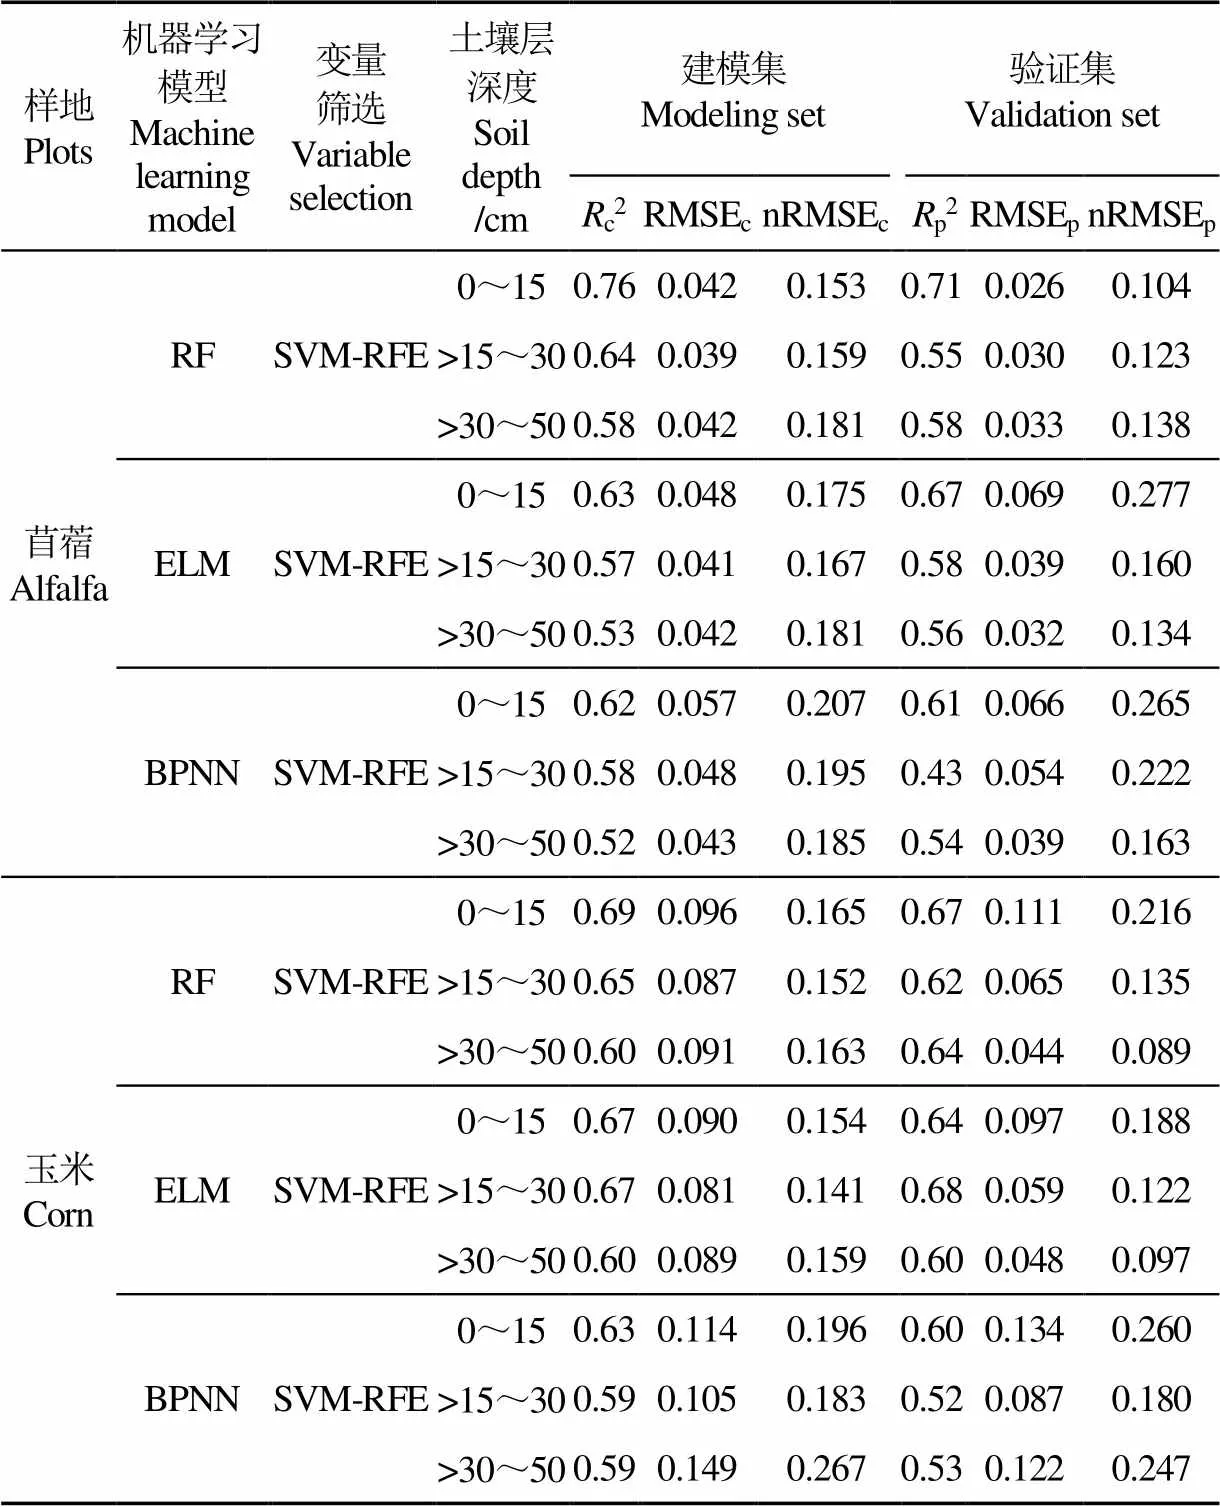
表5 基于SVM-RFE筛选的不同深度土壤盐分反演模型
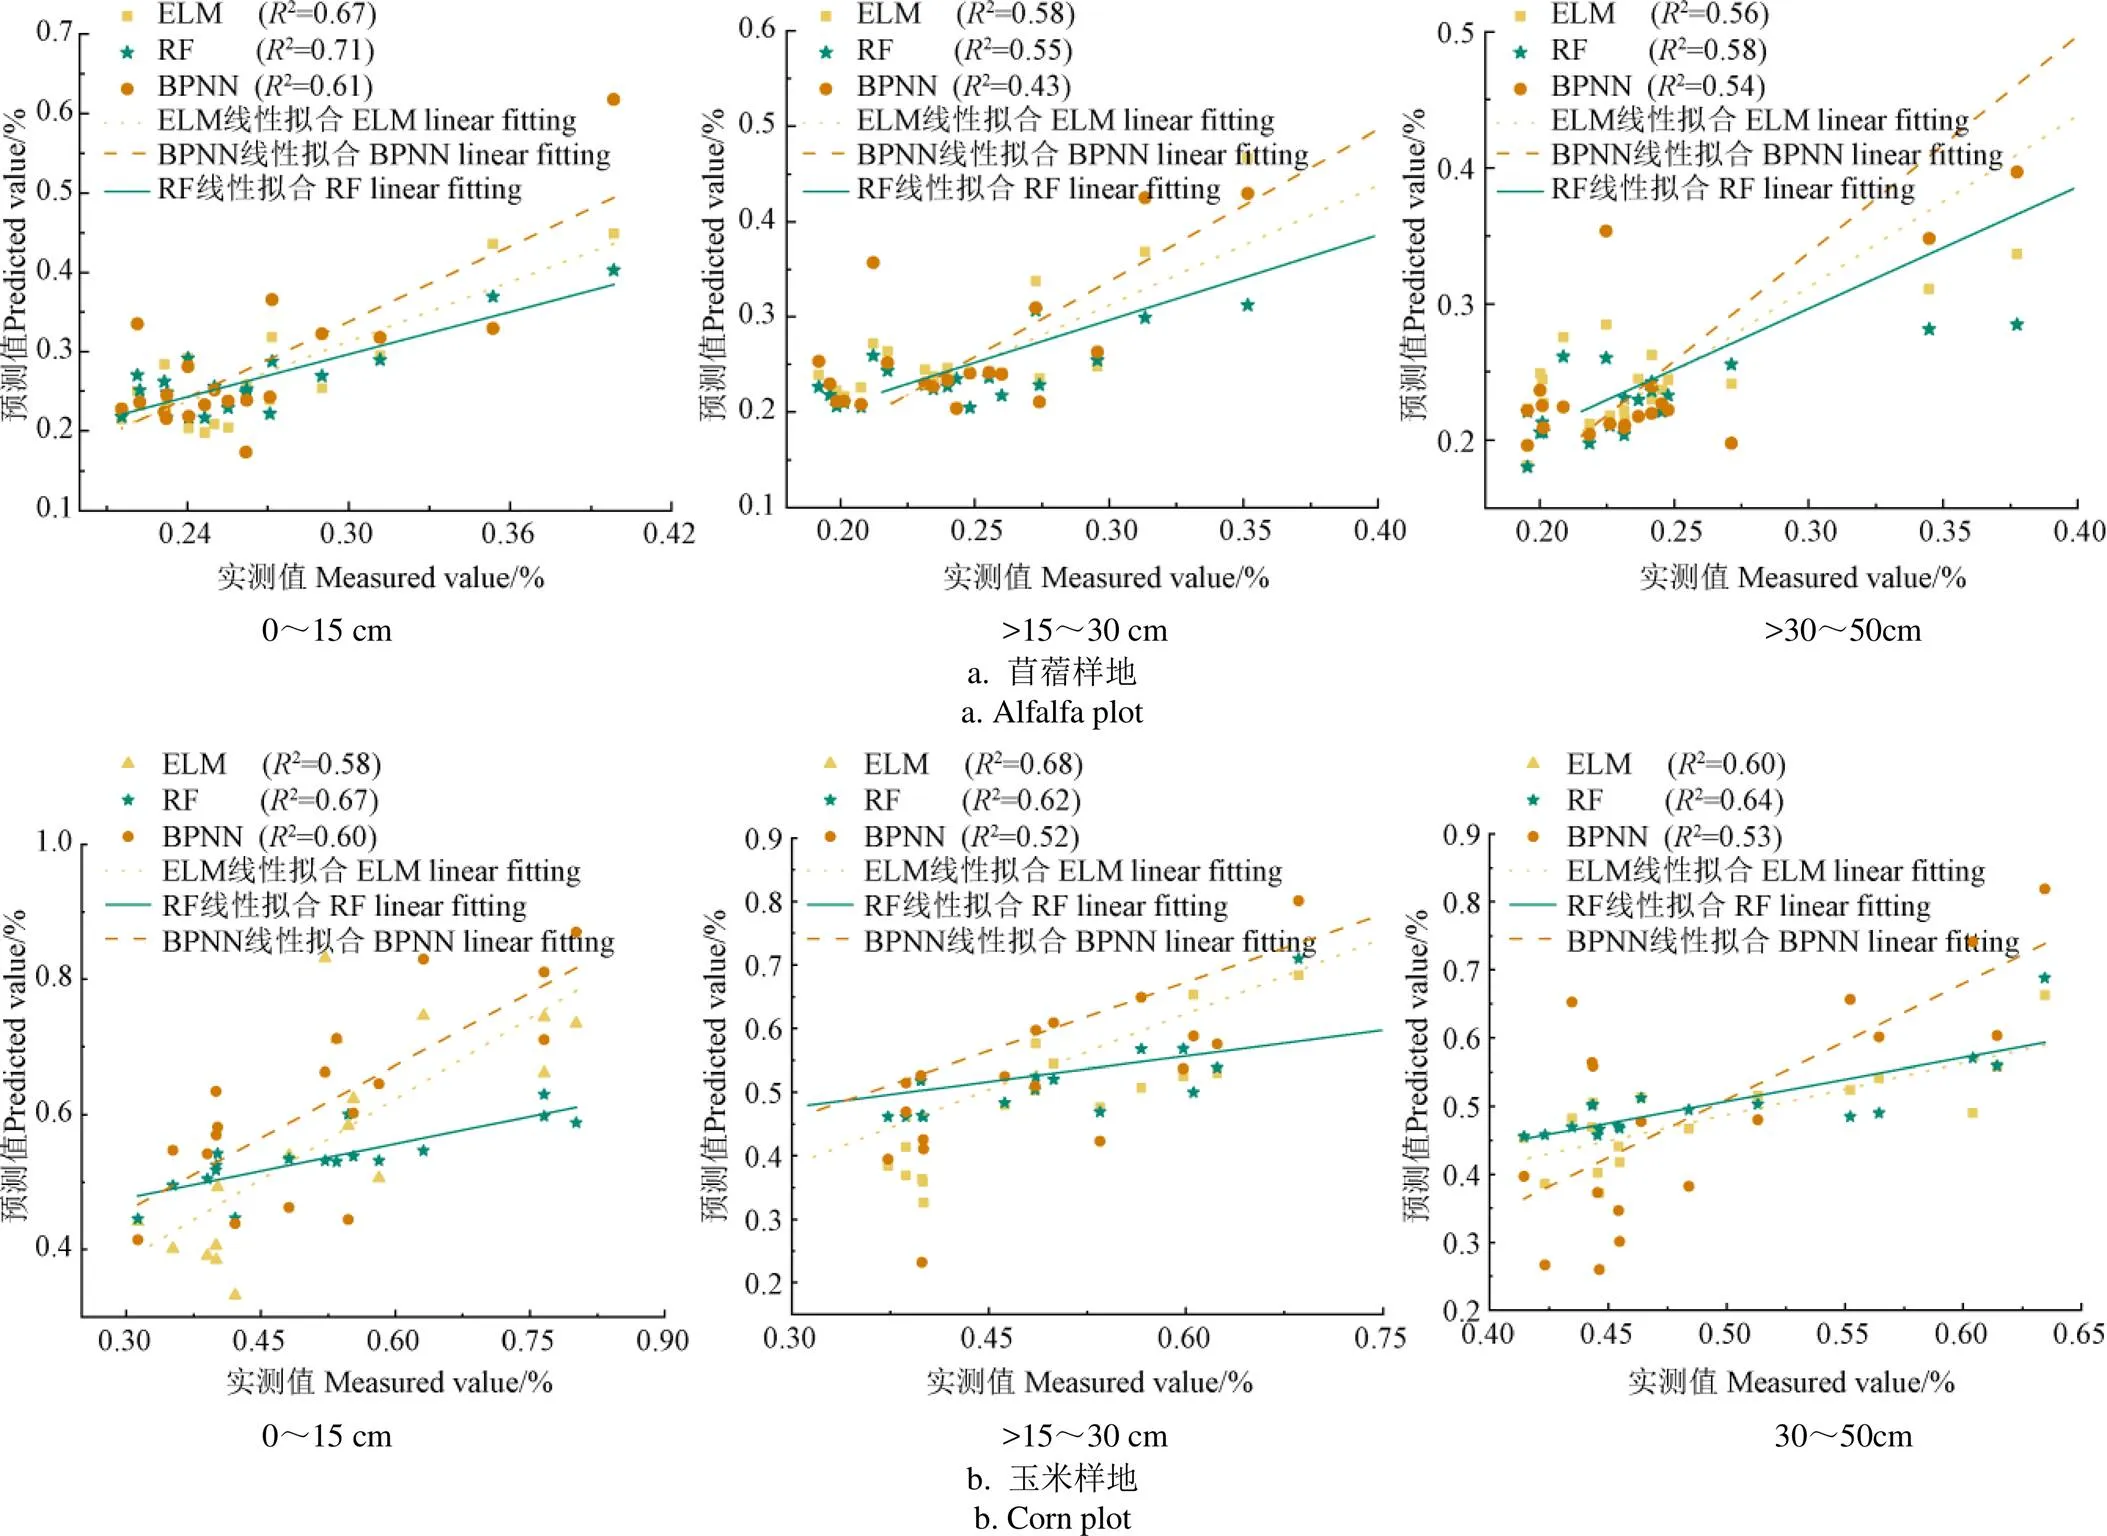
图4 基于SVM-RFE变量筛选的机器学习模型土壤含盐量实测值与预测值对比

图5 苜蓿样地土壤含盐量实测值与预测值对比
由表5和图4b可知,对于玉米样地0~15 、>15~30 和>30~50 cm土层反演模型p2分别在0.60~0.67、0.52~0.68、0.53~0.64之间,RMSEp分别在0.110~0.134、0.059~0.87、0.044~0.122间,0~15 cm、>15~30 cm反演效果优于>30~50 cm。从模型看,玉米与苜蓿样地反演结果一致,在0~15 和30~50 cm土层,RF反演效果最优,p2分别为0.67、0.64,RMSEp分别为0.111、0.094,其次是ELM;对于>15~30 cm土壤,ELM反演精度最高,p2为0.68,RMSEp为0.059,其次是RF模型。综上,玉米覆盖下土壤盐分反演最佳深度是0~15 cm,其次是15~30 cm,RF总体反演效果依然是最佳(如图6所示)。且0~15 cm是作物覆盖下的土壤含盐量最佳反演深度,苜蓿、玉米样地平均p2为0.65,平均RMSE为0.084。

图6 玉米样地土壤含盐量实测值与预测值对比
3 讨 论
作物冠层光谱反射率敏感响应土壤盐分含量,可利用植被指数和盐分指数等建立与实测土壤含盐量的关系,从而实现土壤盐分反演[26]。本文选取苜蓿和玉米覆盖土壤作为研究对象,研究不同植被覆盖下不同深度土壤层含盐量的反演,以无人机搭载多光谱相机为载体,构建了多作物、多深度、多模型的土壤盐分反演模型,实现农耕区不同深度土壤含盐量的快速获取。
通过SVM-RFE变量选择方法筛选出的苜蓿和玉米光谱指数有较明显差异,苜蓿样地筛选后光谱指数大部分为植被指数,玉米样地筛选后光谱指数大部分为盐分指数,主要原因是作物光谱特征因为作物类型不同、植被覆盖度差异较大表现出明显区别(采样时苜蓿覆盖程度高,玉米覆盖程度低,大面积的土壤处于裸露状态),故由光谱波段构建的光谱指数也有显著差异[10,27]。张智韬等[28]在研究植被覆盖程度对土壤含盐量反演的影响时,证实了这一点,随着植被覆盖度增加,盐分指数敏感性逐渐降低,植被指数敏感性逐渐增加。
Wang等[29]以库车绿洲为研究区研究土壤盐分反演算法比较时发现,在0~10 、>10~30 和>30~50 cm三个土层深度中构建的13个盐分反演模型2最高的是0~10 cm层(0.60~0.74),其次是>30~50 cm(0.30~0.47),最低的是10~30 cm(0.15~0.31),这与本研究苜蓿覆盖下土壤盐分反演结果一致。而对于玉米,反演模型效果最好、精度最高的是0~10 cm层,其次是>15~30 cm,最低的是>30~50 cm,这种差异应该是由于作物不同、覆盖度不同以及覆膜产生的[28,30]。
本研究得出,植被覆盖下土壤盐分反演模型在0~15 和30~50 cm土层RF模型表现最好,在15~30 cm土壤层ELM反演效果略优于RF,许多相关研究也发现ELM模型反演精度高[11,30]。综合评估构建模型表现最佳的是RF模型,2种作物0~15 cm土层的RF模型验证集2和RMSE平均值分别为0.69、0.069,>15~30 cm土层的RF模型验证集2和RMSE平均值为0.59、0.048,>30~50 cm土层的RF模型验证集2和RMSE平均值为0.61、0.039。很多学者在做相似反演模型比较时,均认为基于RF算法构建的模型反演精度高,稳定性好,抗过拟合能力强[31-32]。Wei等[33]在进行土壤盐渍化监测模型研究时同样得出在基于RF、BPNN和SVR算法的植被覆盖条件下的含盐量反演机器学习模型中,基于光谱指数组的RF反演模型测试集2为0.67,RMSE为0.112,基于RF算法模型表现最佳。杜瑞麒等[34]在研究基于Sentinel-2多光谱卫星反演植被覆盖下的土壤盐分时同样得出了类似结论。故相比于ELM和BPNN,基于RF算法构建的土壤盐分反演模型更能真实的表达讨赖河流域作物覆盖下土壤的含盐量。
本文主要研究了基于无人机多光谱影像的不同作物覆盖下不同土壤深度盐分反演模型并取得了较好的反演结果,但多源遥感及环境因素对模型的影响有待进一步研究,在今后的学习中,可考虑与卫星遥感相结合,同时将气温、土壤湿度等参数加入到模型构建中,以期确定出精准性更高、适用性更强的土壤盐分反演模型。
4 结 论
本文采集了苜蓿、玉米覆盖下不同深度土壤含盐量,以全指数组和用SVM-RFE筛选光谱指数组结合RF、ELM和BPNN 3种机器学习算法,建立36个作物覆盖下土壤盐分反演模型,并以决定系数2、均方根误差RMSE、标准均方根误差nRMSE评估各模型反演效果,得出以下结论:
1)对比全指数组构建模型,通过SVM-RFE变量选择方法筛选出的光谱指数组作为模型输入数据,所构建的盐分反演模型反演效果更好,均方根误差更小,训练速度也明显提高,表明该变量选择方法用于不同深度层土壤盐分反演及相关研究中来是可行的。
2)对于基于SVM-RFE变量筛选的苜蓿覆盖下的土壤,0~15 cm反演效果最好,其次是>30~50 cm,最后是>15~30 cm,验证集2依次为在0.61~0.71、0.43~0.58、0.54~0.58之间。玉米覆盖下的土壤在0~15 cm土层同样反演效果最好,其次是>15~30 cm,最后是>30~50 cm,验证集2依次在0.60~0.67、0.52~0.68、0.53~0.64间。故作物覆盖下的土壤含盐量的最佳反演深度是0~15 cm,反演结果最能体现真实土壤盐分值。
3)在0~15和>30~50 cm土层RF模型的反演效果最好,苜蓿样地验证集2分别为0.71、0.58,玉米样地验证集2分别为0.67、0.64。>15~30 cm土层ELM模型的反演效果最好,苜蓿样地验证集2为0.58,玉米样地验证集2为0.68。整体看,苜蓿和玉米样地所建反演模型中RF模型总体反演效果优于ELM模型,BPNN模型表现一般。
[1] 王佳丽,黄贤金,钟太洋,等. 盐碱地可持续利用研究综述[J]. 地理学报,2011,66(5):673-684.
Wang Jiali, Huang Xianjin, Zhong Taiyang, et al. Review on sustainable utilization of saline-alkali land[J]. Journal of Geography, 2011, 66(5): 673-684. (in Chinese with English abstract)
[2] Aldabaa A A A, Weindorf D C, Chakraborty S, et al. Combination of proximal and remote sensing methods for rapid soil salinity quantification[J]. Geoderma, 2015, 239: 34-46.
[3] Ding J, Yu D. Monitoring and evaluating spatial variability of soil salinity in dry and wet seasons in the Werigan-Kuqa Oasis, China, using remote sensing and electromagnetic induction instruments[J]. Geoderma, 2014, 235: 316-322.
[4] Ge X, Wang J, Ding J, et al. Combining UAV-based hyperspectral imagery and machine learning algorithms for soil moisture content monitoring[J]. Peer J, 2019, 7: e6926.
[5] 王翔宇,杨菡,李鑫星,等. 基于无人机可见光谱遥感的玉米长势监测[J]. 光谱学与光谱分析,2021,41(1):265-270.
Wang Xiangyu, Yang Han, Li Xinxing, et al. Maize growth monitoring based on UAV visible spectrum remote sensing[J]. Spectroscopy and Spectral Analysis, 2021, 41(1): 265-270. (in Chinese with English abstract)
[6] Kaplan G, Avdan U. Evaluating the utilization of the red edge and radar bands from sentinel sensors for wetland classification[J]. Catena, 2019, 178: 109-119.
[7] 陈鹏飞,Nicolas Tremblay,王纪华,等. 估测作物冠层生物量的新植被指数的研究[J]. 光谱学与光谱分析,2010,30(2):512-517.
Chen Pengfei, Nicolas Tremblay, Wang Jihua, et al. A study on the new vegetation index for estimating crop canopy biomass[J]. Spectroscopy and Spectral Analysis, 2010, 30(2): 512-517. (in Chinese with English abstract)
[8] Hong Y, Chen Y, Yu L, et al. Combining fractional order derivative and spectral variable selection for organic matter estimation of homogeneous soil samples by VIS-NIR spectroscopy[J]. Remote Sensing, 2018, 10(3): 479.
[9] 孔钰如,王李娟,冯海宽,等. 无人机高光谱波段选择的叶面积指数反演[J]. 光谱学与光谱分析,2022,42(3):933-939.
Kong Yuru, Wang Lijuan, Feng Haikuan, et al. Leaf area index inversion of UAV hyperspectral band selection[J]. Spectroscopy and Spectral Analysis, 2022, 42(3): 933-939. (in Chinese with English abstract)
[10] Zhao W, Zhou C, Zhou C, et al. Soil salinity inversion model of oasis in arid area based on UAV multispectral remote sensing[J]. Remote Sensing, 2022, 14(8): 1-13.
[11] 杨宁,崔文轩,张智韬,等. 无人机多光谱遥感反演不同深度土壤盐分[J]. 农业工程学报,2020,36(22):13-21.
Yang Ning, Cui Wenxuan, Zhang Zhitao, et al. Inversion of soil salinity at different depths by UAV multispectral remote sensing[J]. Transactions of the Chinese Society of Agricultural Engineering (Transactions of the CSAE), 2020, 36(22): 13-21. (in Chinese with English abstract)
[12] 张睿,马建文. 一种SVM-RFE高光谱数据特征选择算法[J]. 武汉大学学报(信息科学版),2009,34(7):834-837.
Zhang Rui, Ma Jianwen. SVM-RFE feature selection algorithm for hyperspectral data[J]. Journal of Wuhan University (Information Science Edition), 2009, 34(7): 834-837. (in Chinese with English abstract)
[13] 甄佳宁,蒋侠朋,赵德梅,等. 利用Sentinel-2影像超分辨率重建的红树林冠层氮含量反演[J]. 遥感学报,2022,26(6):1206-1219.
Zhen Jianing, Jiang Xiapeng, Zhao Demei, et al. Inversion of mangrove canopy nitrogen content using Sentinel-2 image super-resolution reconstruction[J]. Journal of Remote Sensing, 2022, 26(6): 1206-1219. (in Chinese with English abstract)
[14] Zhang F, Tashpolat T, Ding J L, et al. Relationships between soil salinization and spectra in the delta oasis of Weigan and Kuqa Rivers[J]. Research of Environmental Sciences, 2009, 22(2): 227-235.
[15] 黄权中,徐旭,吕玲娇,等. 基于遥感反演河套灌区土壤盐分分布及对作物生长的影响[J]. 农业工程学报,2018,34(1):102-109.
Huang Quanzhong, Xu Xu, Lyu Lingjiao, et al. Soil salinity distribution based on remote sensing and its effect on crop growth in Hetao Irrigation District[J]. Transactions of the Chinese Society of Agricultural Engineering (Transactions of the CSAE), 2018, 34(1): 102-109. (in Chinese with English abstract)
[16] Hankui Z, Bo H, Le Y. Kernel function in SVM-RFE based hyperspectral data band selection[J]. Remote Sensing Technology and Application, 2014, 28(5): 747-752.
[17] Zhang R, Ma J. Feature selection for hyperspectral data based on recursive support vector machines[J]. International Journal of Remote Sensing, 2009, 30(14): 3669-3677.
[18] Chen L, Xing M, He B, et al. Estimating soil moisture over winter wheat fields during growing season using machine-learning methods[J]. IEEE Journal of Selected Topics in Applied Earth Observations and Remote Sensing, 2021, 14: 3706-3718.
[19] 谭丞轩,张智韬,许崇豪,等. 无人机多光谱遥感反演各生育期玉米根域土壤含水率[J]. 农业工程学报,2020,36(10):63-74.
Tan Chengxuan, Zhang Zhitao, Xu Chonghao, et al. Soil water content inversion model in field maize root zone based on UAV multispectral remote sensing[J]. Transactions of the Chinese Society of Agricultural Engineering (Transactions of the CSAE), 2020, 36(10): 63-74. (in Chinese with English abstract)
[20] Kaplan G, Avdan U. Evaluating the utilization of the red edge and radar bands from sentinel sensors for wetland classification[J]. Catena, 2019, 178: 109-119.
[21] Wang J, Ding J, Yu D, et al. Capability of Sentinel-2 MSI data for monitoring and mapping of soil salinity in dry and wet seasons in the Ebinur Lake region, Xinjiang, China[J]. Geoderma, 2019, 353: 172-187.
[22] Zheng Q, Huang W, Cui X, et al. New spectral index for detecting wheat yellow rust using Sentinel-2 multispectral imagery[J]. Sensors, 2018, 18(3): 868.
[23] Khan N M, Rastoskuev V V, Sato Y, et al. Assessment of hydrosaline land degradation by using a simple approach of remote sensing indicators[J]. Agricultural Water Management, 2005, 77(1/2/3): 96-109.
[24] Allbed A, Kumar L, Aldakheel Y Y. Assessing soil salinity using soil salinity and vegetation indices derived from IKONOS high-spatial resolution imageries: Applications in a date palm dominated region[J]. Geoderma, 2014, 230: 1-8.
[25] 苏伟,王伟,刘哲,等.无人机影像反演玉米冠层LAI和叶绿素含量的参数确定[J].农业工程学报,2020,36(19):58-65.
Su Wei, Wang Wei, Liu Zhe, et al. Determination of parameters for inversion of maize canopy LAI and chlorophyll content from UAV images[J]. Transactions of the Chinese Society of Agricultural Engineering (Transactions of the CSAE), 2020, 36(19): 58-65. (in Chinese with English abstract)
[26] 张智韬,魏广飞,姚志华,等. 基于无人机多光谱遥感的土壤含盐量反演模型研究[J]. 农业机械学报,2019,50(12):151-160.
Zhang Zhitao, Wei Guangfei, Yao Zhihua et al. Research on inversion model of soil salt content based on UAV multispectral remote sensing[J]. Transactions of the Chinese Society for Agricultural Machinery, 2019, 50(12): 151-160. (in Chinese with English abstract)
[27] 陈俊英,姚志华,张智韬,等. 大田葵花土壤含盐量无人机遥感反演研究[J]. 农业机械学报,2020,51(7):178-191.
Chen Junying, Yao Zhihua, Zhang Zhitao, et al. Research on soil salinity of sunflower in field by UAV remote sensing inversion[J]. Transactions of the Chinese Society for Agricultural Machinery, 2020, 51(7): 178-191. (in Chinese with English abstract)
[28] 张智韬,台翔,杨宁,等. 不同植被覆盖度下无人机多光谱遥感土壤含盐量反演[J]. 农业机械学报,2022,53(8):220-230.
Zhang Zhitao, Tai Xiang, Yang Ning, et al. Inversion of soil salt content by UAV multispectral remote sensing under different vegetation coverage[J]. Transactions of the Chinese Society for Agricultural Machinery, 2022, 53(8): 220-230. (in Chinese with English abstract)
[29] Wang F, Shi Z, Biswas A, et al. Multi-algorithm comparison for predicting soil salinity[J]. Geoderma, 2020, 365: 114211.
[30] 姚志华,陈俊英,张智韬,等. 覆膜对无人机多光谱遥感反演土壤含盐量精度的影响[J]. 农业工程学报,2019,35(19):89-97.
Yao Zhihua, Chen Junying, Zhang Zhitao, et al. Effect of film mulching on inversion accuracy of soil salinity by UAV multispectral remote sensing[J]. Transactions of the Chinese Society of Agricultural Engineering (Transactions of the CSAE), 2019, 35(19): 89-97. (in Chinese with English abstract)
[31] Chen X W, Liu M. Prediction of protein-protein interactions using random decision forest framework[J]. Bioinformatics, 2005, 21(24): 4394-4400.
[32] Lindner C, Bromiley P A, Ionita M C, et al. Robust and accurate shape model matching using random forest regression-voting[J]. IEEE transactions on pattern analysis and machine intelligence, 2014, 37(9): 1862-1874.
[33] Wei G, Li Y, Zhang Z, et al. Estimation of soil salt content by combining UAV-borne multispectral sensor and machine learning algorithms[J]. PeerJ, 2020, 8(2): e9087.
[34] 杜瑞麒,陈俊英,张智韬,等. Sentinel-2多光谱卫星遥感反演植被覆盖下的土壤盐分变化[J]. 农业工程学报,2021,37(17):107-115.
Du Ruiqi, Chen Junying, Zhang Zhitao, et al. Sentinel-2 multispectral satellite remote sensing inversion of soil salt changes under vegetation cover[J]. Transactions of the Chinese Society of Agricultural Engineering (Transactions of the CSAE), 2021, 37(17): 107-115. (in Chinese with English abstract)
Soil salinity inversion model based on the multispectral images of UAV
Zhao Wenju, Ma Fangfang, Ma Hong, Zhou Chun
(,,730050,)
Soil salinization has posed a serious threat to the growth and yield of crops in the national food security. Among them, the Taolai River basin with the widely distributed saline-alkali land has been one of the most important planting areas in northwest China. It is a high demand for the timely acquisition of soil salinity information during the salinization control. In this study, a representative sampling area of soil salinization was taken as the Bianwan Farm in Suzhou District, Jiuquan City, Gansu Province, China. A rapid inversion model of soil salinity was proposed at the soil depths of 0-15, 15-30, and 30-50 cm under the crop cover of alfalfa and corn in the phenological period. The multi-spectral image data of the Unmanned Aerial Vehicle (UAV) was also collected at the same time. The reflectance of the spectral band was extracted in the different acquisition points of plots. The red edge band was also introduced to calculate the spectral index, in order to effectively improve the inversion accuracy. A total of 58 spectral indices were involved in the modeling. The Support Vector Machine-Recursive Feature Elimination (SVM-RFE) was selected to screen the spectral index. Specifically, the SVM was used to sort the feature variables, and then evaluate the importance of each feature variable. The variables with low importance were removed, according to the backward iteration. As such, a better performance was achieved to effectively remove the redundant features for the high running speed of the model. A total of 36 models were constructed to evaluate the accuracy and inversion effect of the models, including Random Forest (RF), Extreme learning machine (ELM), and Back-propagation neural network (BPNN). The model input was taken as the unfiltered full and filtered new variable group. Finally, the best soil-salinity inversion model was determined for the optimal inversion depth under crop coverage. The results show that the SVM-RFE variable selection significantly improved the accuracy of each soil-salinity inversion model. A better performance was achieved in the coefficient of determination (2), root-mean-square error (RMSE), and training speed of the improved model, compared with the model without variable screening. Overall, the inversion effect of the RF model was better than that of ELM and BPNN models. Among them, the inversion effect was one of the best indicators for real soil salt. Specifically, the RF model presented the best inversion effect in the 0-15 and 30-50 cm soil layers under crop cover, where thep2values of the validation set in the alfalfa field were 0.71 and 0.58, respectively, RMSEpvalues were 0.026 and 0.033, respectively; thep2values in the corn field were 0.67 and 0.64, respectively, the RMSEpvalues were 0.111 and 0.094, respectively. In the 15-30 cm layer, the ELM model presented the best inversion effect, where thep2values in the alfalfa and corn fields were 0.58, and 0.039, respectively; the RMSEpvalues were 0.68, and 0.059, respectively. In the terms of inversion depth, the inversion effects of 0-15 cm and 30-50 cm were better than that of 15-30 cm for the alfalfa-covered soil. The inversion effects of 0-15 cm and 15-30 cm were better than that of 30-50 cm for the corn-covered soil. The comprehensive analysis showed that the 0-15 cm soil layer was the best inversion depth for the soil salt content under crop cover, where the average2of the validation set was 0.65, and the RMSE was 0.084. A strong reference was offered to manage the saline-alkali land in the arid area of northwest China. The finding can also provide a scientific basis for the rapid inversion of salt in the different soil depth layers under crop mulching.
UAV; soils; salinity; multispectral; SVM-RFE; inversion model
10.11975/j.issn.1002-6819.2022.24.010
S127
A
1002-6819(2022)-24-0093-09
赵文举,马芳芳,马宏,等. 基于无人机多光谱影像的土壤盐分反演模型[J]. 农业工程学报,2022,38(24):93-101.doi:10.11975/j.issn.1002-6819.2022.24.010 http://www.tcsae.org
Zhao Wenju, Ma Fangfang, Ma Hong, et al. Soil salinity inversion model based on the multispectral images of UAV[J]. Transactions of the Chinese Society of Agricultural Engineering (Transactions of the CSAE), 2022, 38(24): 93-101. (in Chinese with English abstract) doi:10.11975/j.issn.1002-6819.2022.24.010 http://www.tcsae.org
2022-09-12
2022-11-08
国家自然科学基金项目(51869010)
赵文举,博士,教授,博士生导师,研究方向为寒旱区生态水利。Email:wenjuzhao@126.com

