基于TGARCH-VineCopula的电价波动分析及风险度量研究
2022-03-02 06:36:32赖春羊马光文陈仕军王建华
电力系统保护与控制 2022年4期
谢 航,赖春羊,曾 宏,马光文,陈仕军,2,王建华
基于TGARCH-VineCopula的电价波动分析及风险度量研究
谢 航1,赖春羊1,曾 宏1,马光文1,陈仕军1,2,王建华3
(1.四川大学水利水电学院/水力学与山区河流开发保护重点实验室,四川 成都 610065;2.四川大学商学院,四川 成都 610065;3.国家能源大渡河公司,四川 成都 610041)
在市场化交易中,计及电价波动信息的风险度量可以帮助市场利益相关者规避风险。为此,结合TGARCH与VineCopula理论,提出一种电价波动分析及风险度量的新方法。该方法用TGARCH建立日前、实时及辅助服务交易电价边缘分布,通过VineCopula拟合各交易电价的多维相依结构。基于得到的相关系数与尾部关系分析各交易电价之间的动态波动规律,并测度电价动态波动风险。实证分析证明,该方法不仅可以捕捉负荷容量比和可再生能源渗透率作用下价格波动的变化,还可以较为准确地描述各交易电价的非线性关联结构,进而捕获日前、实时、辅助服务交易电价之间逐时动态波动特征。此外,与其他方法相比还能更有效地降低组合波动风险。
电价分析;TGARCH;VineCopula;风险度量
0 引言
电价是电力市场的支点,是电网公司、发电企业、市场监管部门在评估、决策、监督时参考的关键指标[1-4]。随着国内新一轮电力体制改革工作的推进,国内已有8个区域开始现货市场试点运行[5],电价风险管理对参与现货交易的相关者显得尤为重要。现阶段,国内外针对电价风险管理的研究,按关键风险信息的角度可分为2类:1) 基于电价水平信息,设计风险管理机制和决策方法[6];2) 基于电价波动信息,进行风险度量[7]、评估[8]与预警[9],其中,风险度量是后两者的基础。对于风险度量,研究人员较常使用金融风险领域的参数法和半参数法计算风险的大小[10],它们的重点在于选择准确的模型对电价波动拟合,这突显了价格波动分析的重要性。
已有研究表明电价波动主要呈现“均值回复”、“极值跳跃”和“杠杆效应”等规律[11-13]。文献[14-16]发现结合广义自回归条件异方差模型(Generalized Auto-Regressive Conditional Heteroskedasticity, GARCH)[17]与自回归移动平均模型(Auto-Regressive Moving Average Model, ARMA)[18]或自回归积分滑动平均模型(Auto-Regressive Integral Moving Average Model, ARIMA)[19],可以较好地描述电价波动的均值回复及异方差性。文献[20-21]指出EGARCH与TGARCH模型还适合刻画电价波动的杠杆效应。文献[22-23]构建了考虑电价水平与负荷容量比、可再生能源渗透率等外生因素的TGARCH模型,其比EGARCH能更合理地解释电价波动的杠杆效应。但上述研究对日前或实时交易电价的波动特性研究的较多,较少关注辅助服务以及多个交易品种电价间的关联性。事实上,同国外PJM、Nord Pool等电力市场一样,国内广东、四川等试点省份的市场交易规则均指出市场主体有参与辅助服务交易的义务[24-25]。文献[26]研究了负荷与日前、实时和辅助服务交易电价之间的波动关系,但缺乏定量的分析。VineCopula理论广泛应用于多变量间非线性相关结构的研究,比如文献[7]运用VineCopula捕获了多个发电商损益间的尾部关联性。
关于电价波动风险度量方面,通常应用风险价值(Value at Risk,VaR)作为度量风险的指标[27]。文献[20]证明了Copula-VaR模型度量风险的效果较好,并且在度量组合风险上优势显著。文献[7]证明了适用于Copula-VaR与电力市场有关的动态风险度量。
综上,本研究在借鉴已有研究基础上,提出一种电力交易价格波动分析与VaR度量的新方法。结合TGARCH门限模型刻画逐时刻日前、实时与辅助服务交易电价的波动特征,并分析各交易电价波动特征;引入VineCopula理论构建日前、实时和辅助服务市场交易电价的0~23时(h)多维相依模型,进而定量分析不同交易价格波动之间的关联;计算三种置信度(即0.90、0.95、0.98)下电价与组合电价的动态波动风险曲线;最后通过实例证明本研究所提方法的可行性。
1 研究模型
1.1 动态波动分析
1.1.1边缘分布建模


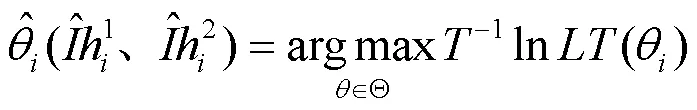

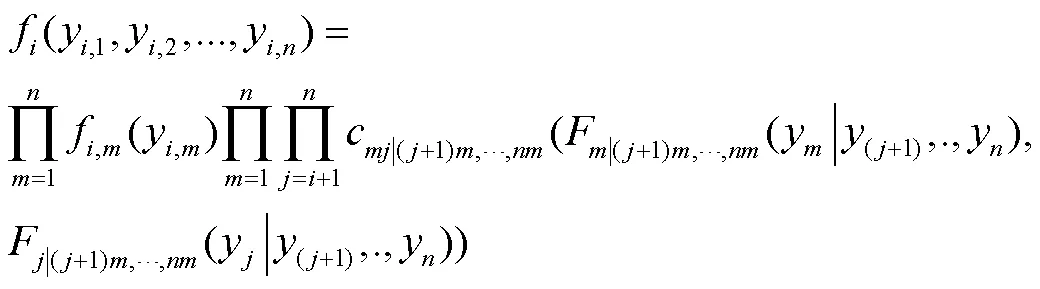
1.1.2联合分布建模


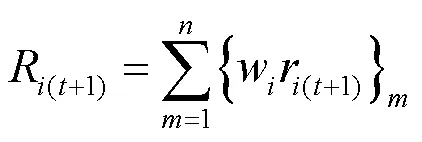
1.2 波动风险度量
VaR是广泛得到应用的风险度量指标[31],能有效反映价格波动剧烈时可能导致的最大损失,具体数学表达式为


1.3 TGARCH-VineCopula模型的构建
基于TGARCH-VineCopula的动态波动分析及风险度量模型构建流程如图1所示。

图1 TGARCH-VineCopula的建模流程
建模步骤如下。


步骤6 依据1.2节所述方法估计VaR值。
2 实证分析
2.1 实证数据统计分析


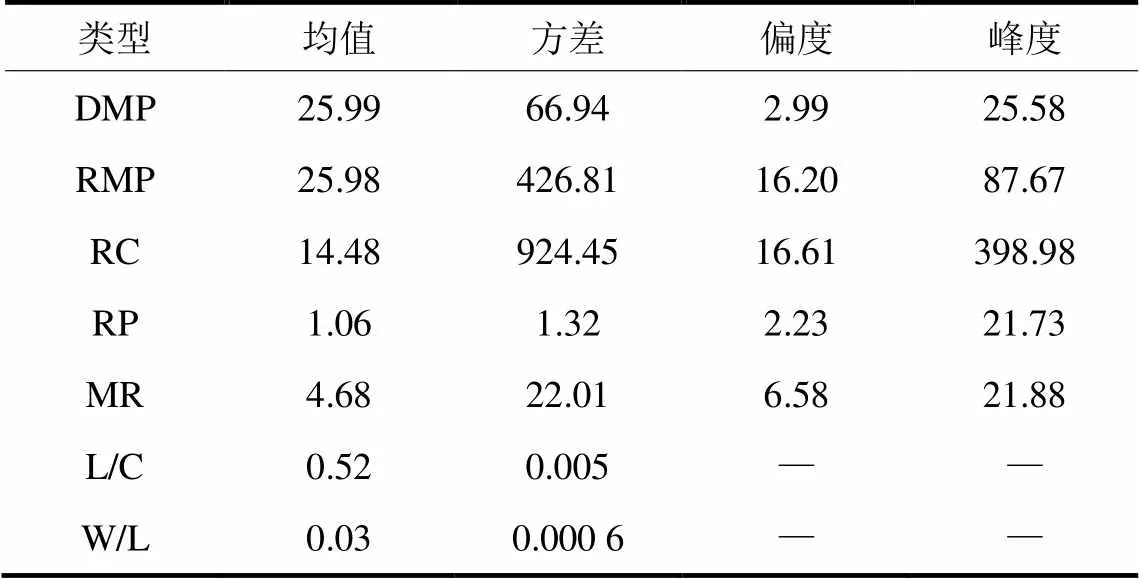
表1 主要描述性指标统计
注:上表列出的是0~23 h的各序列的平均值。
2.2 动态波动特征分析


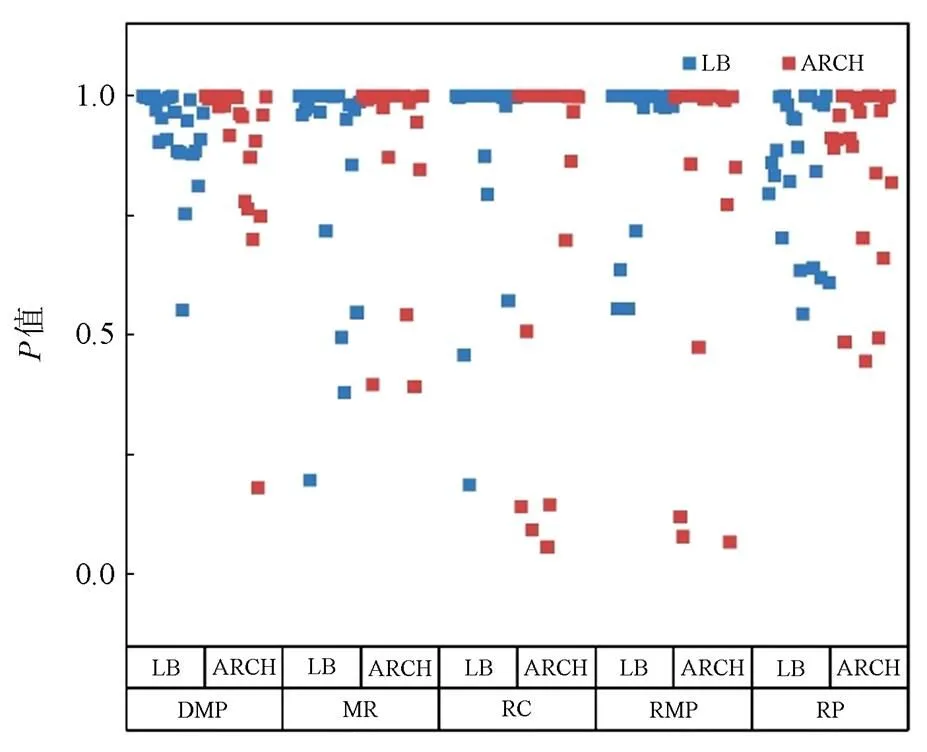
图2 LJung-Box、ARCH-LM检验结果


图3 DMP等电价序列非线性相依关系
2.3 动态波动风险分析

比较图4与图 5可知,第2)种组合(1,2,3,45)波动VaR整体低于第1)种(2,1)组合以及RMP、RC、RP、MR波动VaR。根据现有交易规则,市场成员不能只参与日前现货交易,所以各市场成员可以在考虑自身容忍风险水平上,分析日前、实时、辅助服务交易的关系,结合单个或组合交易品种一天的电价波动风险,分散交易风险,使利益最大化。

图4 三种置信度下动态VaR的变化曲线
图5 三种置信水平下动态组合VaR的变化曲线
Fig.5 Performance of dynamic portfolio VaR curvesunder three confidence levels

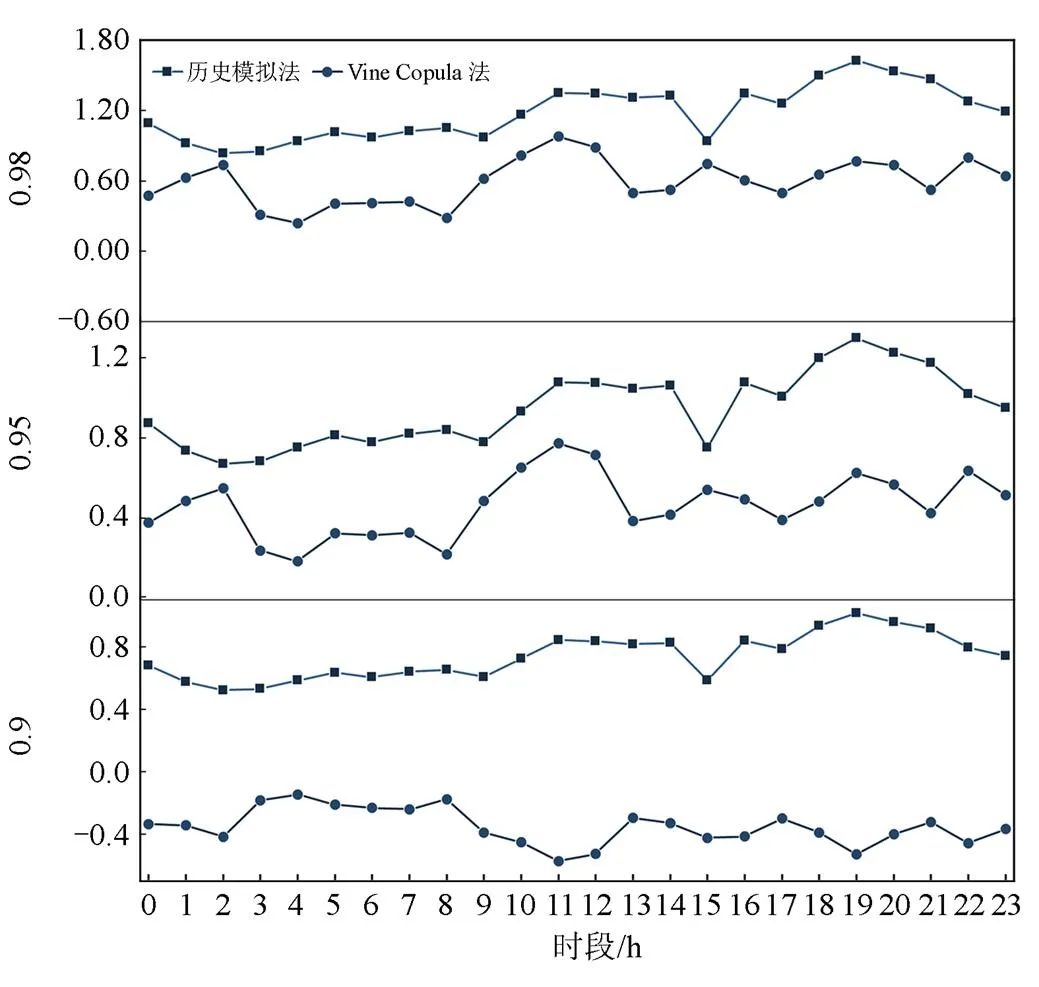
图6 三个置信度下组合VaR曲线
3 结论

附表1 0~23 h DMP序列边缘分布模型系数估计
Attached Table 1 Estimation of marginal distribution model coefficients of 0~23 hrs DMP

01234567891011 偏态分布 0.310.120.100.090.080.100.080.080.100.160.060.05 0.090.780.900.900.920.830.920.920.850.260.940.95 (1.00)(1.00)(1.00)(0.99)(0.58)(1.00)(1.00)(1.00)(1.00)(1.00)(1.00)(1.00) 0.0000.000.000.000.000.000.000.000.000.000.000.00 121314151617181920212223 偏态分布 0.060.110.060.240.270.190.130.150.160.170.320.27 0.940.760.940.720.000.270.830.850.840.830.100.08 (0.99)(1.00)(1.00)(1.00)(0.56)(1.00)(1.00)(1.00)(1.00)(1.00)(1.00)(1.00) 0.000.000.000.000.000.000.000.000.000.000.000.00
附表2 0~23 h RMP序列边缘分布模型系数估计
Attached Table 2 Estimation of marginal distribution model coefficients of 0~23 hrs RMP

01234567891011 学生t分布 0.350.650.300.250.270.100.490.200.080.280.970.68 0.030.060.700.710.570.880.510.770.860.000.000.32 (1.00)(1.00)(0.70)(0.76)(0.14)(0.85)(0.62)(1.00)(0.99)(1.00)(0.48)(0.07) 0.000.000.130.000.000.000.000.000.000.000.000.00 121314151617181920212223 学生t分布 0.230.030.040.030.480.410.470.500.300.160.640.34 0.770.970.960.850.000.420.120.500.700.810.150.66 (0.74)(1.00)(1.00)(0.94)(1.00)(1.00)(0.81)(1.00)(1.00)(1.00)(1.00)(1.00) 0.000.000.000.000.000.000.000.000.000.000.000.00
附表3 0~23 h RC序列边缘分布模型系数估计
Attached Table 3 Estimation of marginal distribution model coefficients of 0~23 hrs RC

01234567891011 偏正态分布 0.060.040.050.500.490.400.190.030.020.070.080.10 0.020.850.870.500.510.600.720.870.980.870.720.90 (1.00)1.000.61(0.78)(0.78)(0.46)(1.00)1.00(1.00)(1.00)(0.86)(0.80) 0.000.000.000.050.050.690.000.000.000.000.410.33 121314151617181920212223 偏正态分布 0.090.000.050.050.030.010.000.000.200.200.140.02 0.900.590.910.900.900.990.000.960.800.800.000.16 (1.00)0.250.020.271.00(1.00)(1.00)(1.00)0.790.79(1.00)(1.00) 1.540.000.000.000.000.000.001.880.000.000.000.00
附表4 0~23 h RP序列边缘分布模型系数估计
Attached Table 4 Estimation of marginal distribution model coefficients of 0~23 hrs RP

01234567891011 学生t分布正态分布学生t分布 0.360.430.64(0.90)0.330.100.270.180.270.210.090.00 0.600.290.36(0.06)0.570.840.630.720.400.790.891.00 0.280.06(0.09)(0.37)0.410.810.25(0.25)(0.02)(0.21)0.481.00 0.000.030.000.000.000.060.000.020.400.000.000.00 121314151617181920212223 学生t分布正态分布学生t分布 0.150.250.030.040.020.070.030.910.901.000.380.40 0.810.410.940.870.890.900.870.080.100.190.500.35 (1.00)(0.49)(0.82)1.001.000.02(1.00)(0.35)(0.24)(0.15)(0.03)(0.23) 0.000.010.020.010.000.000.010.000.000.000.030.00
附表5 0~23 h MR序列边缘分布模型系数估计
Attached Table 5 Estimation of marginal distribution model coefficients of 0~23 hrs MR
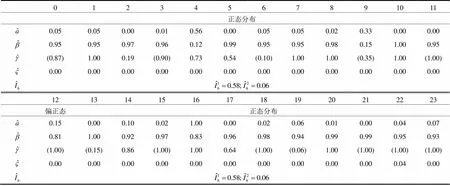
01234567891011 正态分布 0.050.050.000.010.560.000.050.050.020.330.000.00 0.950.950.970.960.120.990.950.950.980.151.000.95 (0.87)1.000.19(0.90)0.730.54(0.10)1.001.00(0.35)1.00(1.00) 0.000.000.000.000.000.000.000.000.000.000.000.00 121314151617181920212223 偏正态正态分布 0.150.000.100.021.000.000.020.060.010.000.040.07 0.811.000.920.970.830.960.980.940.990.990.950.93 (1.00)(0.15)0.86(1.00)1.000.64(1.00)(0.06)1.00(1.00)(1.00)(1.00) 0.000.000.000.000.000.000.000.000.000.000.040.00
注:括号中的数值为负数
[1] 谢开.美国电力市场运行与监管实例分析[M].北京: 中国电力出版社, 2017.
[2] 姚星安, 曾智健, 杨威,等.广东电力市场结算机制设计与实践[J].电力系统保护与控制, 2020, 48(2): 76-85.
YAO Xing'an, ZENG Zhijian, YANG Wei, et al.Electricity market settlement mechanism design and practice in Guangdong[J].Power System Protection and Control, 2020, 48(2): 76-85.
[3] 曾佳妮, 林晓凡, 钟桦, 等.可再生能源消纳背景下直接交易中的二次出清与定价[J].电力建设, 2020, 41(10): 30-37.
ZENG Jiani, LIN Xiaofan, ZHONG Hua, et al.Secondary clearing rules and price determination in direct electricity trading with renewable energy consumption[J].Electric Power Construction, 2020, 41(10): 30-37.
[4] 杜威, 刘东, 李文云, 等.基于配网节点电价的综合能源系统随机优化[J].电力建设, 2020, 41(12): 141-151.
DU Wei, LIU Dong, LI Wenyun, et al.Stochastic optimization of integrated energy system considering distribution locational marginal price[J].Electric Power Construction, 2020, 41(12): 141-151.
[5] 孙可, 兰洲, 林振智, 等.国际典型电力市场阻塞管理机制及其对中国的启示研究[J].电力系统保护与控制, 2020, 48(12): 170-178.
SUN Ke, LAN Zhou, LIN Zhenzhi, et al.Transmission congestion management mechanism of typical international power markets and possible guidance for China’s power market[J].Power System Protection and Control, 2020, 48(12): 170-178.
[6] 路嘉琦, 李强, 宋少群, 等.基于概率边际电价的价格风险管理机制设计[J].电网技术, 2020, 44(12): 65-74.
LU Jiaqi, LI Qiang, SONG Shaoqun, et al.Price risk management mechanism based on probabilistic[J].Power System Technology, 2020, 44(12): 65-74.
[7] 谢敏, 胡昕彤, 柯少佳, 等.基于vine-Copula的发电商运营损益动态风险VaR评估方法[J].电力系统自动化, 2019, 43(5): 39-45, 52.
XIE Min, HU Xintong, KE Shaojia, et al.vine-Copula based dynamic risk VaR assessment method for operation profit and loss of generation companies[J].Automation of Electric Power Systems, 2019, 43(5): 39-45, 52.
[8] 谢敬东, 陆池鑫, 鲁思薇, 等.基于序关系-熵权法的电力市场风险评估[J].中国电力, 2021, 54(6): 71-78.
XIE Jingdong, LU Chixin, LU Siwei, et al.Evaluation of status of electricity market risk based on order relation-entropy weight method[J].Electric Power, 2021, 54(6): 71-78.
[9] 黄仁辉, 张集, 张粒子, 等.整合GARCH和VaR的电力市场价格风险预警模型[J].中国电机工程学报, 2009, 29(19): 85-91.
HUANG Renhui, ZHANG Ji, ZHANG Lizi, et al.Price risk forewarning of electricity market based on GARCH and VaR theory[J].Proceedings of the CSEE, 2009, 29(19): 85-91.
[10] 熊尚飞, 邹小燕.电力市场价格风险价值与波动预测研究综述[J].电力系统保护与控制, 2014, 42(2): 146-153.
XIONG Shangfei, ZOU Xiaoyan.Value at risk and price volatility forecasting in electricity market: a literature review[J].Power System Protection and Control, 2014, 42(2): 146-153.
[11] SIMONSEN I.Volatility of power markets[J].Physica A: Statistical Mechanics and its Applications, 2005, 355(1): 10-20.
[12]CHIU H Y, CHEN T F.Impact of volatility jumps in a mean-reverting model: derivative pricing and empirical evidence[J].The North American Journal of Economics and Finance, 2019, 52: 101-112.
[13] OTTESEN S Ø, TOMASGARD A, FLETEN S E.Multi market bidding strategies for demand side flexibility aggregators in electricity markets[J].Energy, 2018, 149: 120-134.
[14] GARCIA R C, CONTRERAS J, AKKEREN M V, et al.A GARCH forecasting model to predict day-ahead electricity prices[J].IEEE Transactions on Power Systems, 2005, 20(2): 867-874.
[15]王贺.系统边际电价预测的GARCH建模[D].北京: 华北电力大学, 2007.
WANG He.GARCH modeling system marginal price forecast[D].Beijing: North China Electric Power University, 2007.
[16]王瑞庆, 王宏福.基于t分布GARCH模型的电价波动时变性研究[J].电力系统保护与控制, 2011, 39(23): 49-53, 59.
WANG Ruiqing, WANG Hongfu.Investigation on time-varying volatility of electricity price based on GARCH model with student-t distribution[J].Power System Protection and Control, 2011, 39(23): 49-53, 59.
[17]CHEN H, ZHANG J, TAO Y, et al.Asymmetric GARCH type models for asymmetric volatility characteristics analysis and wind power forecasting[J].Protection and Control of Modern Power Systems, 2019, 4(4): 356-366.
[18]HUANG L, YANG Y, ZHAO H, et al.Time series modeling and filtering method of electric power load stochastic noise[J].Protection and Control of Modern Power Systems, 2017, 2(3): 269-275.
[19]BOWDEN N, PAYNE J E.Short term forecasting of electricity prices for MISO hubs: evidence from ARIMA-EGARCH models[J].Energy Economics, 2008, 30(6): 3186-3197.
[20]刘丽燕, 邹小燕.GARCH族模型在电力市场电价预测中的比较研究[J].电力系统保护与控制, 2016, 44(4): 57-63.
LIU Liyan, ZOU Xiaoyan.Comparison of GARCH models in electricity price forecasting[J].Power System Protection and Control, 2016, 44(4): 57-63.
[21]李停.基于ARMA-GARCH模型的电价预测与研究[D].重庆: 重庆师范大学, 2015.
LI Ting.Electricity price forecasting and research based on ARMA-GARCH model[D].Chongqing: Chongqing Normal University, 2009.
[22]熊尚飞.考虑负荷容量比的电力市场电价波动与风险价值—基于门限四归模型TGARCH-I[D].重庆: 重庆师范大学, 2014.
XIONG Shangfei.Price volatility and value-at-risk in electricity market considering load/capacity ratio—based on threshold GARCH-I model[D].Chongqing: Chongqing Normal University, 2014.
[23]王永茹.基于TGARCH模型的电价波动性分析[D].济南: 山东大学, 2020.
WANG Yongru.Analysis of wlectricity price volatility based on TGARCH model[D].Jinan: Shandong University, 2020.
[24]广东调频辅助服务市场交易规则(试行)[EB/OL].https:// shoudian.bjx.com.cn/news/20180808/919432.shtml.
Guangdong FM auxiliary service market trading rules (trial)[EB/OL].https://shoudian.bjx.com.cn/news/20180808/ 919432.shtml.
[25]项中明, 石博隆, 吴昌, 等.考虑无功辅助服务分段报价的多目标无功优化方法[J].电力系统保护与控制, 2021, 49(6): 40-47.
XIANG Zhongming, SHI Bolong, WU Chang, et al.Research on AVC considering quotation rules of reactive power ancillary services in the electricity market[J].Power System Protection and Control, 2021, 49(6): 40-47.
[26]刘德旭, 马光文, 陶春华, 等.PJM电力市场交易价格分布特征及波动风险度量[J].电网与清洁能源, 2020, 36(9): 15-21.
LIU Dexu, MA Guangwen, TAO Chunhua, et al.Electricity prices distribution characteristics and volatility risk measurement in the PJM power market[J].Power System and Clean Energy, 2020, 36(9): 15-21.
[27]冯玉明.基于VaR的电力市场价格风险度量[D].重庆:重庆师范大学, 2012.
FENG Yuming.Electricity market price risk measurement based on VaR[D].Chongqing: Chongqing Normal University, 2012.
[28]贺学强, 易丹辉.基于动态Copula方法的股票组合VaR估计[J].统计与决策, 2010(17): 11-14.
HE Xueqiang, YI Danhui.Stock portfolio VaR estimation based on dynamic Copula method[J].Statistics & Decision, 2010(17): 11-14.
[29]AAS K, CZADO C, FRIGESSI A, et al.Pair-copula constructions of multiple dependence[J].Insurance Mathematics and Economics, 2007, 44(2).
[30]高江.藤Copula模型与多资产投资组合VaR预测[J].数理统计与管理, 2013, 32(2): 247-258.
GAO Jiang.Vine Copula model and VaR for multi-asset portfolio[J].Journal of Applied Statistics and Management, 2013, 32(2): 247-258.
[31]燕飞.基于VaR和ES的分位数损失QS的估计[D].武汉: 武汉大学, 2017.
YAN Fei.Estimation of the quantile shortfall based on VaR and ES[D].Wuhan: Wuhan University, 2017.
[32]陶荟名.基于Copula-VaR模型在金融风险管理中的应用研究[D].昆明: 云南财经大学, 2019.
TAO Huiming.Application of Copula-VaR model in financial risk management[D].Kunming: Yunnan University of Finance and Economics, 2019.
[33]PJM.Markets & operations data directory[EB/OL].(2019-10-18)[2021-03-21].http://dataminer2.pjm.com/feed/ ancillary_services/definition.
Fluctuation analysis and risk measurement of electricity pricing using TGARCH and VineCopula
XIE Hang1, LAI Chunyang1, ZENG Hong1, MA Guangwen1, CHEN Shijun1, 2,WANG Jianhua3
(1.College of Water Resources and Hydropower/State Key Laboratory of Hydraulics and Mountain River Engineering, Sichuan University, Chengdu 610065, China; 2.Business School, Sichuan University, Chengdu 610065, China; 3.Dadu River Company, China Energy Corporation, Chengdu 610041, China)
In a market-oriented transaction, risk measurement of electricity price fluctuation contributes to conduct risk management for market stakeholders.This paper proposes a new method for analyzing electricity price fluctuation and measure risk.It combines TGARCH and Vinecopula.This method applies TGARCH to establish the margin distribution of day-ahead, real-time and ancillary service transaction electricity prices, and uses Vinecopula to fit the multi-dimensional dependent structure of each transaction electricity price.Based on the Kendall rank correlation and tail correlation calculated from the method, the dynamic fluctuation characteristic between each transaction price is analyzed, and its risk is measured.Empirical analysis shows that this method can not only capture the change of price fluctuation under the combined action of load/capacity ratio and renewable energy penetration rate, but can also accurately describe the nonlinear correlation structure of each transaction price.This can capture the dynamic fluctuation characteristics of day-ahead, real-time and ancillary service transaction price.Also, it can more effectively reduce portfolio volatility risk in comparison to other methods.This work is supported by the National Key Research and Development Program of China (No.2018YFB0905204).
analysis of electricity price; TGARCH; VineCopula; risk measurement
10.19783/j.cnki.pspc.210504
2021-04-29;
2021-07-02
谢 航(1996—),女,硕士研究生,研究方向为水电运行管理及电力市场;E-mail: 409367753@qq.com
王建华(1973—),男,通信作者,高级工程师,研究方向为电力市场。E-mail: 1294331990@qq.com
国家重点研发计划项目资助(2018YFB0905204)
(编辑 葛艳娜)
猜你喜欢
数学小灵通·3-4年级(2024年2期)2024-05-15 02:02:44
数学年刊A辑(中文版)(2022年4期)2022-02-16 08:18:02
数学年刊A辑(中文版)(2019年3期)2019-10-08 07:34:38
今日农业(2019年12期)2019-08-13 00:50:14
文学少年(原创儿童文学)(2019年1期)2019-05-23 09:37:26
中国化肥信息(2019年3期)2019-04-25 01:56:16
能源(2018年10期)2018-12-08 08:02:40
商周刊(2018年16期)2018-08-14 01:51:52
环境保护与循环经济(2017年2期)2017-09-26 11:52:16
当代经济(2016年26期)2016-06-15 20:27:19