Assessment of macular vascular network after panretinal photocoagulation in the patients with diabetic retinopathy by OCTA
Department of Ophthalmology, the First Affiliated Hospital of Nanjing Medical University (Jiangsu Province Hospital), Nanjing 210029, Jiangsu Province, China
Abstract
• KEYWORDS:panretinal photocoagulation; macular vascular density; foveal avascular zone; diabetic retinopathy; optical coherence tomography angiography (OCTA)
INTRODUCTION
Diabetic retinopathy (DR) is a common microvascular complication of diabetes, and remains the leading cause of blindness in working-aged people. Clinically, DR is divided into non-proliferative DR (NPDR) and proliferative DR (PDR), which is marked by the appearance of retinal neovascularization[1]. Panretinal photocoagulation (PRP) has been a standard treatment for PDR since the advent of ophthalmic lasers. The aim of PRP is to cause regression of retinal neovascularization in retina, reduce the risk of vitreous hemorrhage, tractional retinal detachment and thereby prevent the progression of visual loss[2]. Although PRP has been widely used in clinic, its mechanism is not very clear. The main hypothesis of the mechanism for PRP is that the PRP damages some of the highly metabolically photoreceptors, which consume lots of oxygen[3]. This process may improve the oxygen supply to the inner retina, and reach a new balance between oxygen supply and demand, to reduce the stimulus for neovascularization. Besides, the decreased area of retinal tissue leads to improved oxygenation and a reduction in the levels of vascular endothelial growth factor (VEGF). A reduction in levels of VEGF may be important in reducing the risk of harmful new vessels forming.
Previous studies have investigated the change of ocular circulation after PRP and reported PRP reduces retinal blood flow[4]. However, these studies concentrated on blood flow of whole retina rather than macula, which is more important and particular for the maintenance of visual function. According to our expectation, when the laser was placed on the peripheral parts of retina, it would cause thermal damage to outer retinal tissues, and blood will be distributed from periphery to macula region. It means although blood flow decreases in whole retina, the blood flow to macula may increase after PRP.
Optical coherence tomography angiography (OCTA) is a new, noninvasive imaging technique that generates real-time data on vascular structures of eye without intravenous injection of fluorescent dyes. Foveal avascular zone (FAZ) is a capillary-free area surrounded by separation of inner retinal layers. It is highly sensitive to ischemic events and can be an indicator of several pathologic processes. We can get information of individual layers and different parts of retina by OCTA which also becomes a new tool for follow-up observation of changes in FAZ[5]. At present, the FAZ has always been measured as a 2D area based on OCTA en face images at the level of superficial plexus and deep plexus. However, as a 3D structure, it is incomplete to measure the FAZ using 2D en face images. To improve the measure method, we have established a new clinical evaluation index, FAZ volume, to quantify the FAZ in a 3D manner[6]. According to our previous research, the FAZ volume showed consistency with the FAZ area, but more sensitive in describing the foveal vascular alteration no matter in neither myopia group nor DR group[6]. This study aims to evaluate not only the changes of macular vascular density and FAZ between healthy eyes and severe non-proliferative diabetic retinopathy (S-NPDR) eyes, but also the short-term (1mo), medium-term (3mo) and long-term (6mo) post-PRP development of macular vascular density and FAZ in patients with S-NPDR.
SUBJECTS AND METHODS
DesignandPopulationThe study followed the tenets of the Declaration of Helsinki, and was approved by the Ethics Committee of First Affiliated Hospital of Nanjing Medical University (No.2020-SR-269). All participants or guardians were informed consent. And all participants were not involved in the design, or conduct, or reporting, or dissemination plans of our research. This study prospectively analyzed patients with S-NPDR who had recently received PRP in the First Affiliated Hospital of Nanjing Medical University. The S-NPDR patients who were ready to receive PRP and age-matched healthy subjects were included in the study. All participants or guardians were informed consent. And all participants were not involved in the design, or conduct, or reporting, or dissemination plans of our research.
The inclusion criteriaof healthy group: 1) Aged 45-65; 2) -2.0 D ≤spherical equivalent (SE) ≤ 2.0 D; 3) Intraocular pressure (IOP) ≤21 mmHg and without eye diseases (such as glaucoma and fundus disease); 4) Without ophthalmic surgery and trauma history; 5) Without diabetes. Inclusion criteria of S-NPDR subjects: 1) Diagnosed as S-NPDR by two experienced ophthalmologists respectively according to the classification of DR defined by Early Treatment Diabetic Retinopathy Study (ETDRS); 2) Underwent PRP and were followed at least 6mo; 3) Without ocular disease history which affects retina and choroid such as vascular occlusion, retinal neovascularization, inflammatory disease, glaucoma, or trauma; 4) Without previous vitreous surgery , anti-VEGF or photocoagulation before this study and without any additional therapy including macular photocoagulation or anti-VEGF during the study; 5) Without clinically significant macular edema; 6) Without corneal opacity, severe cataract, that could influence image quality. Fluorescein angiography (FA) and fundus photo were performed before PRP. Slit-lamp biomicroscopy, Goldmann applanation tonometry and OCTA were performed between 2 and 5 p.m. at every follow-up.
PanretinalPhotocoagulationTreatmentOn the basis of the recommendations of ETDRS, PRP was applied in 4 peripheral quadrants in 2-4 sessions by an experienced ophthalmologist who was unaware of the study design. All photocoagulation sessions were performed with an interval of 1wk. A total of 1 200 to 2 000 spots were applied per eye with the spot size of 200-500 μm and pulse duration of 0.2s.

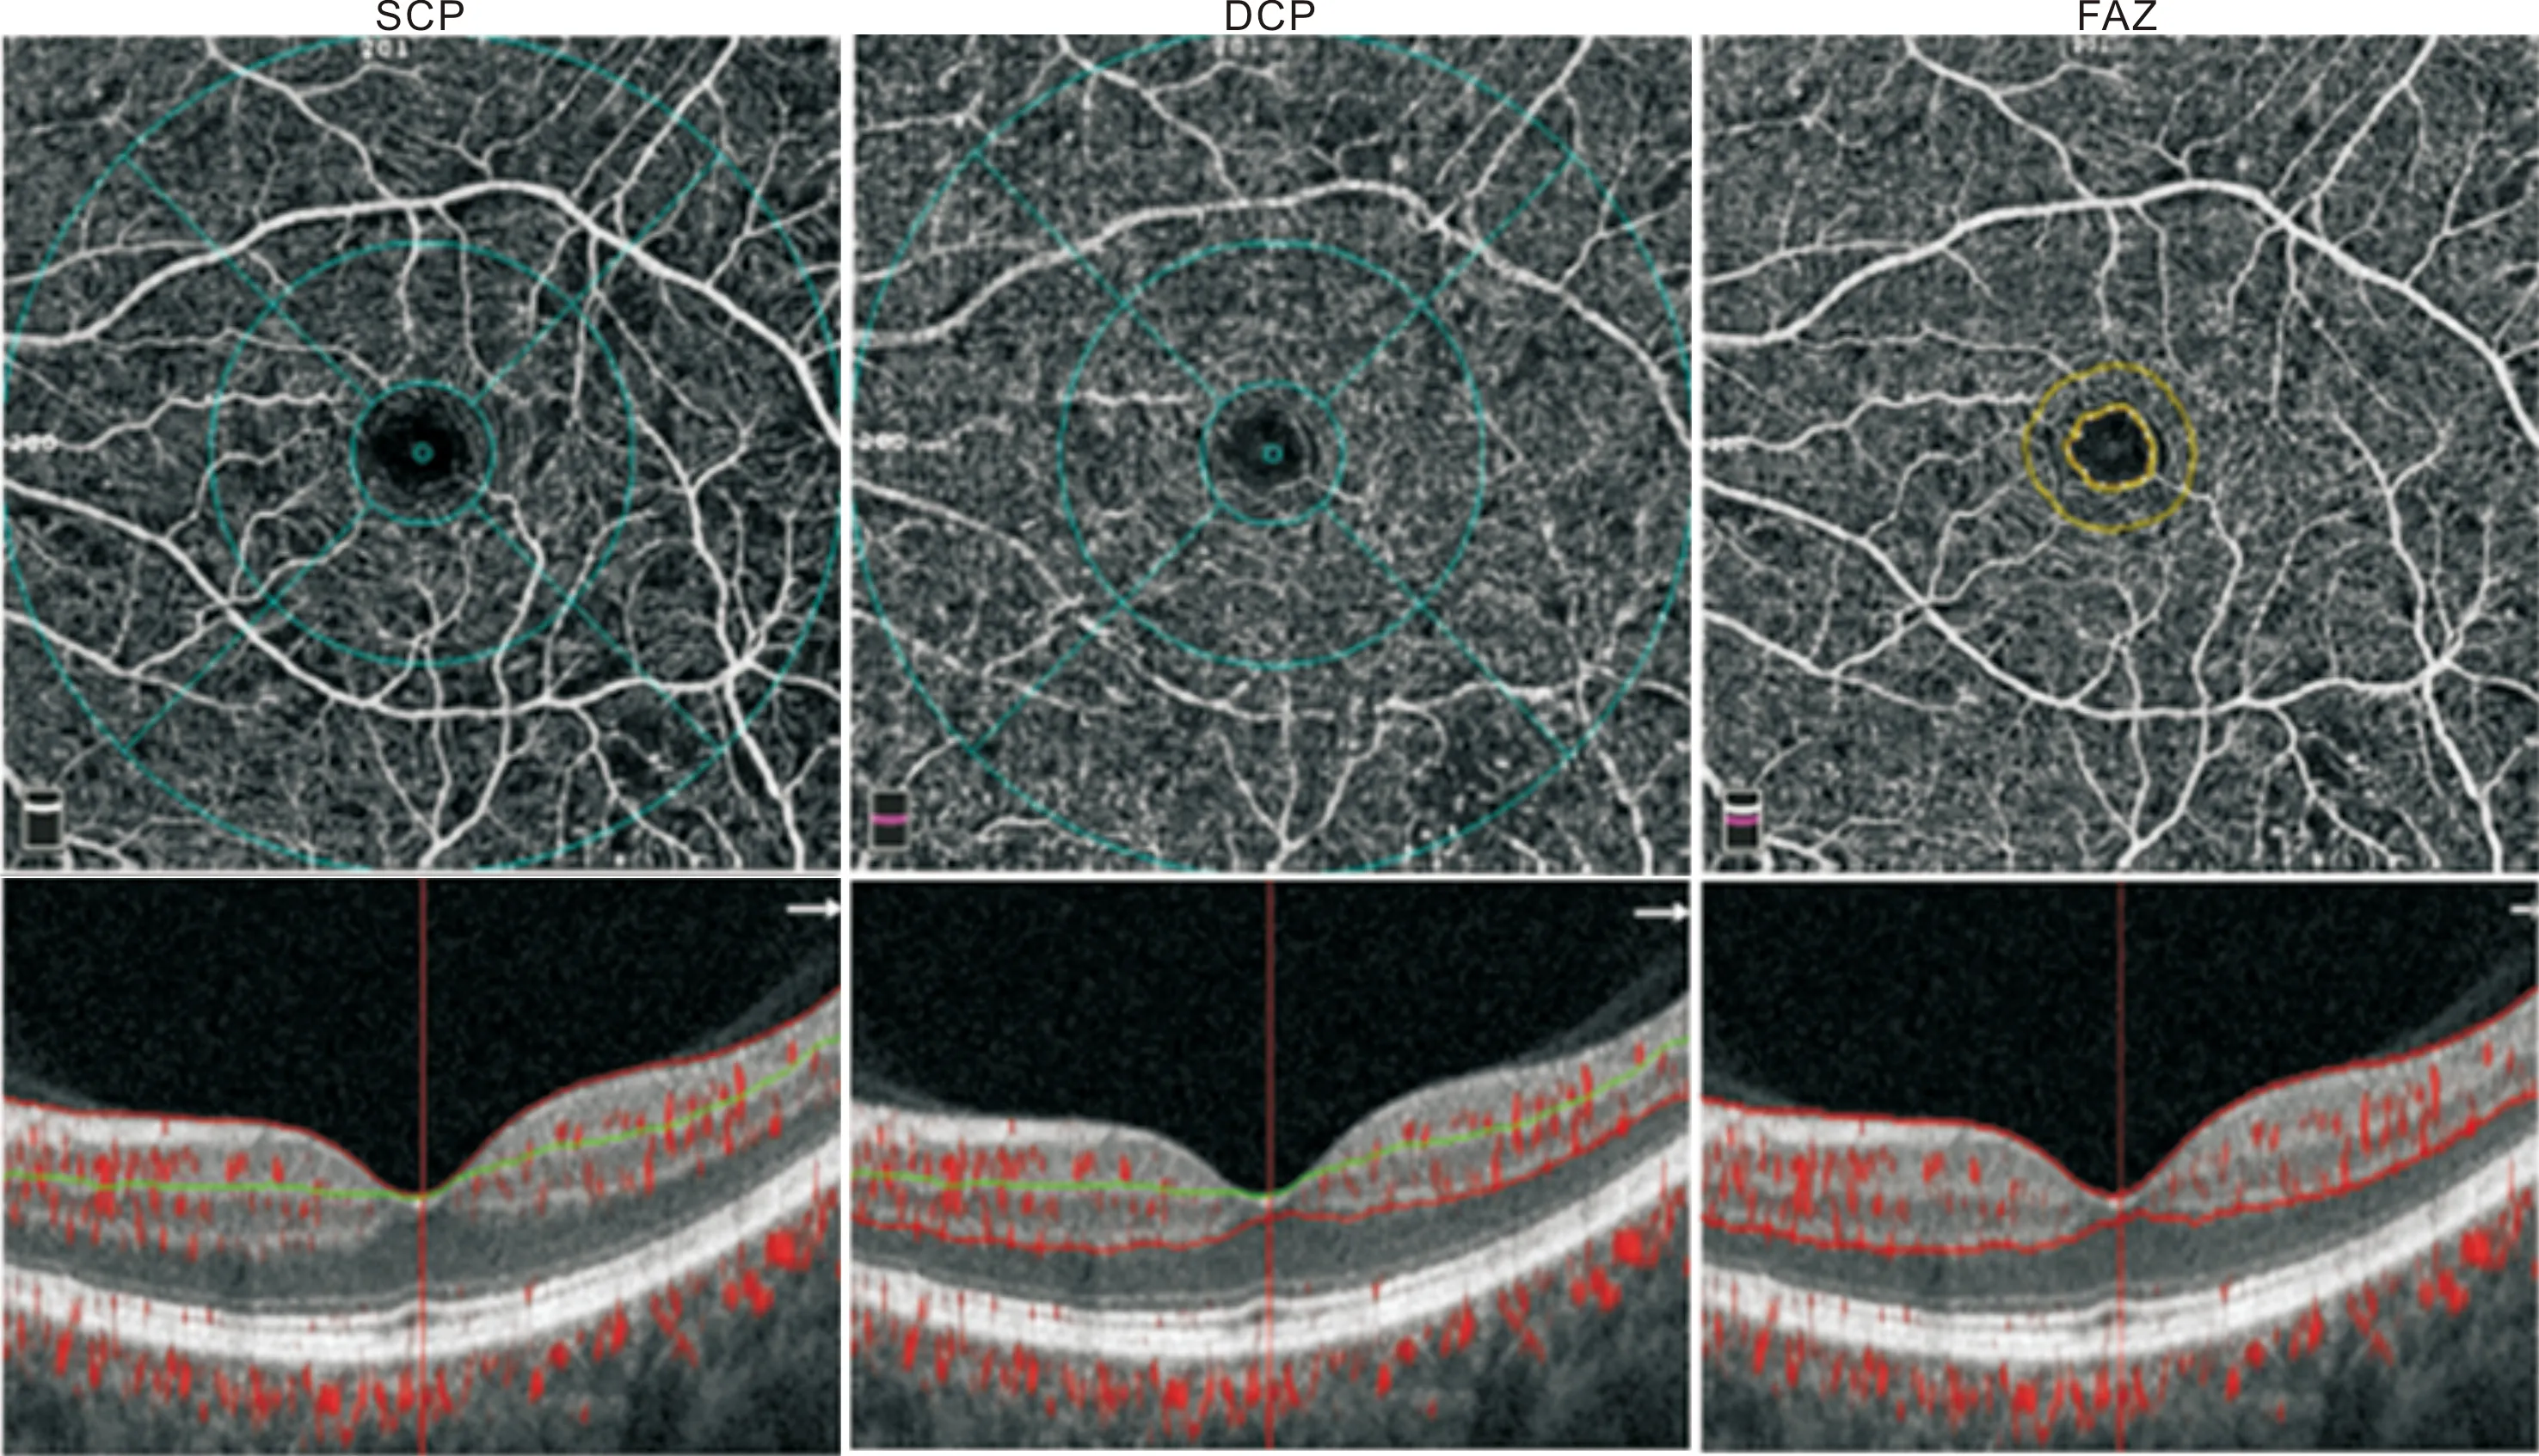
Figure 1 The segmentation of retina en face OCTA image of SCP (left), DCP (middle) and FAZ (right) of an S-NPDR eye Segmentation boundaries are shown below on cross-sectional OCT. Macular vascular density was separately calculated in three regions. Fovea region: 1 mm diameter circle centered on the avascular zone; Parafovea region: An annular area centered on the avascular zone with an inner diameter of 1 mm and an outer diameter of 3 mm; Perifovea region: An annular area from the outside of parafoveal region to 6 mm diameter circle.

Table 1 Clinical characteristic of patients at baseline
OpticalCoherenceTomographyAngiographyOCTA scans were obtained using AngioVue with the angio retina mode (6×6 mm). Automatic segmentation was performed by the viewing software to generate en face projection images of the superficial retinal capillary plexus (SCP), deep retinal capillary plexus (DCP). The SCP is segmented from inner internal limiting membrane to 9 μm above lower boundary of inner plexiform layer. The DCP is segmented from 9 μm above inner plexiform layer to 9 μm below lower boundary of outer plexiform layer (Figure 1). Manual adjustments were performed to segment retina and edge FAZ in every image. Low-quality images with signal strength index <60, images with severe artifacts, or undetectable images which is difficult to figure were excluded in the analysis. Angiography information calculated by embedded software in the machine comprises the FAZ area and the vascular density of SCP and DCP which was defined as the percentage area occupied by vessels. Briefly, the FAZ volume was counted with restored labeled pixels by flatting and annotating axially the region according to our previous report[6]. All OCTA examinations were performed by the well-trained studier.
StatisticalAnalysisStatistical analyses were performed with SPSS 21 (SPSS, Inc., Chicago, IL, USA). Quantitative variables were tested with Kolmogorov-Smirnov to determine normality. To address the inter-eye correlation, a generalized estimating equation (GEE) model was used. AP-value less than 0.05 was considered statistically significant.
RESULTS
PatientDemographicsA total of 80 eyes were recruited in our study, and 18 of these eyes were excluded because of poor image quality, wrong segmentation of retina or emergence of macular edema. Demographic and anatomic characteristics of patients included in this study are summarized in Table 1. In S-NPDR eyes which received PRP, mean LogMAR BCVA at baseline (0.4±0.2) showed no significant change (P=0.6)with the last visit after PRP (0.4±0.1). Mean HbA1c at baseline was 5.6±1.2%, which also had no significant change to 5.4±1.4% at the last visit (P=0.5).

Table 2 The difference of vascular density, FAZ area and FAZ volume between healthy eyes and S-NPDR eyes before PRP

Table 3 Changes of vascular density, FAZ area and FAZ volume in S-NPDR eyes following PRP
MacularVascularDensity,FAZAreaandFAZVolumeinNormalEyesandS-NPDREyesBeforePRPCompared to healthy control eyes, S-NPDR eyes showed declined vascular density in whole, foveal, parafoveal and perifoveal DCP (allP<0.001, except in foveaP=0.008). Although the foveal vascular density of SCP in S-NPDR group (17.60±7.10)% is lower than that in control group (16.99±6.09)%, this change wasn’t statically significant (P=0.7). Unlike foveal vascular density of SCP, whole, parafoveal and perifoveal vascular density of SCP were decreased significantly in S-NPDR eyes (allP<0.001). Consistent with our previous research, both FAZ area and volume expanded respectively from 0.309±0.11 mm2to 0.364±0.10 mm2and from 0.024±0.006 mm3to 0.038±0.010 mm3in S-NPDR eyes contrasted with control eyes (P=0.04 andP<0.001, respectively). Detailed data are shown in Table 2.
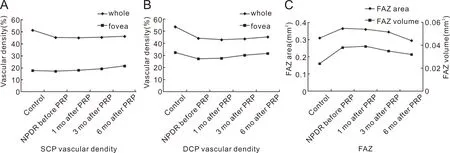
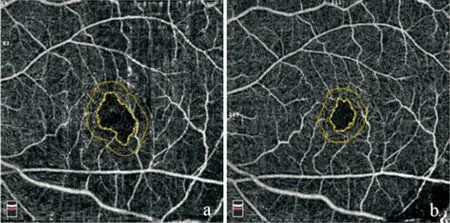
MacularVascularDensity,FAZAreaandFAZVolumeBeforePRPandat1, 3and6moafterPRPFoveal vascular density in the SCP was increased after PRP, however only at 6mo after RPR the increase is statistically significant (P0-1= 0.86,P0-3= 0.44,P0-6= 0.006). Foveal vascular density in the DCP ascended at 3 and 6mo significantly after PRP, while at 1mo after PRP there is no obviously ascending trend (P0-1= 0.57,P0-3= 0.04,P0-6= 0.008). As for the whole, parafoveal and perifoveal vascular density in the SCP and DCP, none significant change was found neither at 1mo past-PRP nor at 3 or 6mo past-PRP (allP>0.05). FAZ area constricted following PRP, which diminished in size from 0.364±0.10 mm2before PRP to 0.359±0.12 mm2at 1mo post-PRP, to 0.344±0.11 mm2at 3mo post-PRP and to 0.294±0.07 mm2at 6mo post-PRP, but only the constriction at 6mo after PRP demonstrated a statistical significance (P0-1= 0.88,P0-3= 0.60,P0-6= 0.04). Similar to FAZ area, FAZ volume was decreased following PRP from 0.038±0.010 mm3before PRP to 0.039±0.007 mm3at 1mo post-PRP, to 0.035±0.009 mm3at 3mo post-PRP and to 0.032±0.007 mm3at 6mo post-PRP, but only the decrease at 6mo after PRP is statically significant (P0-1= 0.75,P0-3= 0.27,P0-6= 0.03). Detailed data are shown in Table 3 and the trends of macular vascular density, FAZ area and FAZ volume are illustrated in Figure 2. Figure 3 shows the OCTA images of FAZ area before and after PRP.

Figure 2 The trend of vascular density (A: SCP; B: DCP), FAZ area (C) and FAZ volume (C) in normal eyes, S-NPDR eyes before PRP and S-NPDR eyes after PRP.

Figure 3 The FAZ area outlined before (a) and 6mo after (b) PRP.
DISCUSSION
In this prospective study, we discovered that S-NPDR eyes showed a significant decrease of macular vascular density except foveal vascular density of SCP as well as a significant increase of FAZ area and volume, compared to control eyes. In S-NPDR eyes treated with PRP, vascular density only changed in fovea. Three months after PRP, the vascular density in fovea of DCP first augmented, and 6mo after PRP, the vascular density in fovea of SCP and DCP both augmented. Besides, FAZ area and volume constricted at long-term (6mo) following PRP.
Consistent with previous studies[7-8], our results showed whole, parafovea and perifovea vascular density descended in SCP and DCP in S-NPDR eyes. It should be noted, however, this change was less remarkable in fovea, especially in foveal SCP. Perhaps it is because DR affects the peripheral retina first, and fovea is damaged in the last stage[9]. Another possibility is that relatively preserved fovea vascular density helps to maintain visual acuity and it may be a self-protective mechanism of retina[9]. Of course, there is another possibility that fovea has fewer capillary than parafovea and perifovea, so the change of vascular density is not obvious[9]. Besides, we had an unexpected finding that DCP density displayed more significant decrease than SCP density in fovea. So far OCTA examinations have been performed on various layers of the retina of DR patients. In the early stage of DR, SCP showed high flow and DCP presented a steep decline of blood flow with exacerbating DR severity[7,10-11]. Thus, compared with SCP, blood flow of DCP declined more steeply with the aggravation of DR. These findings coincide with our result of fovea vascular density decreased only in DCP. One possible explanation is that SCP retains a certain degree of self-regulation function compared to DCP with the progress of DR, and another possible explanation is that the dilated capillaries of SCP, which have increased blood flow and decreased vascular resistance, may contribute a steal phenomenon at DCP[12].
In our study, vascular density in the foveal region at both superficial and especially deep levels increased in long-term follow-ups after treatment. Some studies have suggested the occurrence of capillary revascularization and reversible perfused in fovea in eyes with advanced DR after extensive photocoagulation, and DCP is more susceptible to PRP[12-15]. In addition to redistribution of the circulation, PRP induced inflammation, causing inducible nitric oxide synthase expression and production, could be a trigger. We speculate that PRP induced transient short-term (1mo post-PRP) VEGF over-expression and better oxygenation of the retina in the long term (6mo post-PRP) after PRP resulting reduction in VEGF production, and the reperfusion of the occluded vessels after PRP due to inflammatory mediators and nitric oxide overproduction, which makes these vessels more detectable with OCTA[16-17]. Besides, as we have mentioned before, many previous studies have proposed microvascular changes occur at DCP earlier than SCP in DR[7,10-11]. Previous studies together with our observations suggest a role of DCP in evaluating therapeutic effect and DR progression.
Furthermore, FAZ enlargement in DR caused by capillary alteration has already been confirmed through OCTA and FA and it is in line with our finding[18-19]. Capillary occlusion due to hyperglycemia-induced microangiopathy might be the primary etiology for FAZ enlargement in patients with DR[20]. Therefore, alterations to the FAZ area could be an important marker for macular microvascular status monitoring before or after treatment in patients with DR[21-22]. However, as a 3D structure, FAZ volume is more appropriate to describe the status of FAZ instated of FAZ area which is a 2D en face image. That could be a reason why several studies revealed merely marginally constriction in FAZ area following PRP[17,21-22]. Through statistical collection and analysis, we discovered that FAZ volume could be more sensitive for vascular structure alteration of DR eyes[6]. Hence, FAZ area and volume, especially FAZ volume, may be markers for monitoring the long-term (6mo) effect of PRP in DR.
Before our study, Fawzietal[23]reported 10 eyes of DR and found vascular density decreased only in middle capillary plexuses which are located between SCP and DCP after PRP. But they only studied whole en face vascular density of retina and ignore different change in different region of macula and FAZ area. Recently, Lorussoetal[24]investigated the short- and long-term effects of PRP on macular perfusion based on OCTA imaging. In contrast to our results, they did not observe any changes in the vascular density and FAZ area. The use of frequency-doubled Nd∶YAG pattern scan laser in the mentioned study instead of the conventional argon laser PRP employed in the present work might be the cause of this difference. As shown previously, the short-pulse laser delivery system results in less-destructive and possibly less anti-ischemic effects at the molecular level. The latest research conducted by Faghihietal[21]indicated in both the short- (1mo) and long-term (6mo) periods after PRP, vascular density in the foveal region did not change statistically significant although a trend to increasing vascular density in the foveal region was shown, both in the SCP and DCP. On account of the decrease of macular vascular density observed in patients with macular edema[25-26], clinical or subclinical macular edema caused by PRP treatment could be responsible for the lack of statistical significance, despite with the increasing trend. Basis on the fact that macular vascular density of SCP and DCP increased progressively across the next 12mo after PRP, with significant differences[27], obvious trend could appear in the further follow-up.
There are several limitations in this study. Its major drawbacks are the relatively small sample size and lack of control group which prevents us from making a firm conclusion regarding the association between alterations of macular vascular density, FAZ area and FAZ volume and PRP treatment. Another limitation is that not all of the artifacts and segmentation errors can be avoided by OCTA software, particularly in eyes with poor vision. To reduce these errors, we excluded images with signal strength index <60 and performed manual correction of the segmentation of retina in every image by a well-trained ophthalmologist. Then, images were checked by another two ophthalmologists, only when both of them agreed the segmentation, can an image be used in analysis. Yet another drawback is the lack of considerations of other foveal area hemodynamic parameters such as subfoveal choroidal thickness and fractal dimensions. In summary, macular vascular density, FAZ area and FAZ volume could be markers for estimating S-NPDR. These OCTA parameters were not significantly affected by PRP during short- (1mo) and medium (3mo) follow-ups, however at long-term (6mo) follow-up, these parameters became significant after PRP possibly due to the reflow of the occluded capillary plexus. Further investigations are necessary to clarify and solidify our findings.

