Glycine-derived nitrogen-doped ordered mesoporous carbons with a bimodal mesopore size distribution for supercapacitors and oxygen reduction
SHAO Ying, HU Ze-yu, YAO Yan, WEI Xiang-ru, GAO Xing-min, WU Zhang-xiong
(Particle Engineering Laboratory, School of Chemical and Environmental Engineering, College of Chemistry, Chemical Engineering and Materials Science, Soochow University, Suzhou 215123, China)
Abstract: Nitrogen-doped carbon materials are promising for electrochemical energy storage and conversion.Dopant control and pore engineering play important roles in improving their performance.We have synthesized nitrogen-doped ordered mesoporous carbons (N-OMCs) with a bimodal mesopore size distribution using a solvent-free nanocasting method.The simplest amino acid (glycine, Gly) was used as the only carbon precursor and ordered mesoporous silica SBA-15 as the hard template.The confined pyrolysis of Gly in SBA-15 leads to efficient carbonization, nitrogen doping and an interesting structure.The N-OMCs have high surface areas (923-1 374 m2·g−1), large pore volumes (1.32-2.21 cm3·g−1), a bimodal distribution of mesopore sizes (4.8 and 6.2-20 nm) and high nitrogen contents (3.66%-12.23%).The effects of the Gly/SBA-15 mass ratio (1-3) and carbonization temperature (700-1 000 °C) on the physicochemical properties of the N-OMCs were studied.When used as electrode materials the N-OMCs have a high performance in supercapacitors.A typical sample has a large specific capacitance of 298 F·g−1, a good rate capability (70% retention at 30 A·g−1) and high stability.The different capacitances and rate capabilities of the N-OMCs are discussed by correlating them with their physicochemical properties.A balance of surface area, degree of graphitization, nitrogen doping, and an open mesoporous structure is essential to achieve the best performance.The N-OMCs also have a good performance in the electrocatalytic oxygen reduction reaction.A typical sample has a high onset of 0.92 V, a high half-wave potential of 0.83 V and a large limiting current density of 5.06 mA·cm−2.
Key words: Mesoporous carbon;Nanocasting;Nitrogen doping;Glycine;Supercapacitor;Oxygen reduction
1 Introduction
Ordered mesoporous carbons (OMCs) have controllable structures, uniform mesopore sizes, high surface areas, excellent thermal stability, high electronic conductivity, and so on.These features make them applicable in energy storage and conversion, adsorption and catalysis.Pore structure engineering is an effective approach to improve their performance.For example, in supercapacitor, hierarchical and ordered mesoporous structures can provide high surface areas and shorten molecular diffusion paths, which make them have large power densities and high rate capabilities.For another example, in oxygen reduction reaction (ORR), mesoporous structures and multimodal pores can greatly improve mass transfer to boost the performance.Heteroatom doping is another effective approach to enhance their performance.For example, the incorporation of nitrogen (N), oxygen (O), sulfur (S), phosphorus (P) or boron (B) into porous carbon materials can effectively enhance their electrochemical performance.This is because doping of these heteroatoms may improve electrolyte infiltration, enhance electron transfer, and create active sites for charge storage and oxygen reduction.Therefore, controllable synthesis of OMCs with unique pore structures and high heteroatom contents is an important task.
OMCs can be prepared using soft or hard templating methods with ordered mesoporous silicas or amphiphilic surfactants as the templates.In the cases of creating disordered mesoporous carbons, the templates can be extended to many other inorganicmaterials, such as ZnO, MgO and so on.These templating methods have led to great progresses in the area of porous carbon materials and their applications.However, the templating methods commonly require multiple synthetic steps.In particular, large amounts of solvents are required to make the organic precursors pre-confined or pre-arranged around suitable templates, followed by drying and carbonization.In order to simplify the synthesis, solvent-free methods have been proposed.Sun and Dai’s groups have developed the solvent-free soft templating method.Our group have developed the solvent-free hard templating (nanocasting) method.By using these solvent-free methods, various OMCs, and heteroatom and/or metal-doped OMCs have been reported.However, compared with the wet synthesis methods,the control of morphology, pore structure and heteroatom doping in the solvent-free methods are relatively immature.
Among various dopants, nitrogen doping in porous carbon materials has attracted the most research interest.Nitrogen can be incorporated into carbon materials by in-situ or post doping methods.The in-situ method is widely used because of its simplicity and more uniform doping.For in-situ doping, the use of a single precursor that carries a high nitrogen content and can easily undergo polymerization and carbonization with high yields is preferable.Amino acids are relatively cheap and non-toxic, and they contain various functional groups such as amino and carboxyl.Among many types of amino acids, glycine (Gly) is the simplest one.It is plentiful and has a high carbon/nitrogen (N/C) atomic ratio.It has indeed been adopted as a precursor for the synthesis of several porous carbon materials.For example, Cai et al.reported the synthesis of aerogel-like nitrogen-doped carbon from Gly using molten salt templating.Zhu et al reported the synthesis of nitrogen-doped carbons from Gly and Mg(NO)using solution combustion synthesis.Kim et al reported the synthesis of hierarchically porous carbon microspheres from Gly using spray pyrolysis.However, the pore structures in the materials obtained in these reports are disordered.An in-depth study on the synthesis of OMCs from Gly is limited.
In this work, we propose the synthesis of highly nitrogen-doped OMCs (N-OMCs) from Gly using the facile solvent-free nanocasting method.This method relies on melting infiltration for precursor loading.Its advantages include high precursor filling degrees inside the template, simplification of the synthesis and avoidance of solvents for precursor loading.In our previous works, we adopted histidine as the precursor for the synthesis of several N-OMCs and metal-doped N-OMCs for oxygen reduction and catalytic hydrogenation.Herein, we present a detailed research on the synthesis of N-OMCs from the simplest amino acid (Gly) and their performance in supercapacitor and ORR.The work demonstrates how N-OMCs can be prepared from Gly with high yields and attractive properties.The influences of several experimental factors on the properties of the resulted N-OMCs are studied.The N-OMCs show high performance in supercapacitor and ORR.The influences of the physicochemical properties of the N-OMCs on their performance are discussed.
2 Experimental
2.1 Chemicals and materials
Tetraethoxysilane (TEOS, analytic grade (AR)),hydrochloric acid (HCl, 37%), ethanol (AR), hydrofluoric acid (HF, 40%), potassium hydroxide (KOH,AR) and ammonia (NH·HO, 28%) were obtained from Sinopharm Chemical Reagent Co., Ltd.The triblock copolymer Pluronic P123 (= 5 800,EOPOEO) and the amino acid glycine (Gly,CHNO, ≥ 99%) were purchased from Sigma-Aldrich.The Ngas (99.999%) was purchased from Wujiang Messer Industrial Gas Co., Ltd.The polytetrafluorethylene (PTFE) solution (-(CF-CF)-, 60%)was purchased from J&K.Acetylene black (≥ 99%)was purchased from Alfa Aesar Co., Ltd.
2.2 Synthesis of the N-OMCs
The ordered mesoporous silica SBA-15 was prepared with P123 as the soft template and TEOS as the silica source according to the reported procedure.To prepare the N-OMCs, SBA-15 was used as the hard template, and Gly as the single precursor.The facile solid nanocasting method was adopted for the synthesis.The typical process is as follows.SBA-15 was pre-dried at 60 °C under vacuum overnight.It was then gently ground with Gly in a mortar for 5 min.The Gly/SBA-15 mass ratio was adjusted(1∶1, 1.5∶1, 2∶1, 2.5∶1 and 3∶1).The mixed powder was heated to 700-1 000 °C under a Nflow(60 mL·min) with a heating rate of 2 °C·minand kept isothermal at the target temperature for 3 h for carbonization.The obtained composites were soaked in a 10% HF solution (with an excessive amount) for 24 h to remove the silica template.After that, filtration, washing with water and ethanol and dying at 60 °C under vacuum were conducted in sequence.The final samples were donated as N-OMC-Gly-x-y,wherein x stands for Gly/SBA-15 mass ratio and y for the carbonization temperature, respectively.
2.3 Characterization and measurement
Small- and wide-angle X-ray diffraction (XRD)patterns were recorded on a Bruker D2 Phaser diffractometer fitted with the Cuα radiation source(= 0.154 nm) with a voltage of 30 kV and a current of 10 mA.Scanning electron microscope (SEM) images were recorded on Hitachi microscopes (S4700 and SU8010) at 15 kV.Transmission electron microscopy (TEM) measurement was performed on FEI Tecnai microscopes (G20 and F20) at 200 kV.The Nadsorption-desorption isotherms were acquired on a BEL sorp-max (MicrotracBEL) analyzer.Before the measurement, the samples were degassed under high vacuum at 180 °C for at least 6 h before analysis at−196 °C.The Brunauer-Emmett-Teller (BET) method was used for the calculation of the specific surface area using the adsorption data at a/range from 0.035 to 0.20.The Barrett-Joyner-Halenda (BJH)method was used to calculate the pore size distribution curves from the adsorption branches.The-plot method with the de-Boer model for thickness calculation was used for evaluation of the micropore surface area and micropore volume.Raman spectra were measured using a Renishaw UV-1000 Photon Design spectrometer.The elemental analysis was conducted on a Vario Micro cube analyzer, and the element contents were quantitatively analyzed using the CHN mode.Before testing, the samples were pretreated overnight at 100 °C under vacuum to remove the adsorbed HO and other gaseous impurities.X-ray photoelectron spectra (XPS) were recorded using the Thermo Fisher ESCALAB 250Xi spectrometer calibrated with C 1s at 284.6 eV.Thermogravimetric (TG)analyses were conducted on a Mettler Toledo TGA/DSC 3+ analyzer from 30 to 900 °C (10 °C·min) under flowing N(50 mL·min).
2.4 Electrochemical tests
The electrochemical tests for evaluating the supercapacitor performance were performed at room temperature on the CHI760e electrochemical workstation (Shanghai Chenhua, China).The cyclic voltammetry (CV), galvanostatic charge and discharge and electrochemical impedance spectroscopy (EIS) were carried out in a standard three-electrode system.In the measurement, a Pt plate was used as the counter electrode, and a Hg/HgO electrode was served as the reference electrode.The potential range was 0 to −1.0 V(vs.Hg/HgO) and the electrolyte was a 6.0 mol·LKOH solution.The working electrode was prepared from a mixture of an active material, a conductive agent (acetylene black) and a binder (PTFE) with the mass ratio of 8∶1∶1.The working electrode was prepared as follows.First, PTFE was ultrasonically dispersed in 2.5 mL of ethanol for 10 min, followed by the addition of a certain active material and acetylene black.The mixture was further ultrasonicated for 20 min to obtain a uniform suspension.Then, the suspension of was dried at 80 °C for 1 h to volatilize ethanol.The dried black powder was pressed onto a neat nickel-foam to obtain a thin electrode membrane,which was dried overnight at 80 °C.The specific capacitance (, F·g) of the samples was calculated using the following equation,

wherestands for the current density (A·g), Δfor the discharging time (s), Δfor the potential range in volt andfor the mass (g) of the active material, re-spectively.
The electrochemical tests for evaluating the ORR performance were tested in a three-electrode cell at 25 °C.A glassy carbon rotating disk electrode (5.0 mm in diameter) was used as the working electrode, a platinum plate as the counter electrode and a saturated Ag/AgCl electrode as the reference electrode.The electrolyte was a 0.1 mol·LKOH solution.The working electrode was prepared according to the following procedure.2.0 mg of a specific sample was mixed with water (350 μL), iso-propanol (140 μL) and Nafion (5%, 10 μL), followed by ultrasonication in an ice water bath for 40 min.Then, 30 μL of the ink was coated on the glassy carbon electrode and dried naturally.Before the ORR measurement, the working electrode was activated by over 20 cycles of CV scan(100 mV·s) at −0.9 to 0.1 V (vs.Ag/AgCl) in the N-saturated electrolyte.Then, CV curves were recorded both in N-saturated and O-saturated electrolytes over a potential range of −0.9 to 0.1 V (vs.Ag/AgCl)with a scan rate of 20 mV·sand a rotation speed of 300 r·min.The linear sweep voltammetry (LSV)tests were performed in the O-saturated electrolyte over a voltage range of −0.8 to 0.2 V (vs.Ag/AgCl)with a scan rate of 5 mV·sat various rotation speeds(400-1 600 r·min).The polarization current values obtained in the O-saturated electrolyte were corrected by subtracting those tested under the N-saturated electrolyte.The reported potentials in ORR were aligned to the reversible hydrogen electrode (RHE).The overall electron transfer number () was derived according to the Koutecky-Levich (K-L) equations,

whereis the measured current density (mA·cm),is the kinetic current density andis the diffusionlimited current density,is the electrode rotation speed and 0.2 was adopted whenwas expressed in r·min,is the Faraday constant (96 485 C·mol),is the concentration of dissolved Oin 0.1 mol·LKOH (1.2 × 10mol·cm),is the diffusion coefficient of O(1.9 × 10cm·s), andis the kinetic viscosity of the solution (0.01 cm·s).
3 Results and discussion
3.1 Synthesis design and process
The nanocasting method is adopted to synthesize the N-OMCs because the confined pyrolysis is essential to promote carbonization of small organic molecules carrying high contents of oxygen and nitrogen.Conventionally, the nanocasting synthesis requires large amounts of water or organic solvents to load precursors into the templates.In this work, using the solvent-free nanocasting method, we present a detailed research on the synthesis of N-OMCs from Gly for the first time.Gly, its molecular structure shown in Fig.1a, has a carbon content of 32% and a nitrogen content of 18.7%.The synthesis process is illustrated in Fig.1.First, the two solids (SBA-15 and Gly) are gently ground in a mortar to obtain the Gly/SBA-15 mixture (Fig.1a).In this step, the Gly precursor may partially be driven into the mesopores because the grinding induces a thermal effect causing melting infiltration.Next, in the heating step, the Gly precursor can be fully driven into the mesopores near the melting point of Gly via capillary-induced melting infiltration (Fig.1b).Subsequently, the Gly precursor can be polymerized through chemical reactions between the amino and carboxyl groups (Fig.1c), andthe polymerized products (such as peptides) can be cyclized via dehydration.At higher temperatures,the polymerized and cyclized products can be condensed and carbonized to form the N-OMC@SBA-15 composite (Fig.1d).The carbonization is fully localized in the mesopores because of the confinement effect and the strong precursor-silica adhesive interactions.This can be confirmed by the SEM and TEM images of the N-OMC@SBA-15 composite showing no extra carbon products outside the mesopores (Fig.S1).Importantly, the carbon product inside the template has a special structure.According to our previous work, there are four structure models after the pyrolysis of amino acids in SBA-15 and the pyrolysis of Gly belongs to model (iii).Briefly, the cohesive forces among Gly molecules are stronger than the adhesive forces between Gly and silica.As a result,smooth nanowires inside the mesopores are formed at low temperatures (Fig.1b).As temperature increases,Gly starts to polymerize, cyclize and condense into carbonaceous intermediates which cannot migrate sufficiently to re-form smooth nanowires because of their weakened cohesive forces and their binding with silica inhibiting migration.In addition, pyrolysis of Gly leads to a dramatic mass loss with gaseous products released, which can create disordered pore voids.As a result, the smooth nanowires at the infiltration stage turn into discontinuous ones with disordered pore voids after carbonization (Fig.1d).The nanowires can still be interconnected because the small pores inside the silica walls allow infiltration of Gly and carbonization to form short carbon rods.Finally, after silica removal, nanowire arrays with bimodal mesopores can be obtained (Fig.1e).The ordered mesopores are originated from the silica walls and the disordered ones are from the pore voids inside the nanowires and their fused voids after the silica removal.
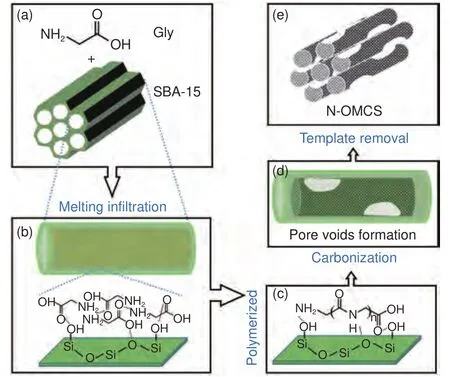
Fig.1 Schematic illustration of the synthesis process of the N-OMCs:(a) the molecular structure of Gly and structure model of SBA-15, (b) Gly in the mesopores loaded by melting infiltration and the molecular models of Gly cohesive forces and silica-Gly adhesive forces, (c) polymerized Gly binding with the silica surface, (d) carbon nanowires with pore voids inside the silica mesopores after carbonization and (e) structure model of the final N-OMCs after the silica removal.
In the synthesis, the confined pyrolysis of Gly is important to enhance the carbon yield.TG curves in Nreveal that the pure Gly has a yield of 20% at 900 °C, while Gly in the Gly/SBA-15 mixture possesses a higher yield of about 27% at the same temperature (Fig.S2).The yields under the TG conditions are higher than those (about 15% for pure Gly and 21% for Gly in Gly/SBA-15) obtained by carbonization in a tube furnace because of the shorter residence time in TG.Based on the carbonization yield(21% at 900 °C for 3 h), the carbon content (84.0%)from the elemental analysis and the theoretical carbon content (32.4%) in the Gly molecule, about 54.4% of the carbon atoms in Gly can be converted into carbon in the final sample.Two reasons can be used to explain the improved carbonization yield with the use of SBA-15.The first one is that there exists strong adhesive forces between silanol group and Gly or its pyrolytic species.Such interactions can inhibit precursor vaporization and promote polymerization and carbonization.The second one is that the tight mesopore space with Gly molecules tightly confined can also limit vaporization and promote carbonization.
3.2 Structural and morphological properties
The small-angle XRD pattern of SBA-15 shows the characteristic (100), (110) and (200) diffractions of an ordered hexagonal mesostructure (Fig.2a).All the N-OMCs obtained with different Gly/SBA-15 mass ratios and temperatures show lower structure orderings with only broad and weak (100) diffractions observed (Fig.2).This is mainly because of the decreased ordered domain sizes after structure replication and the presence of the disordered pore voids.The more sensitive small-angle X-ray scattering(SAXS) pattern confirms the emergence of the three diffractions in a typical sample (Fig.S3).The (100)diffractions of the N-OMCs shift to larger angles compared with that of SBA-15.This is caused by thermalshrinkage (thespacing shrunk by about 20%).As the Gly/SBA-15 mass ratio increases, the (100) diffraction of the resulted samples becomes better-resolved (Fig.2a), indicating that the structure replication is improved.This is because larger ordered domain sizes are replicated with more Gly carbonized in the template.In addition, the (100) diffraction shifts slightly to a lower angle with a higher Gly/SBA-15 mass ratio, indicating that the thermal shrinkage can be reduced with a higher Gly loading.On the other hand, with a fixed Gly/SBA-15 mass ratio of 2.5, the(100) diffractions of the resulted N-OMCs become less-resolved and shift to larger angles as the temperature increases (Fig.2b and Fig.S3).This is because a higher temperature induces a lower carbon yield (thus smaller ordered domain sizes) and a larger thermal shrinkage in the resulted sample.
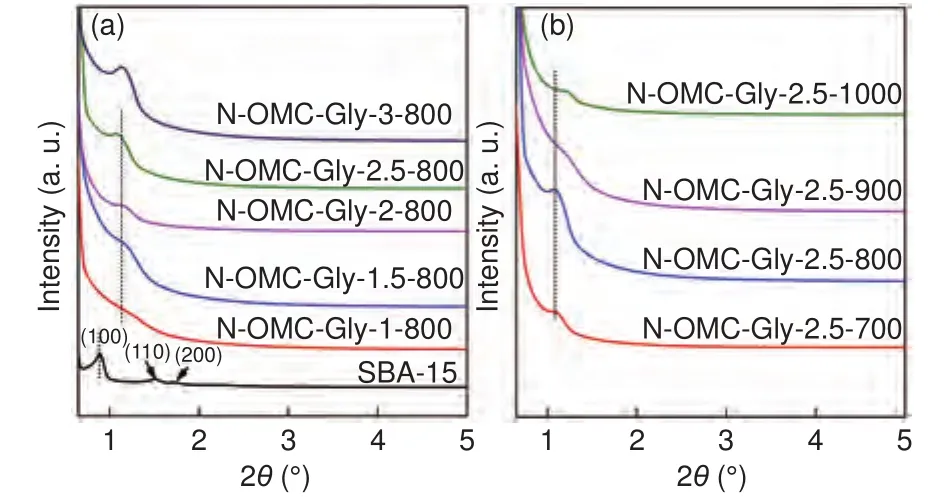
Fig.2 Small-angle XRD patterns of (a) the SBA-15 template and the NOMCs obtained with different Gly/SBA-15 mass ratios at 800 °C, and (b)the N-OMCs with a fixed Gly/SBA-15 mass ratio of 2.5 at different temperatures, respectively.
The wide-angle XRD patterns of the N-OMCs obtained at 700-1 000 °C show two broad diffractions at about 25° and 46° (Fig.3a), assigned to the(002) and (101) planes of graphitized carbon.The very broad diffractions indicate that the samples are partially graphitized with abundant structure defects.Thespacing is calculated to be about 0.36 nm, larger than that (about 0.34 nm) of graphite, confirming the partially graphitized nature.As the temperature increases (700-1 000 °C), very slight right shifts of the(002) diffraction can be identified, indicating the graphitization degree can be slightly improved.Interestingly, under the same measurement conditions, the intensity of the (002) diffraction is the highest for the sample obtained at 800 °C, indicating the graphitic nanocrystallites in this sample have the largest number of layers.Normally, a higher temperature could induce larger graphitic nanocrystallites.The opposite trend from 800 to 900 °C could be ascribed to the largely decreased carbon yield.
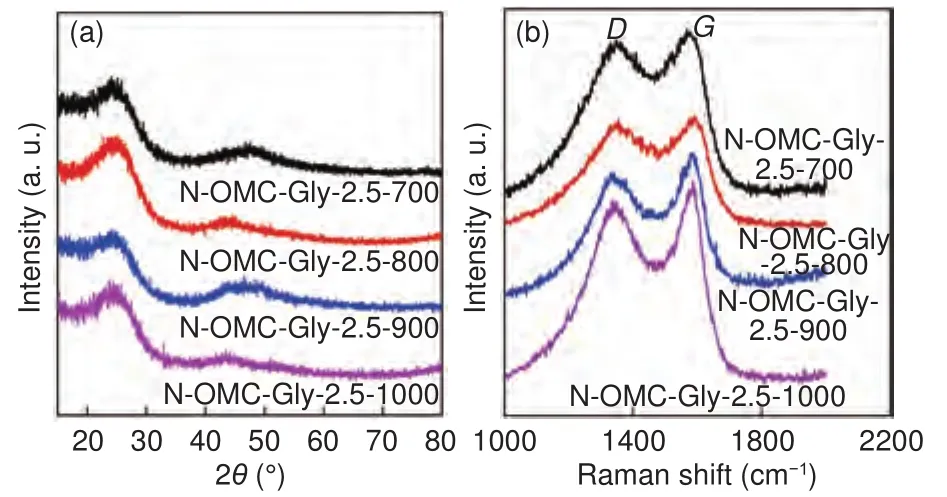
Fig.3 (a) Wide-angle XRD patterns and (b) Raman spectra of the NOMCs obtained at different temperatures with a fixed Gly/SBA-15 mass ratio of 2.5.
The Raman spectra of the N-OMCs obtained at 700-1 000 °C show two bands located at about 1 577 and 1 347 cm(Fig.3b), which can be assigned to theband associated with spcarbon atoms and theband associated with structure defects.All the samples have strongbands, confirming the presence of structure defects.The intensity ratio of theandbands (/) gently decreases and the G band becomes relatively narrower as the temperature increases, further indicating a higher temperature can induce an improved graphitization.
The SBA-15 template shows a long fiber morphology composed of interconnected wheat-like particles (Fig.4a).All the N-OMCs preserve the wheat-like particle morphology with no byproducts(Fig.4b-f), confirming that the Gly precursor can be fully driven into the mesopores via melting infiltration for confined pyrolysis.With low Gly/SBA-15 mass ratios of 1.0 and 1.5, the resulted N-OMCs are composed of discrete wheat-like carbon particles(Fig.4b, c).The wheat-like carbon particles aregradually interconnected into long fibers at high Gly/SBA-15 mass ratios of 2.0-3.0 (Fig.4d-f).This is because the precursor filling degree in the template gradually increases at a higher mass ratio, leading to more carbon deposition and larger domain sizes to form interconnected wheat-like particles.Therefore,the overall particle sizes of the N-OMCs can be simply controlled by changing the Gly/SBA-15 mass ratio.
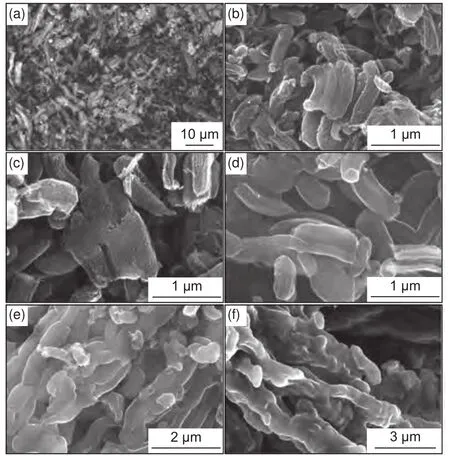
Fig.4 Low-magnification SEM images of (a) the SBA-15 template and the N-OMCs obtained at 800 °C with a Gly/SBA-15 mass ratio of (b) 1,(c) 1.5, (d) 2, (e) 2.5 and (f) 3, respectively.
High-resolution SEM (HRSEM) images depict the structure differences of the N-OMCs obtained at different Gly/SBA-15 mass ratios.The SBA-15 template possesses highly ordered and open mesopores(Fig.5a).For the N-OMCs obtained with Gly/SBA-15 mass ratios of 1.0-2.5, the surfaces of the wheat-like particles are open porous but with obvious differences (Fig.5b-e).Specifically, disordered pore voids of about 10-50 nm can be clearly observed in the sample obtained with a low mass ratio of 1.0, but the ordered mesopores originated from the silica walls are not obvious (Fig.5b), in accordance with its poorly resolved small-angle XRD pattern (Fig.2a).Ordered mesopores can be clearly observed for the samples obtained with Gly/SBA-15 mass ratios of 1.5-2.5(Fig.5c-e).The nanowires in these samples are discontinuous with the coexistence of disordered pore voids.As discussed before, the formation of the disordered pore voids is closely related with the changes in precursor cohesive and precursor-template adhesive interactions during carbonization.In addition, the number and size of these disordered pore voids gradually decrease as the Gly/SBA-15 mass ratio increases(Fig.5c-e).The surfaces of the wheat-like particles become mainly ordered mesoporous for the sample obtained with a Gly/SBA-15 mass ratio of 2.5(Fig.5e).Furthermore, with the highest Gly/SBA-15 mass ratio of 3, the surface of the wheat-like particle becomes dense while the inner part is ordered mesoporous (Fig.5f).This is because too much Gly loading causes coating of Gly on external surface of SBA-15, which is turned into carbon deposition at the external surface.After silica removal, the deposited carbon layers cover the ordered nanowire arrays.
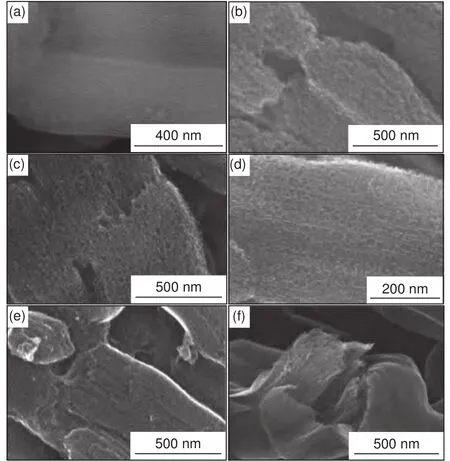
Fig.5 HRSEM images of (a) the SBA-15 template and the N-OMCs obtained at 800 °C with a Gly/SBA-15 mass ratio of (b) 1, (c) 1.5, (d) 2,(e) 2.5 and (f) 3, respectively.
TEM images of several N-OMCs further reveal their structure details.In most areas of N-OMC-Gly-1.5-800, the disordered pore voids make the ordered mesopores blurred (Fig.6a).For the sample N-OMCGly-2.5-800, ordered nanowire arrays with less disordered pore voids can be clearly detected (Fig.6b).The dark-field scanning TEM (DF-STEM) image of N-OMC-Gly-2.5-800 further reveals the co-existence of disordered and ordered mesopores inside the wheat-like particle (Fig.6c), validating the structure model shown in Fig.1.The HRTEM image of NOMC-Gly-2.5-800 shows the presence of curved layers with aspacing of about 0.36 nm, indicating the carbon walls are partially graphitized.For the sample N-OMC-Gly-3-800, ordered nanowire arrays coated with thin carbon layers can be clearly observed(Fig.6e), confirming the formation of external carbon layers with an excessive Gly loading.These thin carbon layers are dense with only small micropores(Fig.6f).Therefore, the structure of the N-OMCs can be controlled by varying the Gly/SBA-15 mass ratio.
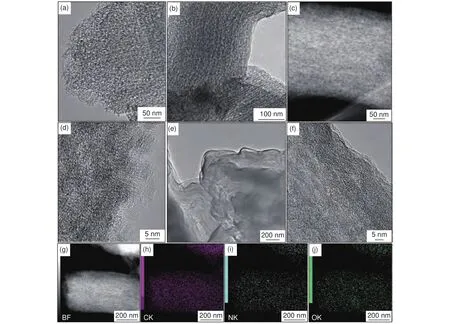
Fig.6 TEM characterization of several N-OMCs obtained at 800 °C with different Gly/SBA-15 mass ratios: (a) TEM image of N-OMC-Gly-1.5-800;(b) TEM, (c, g) DF-STEM, (d) HRTEM and (h-j) the elemental maps of N-OMC-Gly-2.5-800; and (e) TEM and (f) HRTEM images of N-OMC-Gly-3-800.
3.3 Textural properties
The SBA-15 template possesses a surface area of 535 m·gand uniform mesopores of 9.4 nm (Fig.S4 and Table 1).The N-OMCs obtained with differentGly/SBA-15 mass ratios and temperatures show combinative type I and IV Nadsorption/desorption isotherms with H2 type hysteresis loops, indicating their hierarchical microporous and mesoporous nature.They possess high surface areas (923-1 374 m·g),large pore volumes (1.32-2.21 cm·g) and bimodal mesopores (Fig.7 and Table 1).

Table 1 Summary of textural properties of the template SBA-15 and the N-OMCs obtained with different Gly/SBA-15 mass ratios and temperatures.
At 800 °C, the N-OMCs obtained with different Gly/SBA-15 mass ratios show different textural properties (Fig.7a, b and Table 1).The samples obtained at low mass ratios of 1.0-2.0 show decreasing but close surface areas.With higher mass ratios of 2.5-3.0, the resulted samples show much decreased surface areas and pore volumes.This is mainly because N-OMCs with a better structure replication and less disordered pore voids can be obtained by increasing the mass ratio (especially from 2.0 to 2.5) (Fig.5).In addition, very high Gly/SBA-15 mass ratios (2.5-3)can cause extra carbon deposition at the external surface of SBA-15, leading to reduced surface areas and pore volumes.Interestingly, the micropore surface area and micropore volume gradually increase with the increase of the mass ratio (Table 1).With more Gly loaded in the template, carbonization can be promoted and the released gaseous products can more effectively react with the carbon walls.As a result, more micropores can be generated with a higher Gly/SBA-15 mass ratio.On the other hand, the pore size distribution curves of the N-OMCs show bimodal mesopores with a narrow one centered at about 4.8 nm and a wide one at 6.2-20 nm (Fig.7b and Table 1).The former is ordered and originated from the silica walls,while the latter is from the disordered pore voids.With the increase of the Gly/SBA-15 mass ratio, the pore size peak at 4.8 nm becomes narrower and the wider mesopore distribution becomes weaker, confirming the better structure replication at a higher mass ratio.The pore volumes for the two types of mesopores are estimated (Fig.S5a, c).The pore volumes for the mesopores at 2-6.2 nm () are larger than those for the mesopores at 6.2-20 nm ()for all the samples.Interestingly,varies only slightly, whilefirst increases and then decreases as the Gly/SBA-15 mass ratio increases(Fig.S5c).
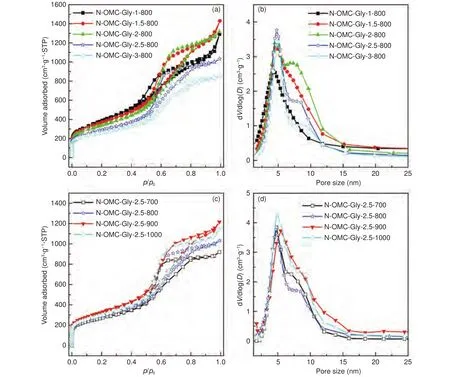
Fig.7 N2 adsorption-desorption isotherms and the corresponding pore size distribution curves of (a, b) the N-OMCs obtained with different Gly/SBA-15 mass ratios at 800 °C and (c, d) at different temperatures with a Gly/SBA-15 mass ratio of 2.5, respectively.
With a Gly/SBA-15 mass ratio of 2.5, the samples obtained at different temperatures also show variable textural properties (Fig.7c, d and Table 1).With the increase of temperature, the surface area and pore volume both increase from 700 to 900 °C.This is because the carbonization gradually increases at 700-900 °C with more and more gaseous products re-leased to create small pores.The micropore surface area and micropore volume decrease at 700-900 °C(Table 1) probably because of the increased micropore sizes at this temperature range.However, the surface area and pore volume decrease at 900-1 000 °C.At this temperature range, the carbonization is nearly finished at 900 °C, but the graphitization can be increased and the carbon walls can be thermally shrunk,leading to partial elimination of micropores, as revealed by the decreased micropore surface area and micropore volume.Similarly, all the samples obtained at different temperatures have bimodal mesopores (Fig.7d).With the increase of temperature, the size of the ordered mesopores increases to some extent, while the distribution of the disordered mesopores becomes relatively broader and overlap with that of the ordered mesopores.The pore volumes for the two types of mesopores are also estimated (Fig.S5b, d).is much larger thanfor all the samples.Interestingly,increases gently, whilefluctuates as the temperature increases(Fig.S5d).
3.4 Compositional and surface properties
Elemental analysis (EA) results reveal that carbon is the predominant component (71.9%-83.9%) for all the N-OMCs (Table 2).Meanwhile, the samples are highly doped with nitrogen(3.66%-12.23%) and oxygen (8.1%-13.9%).The DFSTEM image and the corresponding elemental maps show that the nitrogen and oxygen elements are uniformly distributed in the carbon matrix (Fig.6g-j).It should be pointed out that the absolute contents of the elements from the EA results are not accurate because of the unavoidable adsorption of water molecules.Nevertheless, the N/C atomic ratios calculated form the EA results are more accurate.Interesting trends can be observed at different temperatures and Gly/SBA-15 mass ratios.With a fixed Gly/SBA-15 mass ratio of 2.5, the carbon content in the resulted samples increases sharply from 71.9% at 700 °C to 81.2% at 800 °C, and then gently fluctuates at 800-1 000 °C, indicating that dramatic carbonization occurs at 700-800 °C with the release of many gaseous products and the carbonization becomes gentle at 800-1 000 °C.This result is consistent with the trends observed in the Nsorption results.A very high N content (~ 12.2%) with a N/C atomic ratio of 0.15 is observed in the sample obtained at 700 °C, indicating that Gly is an excellent precursor for the synthesis of highly N-doped carbon materials.With the increase of the temperature, the N/C atomic ratio gradually decreases from 0.15 to 0.039 at 700-1 000 °C, indicating the gradual elimination of nitrogen because of its lower thermal stability.On the other hand, at a fixed temperature of 800 °C, with the increase of the Gly/SBA-15 mass ratio, an increasing trend for the nitrogen content (5.83%-9.20%) in the resulted samples can be observed.The N/C atomic ratio increases obviously from 0.063 to 0.10 as the mass ratio increases from 1.0 to 3.0.This trend is unexpected because the temperature is normally considered to be the determining effect for nitrogen doping in carbon materials.The increasing trend can be explained as follows.With more Gly loaded in the template, polymerization of the Gly molecules can be enhanced.Moreover,with more Gly molecules pushing and squeezing in the mesopores, there is less empty pore space.As a result, the escape of the decomposed nitrogen-contain-ing gaseous products from Gly can be hindered and they tend to condense with the pyrolytic products,leading to increased nitrogen doping in the carbon walls.

Table 2 Summary of the chemical compositions from elemental analysis and the supercapacitor performances of the N-OMCs obtained with different Gly/SBA-15 mass ratios and temperatures.
The XPS survey spectrum of the typical sample N-OMC-Gly-2.5-800 shows three strong signals from the carbon, nitrogen and oxygen elements (Fig.8a).The high-resolution C 1s XPS spectrum can be fitted into four components at 284.8, 285.8, 286.7 and 288.9 eV (Fig.8c), which can be assigned to the carbon atoms of C=C, C=N, C―O and C=O bonding configurations, respectively.The O 1s spectrum can be fitted into three components at 531.5, 532.4 and 533.8 eV (Fig.8d), which can be indexed to the quinone-type oxygen (C=O), phenol-type oxygen(C―OH/C―O―C), and carboxyl-type oxygen(O―C=O), respectively.More importantly, the N 1s XPS spectrum can be fitted into graphitic nitrogen at 401.0 eV, pyrrolic nitrogen at 400.1 eV and pyridinic nitrogen at 398.3 eV (Fig.8b).Notably, with the increase of temperature, the relative peak intensities for the pyridinic and pyrrolic nitrogen components weaken and the opposite for the graphitic nitrogen component, indicating that the increase of graphitization can eliminate less stable nitrogen groups.In addition, the graphitic nitrogen component shifts to high binding energies at high temperatures (Fig.8b), indicating an enhanced electron transfer between the nitrogen group and the carbon skeleton.The above nitrogen and oxygen functionalities can improve the hydrophilicity of the samples for better aqueous electrolyte infiltration and generate abundant sites for pseudocapacitance.The nitrogen functionalities can also improve electronic conductivity for facile charge transfer.
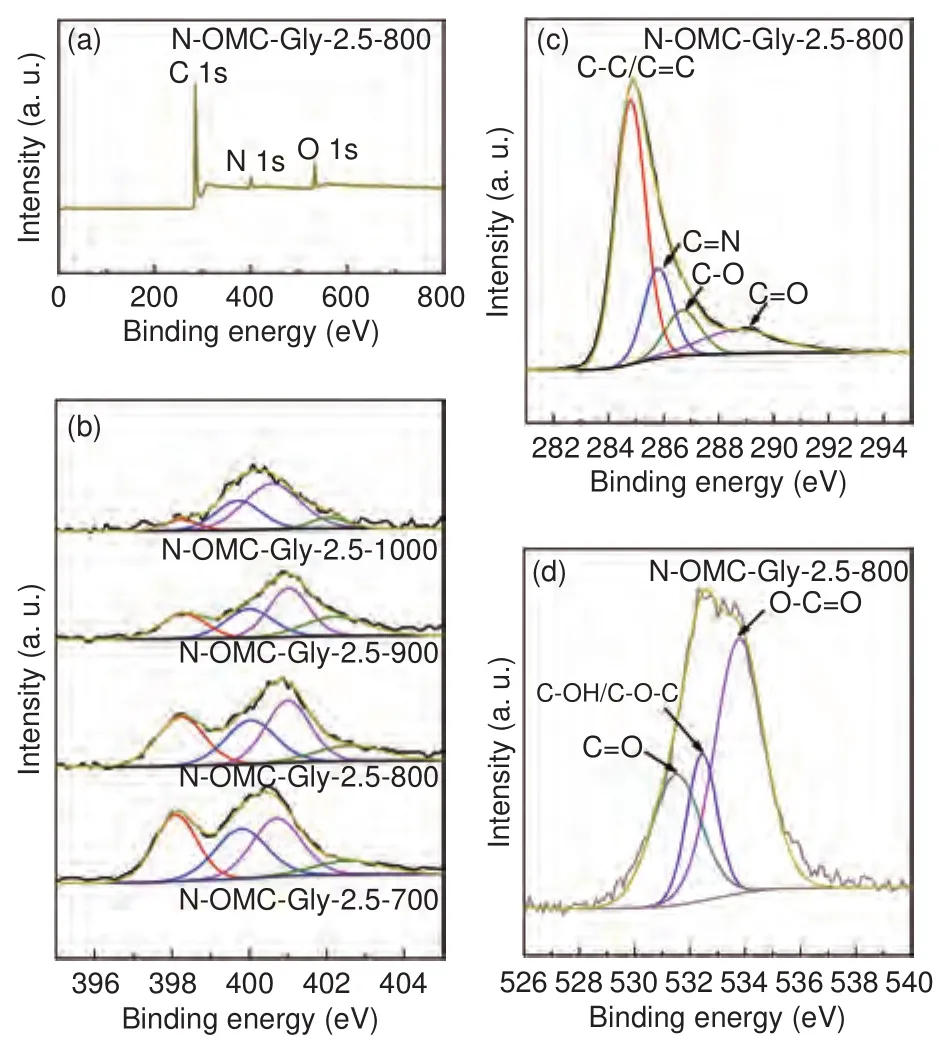
Fig.8 (a) XPS survey spectrum, and (b) high-resolution N 1s, (c) C 1s and(d) O 1s XPS spectra of various N-OMCs.
3.5 Electrochemical performance
The high surface areas, large pore volumes, uniform and bimodal mesopores and abundant heteroatom doping of the N-OMCs make them attractive electrode materials for supercapacitor.This can be verified by the high performance of the typical sample N-OMC-Gly-2.5-800.Specifically, its CV curve shows a rectangular shape (Fig.9a), indicating the electric double-layer capacitance behavior.Meanwhile, weak redox peaks at about −0.4 V can be observed in the CV curve, which can be ascribed to the redox of the nitrogen and/or oxygen groups inducing pseudocapacitance.At a current density of 0.5 A·g, the specific capacitance is up to 298 F·g(Table 2), which is better than or comparable to many reported nitrogendoped OMCs (Table S1).Moreover, the galvanostatic charge and discharge (GCD) curves maintain the triangle shape with no sudden voltage drop(Fig.9b), and a high specific capacitance of 208 F·g(70% of the initial value) can be maintained at a high current density of 30 A·g(Fig.9c and Table 2), indicating a high rate capability.In addition, after recycled for 3 000 times, the capacitance can be well maintained with only a 5% loss (Fig.9e), and the CV curves collected before and after the cycling tests are almost the same (inset in Fig.9e), indicating an excellent stability.
With a fixed Gly/SBA-15 mass ratio of 2.5, the samples obtained at 700-1 000 °C show different capacitance and rate capability.Their CV curves are similarly rectangular (Fig.9a).At a low current density of 0.5 A·g, the specific capacitance of the samples first increases sharply from 209 to 298 F·gat 700-800 °C, followed by dramatic decreases to 184 and 185 F·gat 900-1 000 °C (Fig.9c and Table 2).Normally, a higher surface, a higher nitrogen content and a lower charge resistance are preferred for a larger capacitance.Unfortunately, these properties show different (either increasing or decreasing) trends with the increase of temperature and they can hardly be optimized simultaneously in an individual sample.The sample obtained at 800 °C possesses the highest specific capacitance because of the balance of these properties.Specifically, the capacitance increases from 700 to 800 °C is because of the improved surface area(Table 1) and enhanced electric conductivity.As revealed by the XRD patterns and Raman spectra, the graphitization can be improved at a higher temperature, which could reduce electric resistance.The Nyquist plots of the samples obtained at 700-1 000 °C show no obvious semicircles at the high-frequency region (Fig.9d), indicating that the resistance for electron transfer at the electrode-electrolyte interface is small.However, the ion diffusion resistance of the sample obtained at 700 °C is larger than other samples as revealed by the smaller slope at the low-frequency region of the Nyquist plot (Fig.9d).On the other hand, the specific capacitance of the samples dramatically decreases from 800 to 1 000 °C, although they have close surface areas (1 030-1 166 m·g) and similar electric resistance.The major reason for this dramatic decrease is the largely reduced nitrogen content (the N/C ratio decreased from 0.096 to 0.039 at 800-1 000 °C) (Table 2).The reduced nitrogen content could result in inferior electrolyte wettability and loss of pseudocapacitence, especially the loss of pyrrolic and pyridinic nitrogen reducing pseudocapacitance.On the other hand, the rate capability shows an increasing trend with the increase of temperature (Fig.9c).This could be due to the improved electric conductivity at a higher temperature.The sample obtained at 700 °C shows a poor rate capability, only 47% capacitance can be maintained at 30 A·g, because of its poor graphitization.The other samples obtained at 800-1 000 °C shows high capacitance retention (70%-75%) because of their high and similar graphitization.
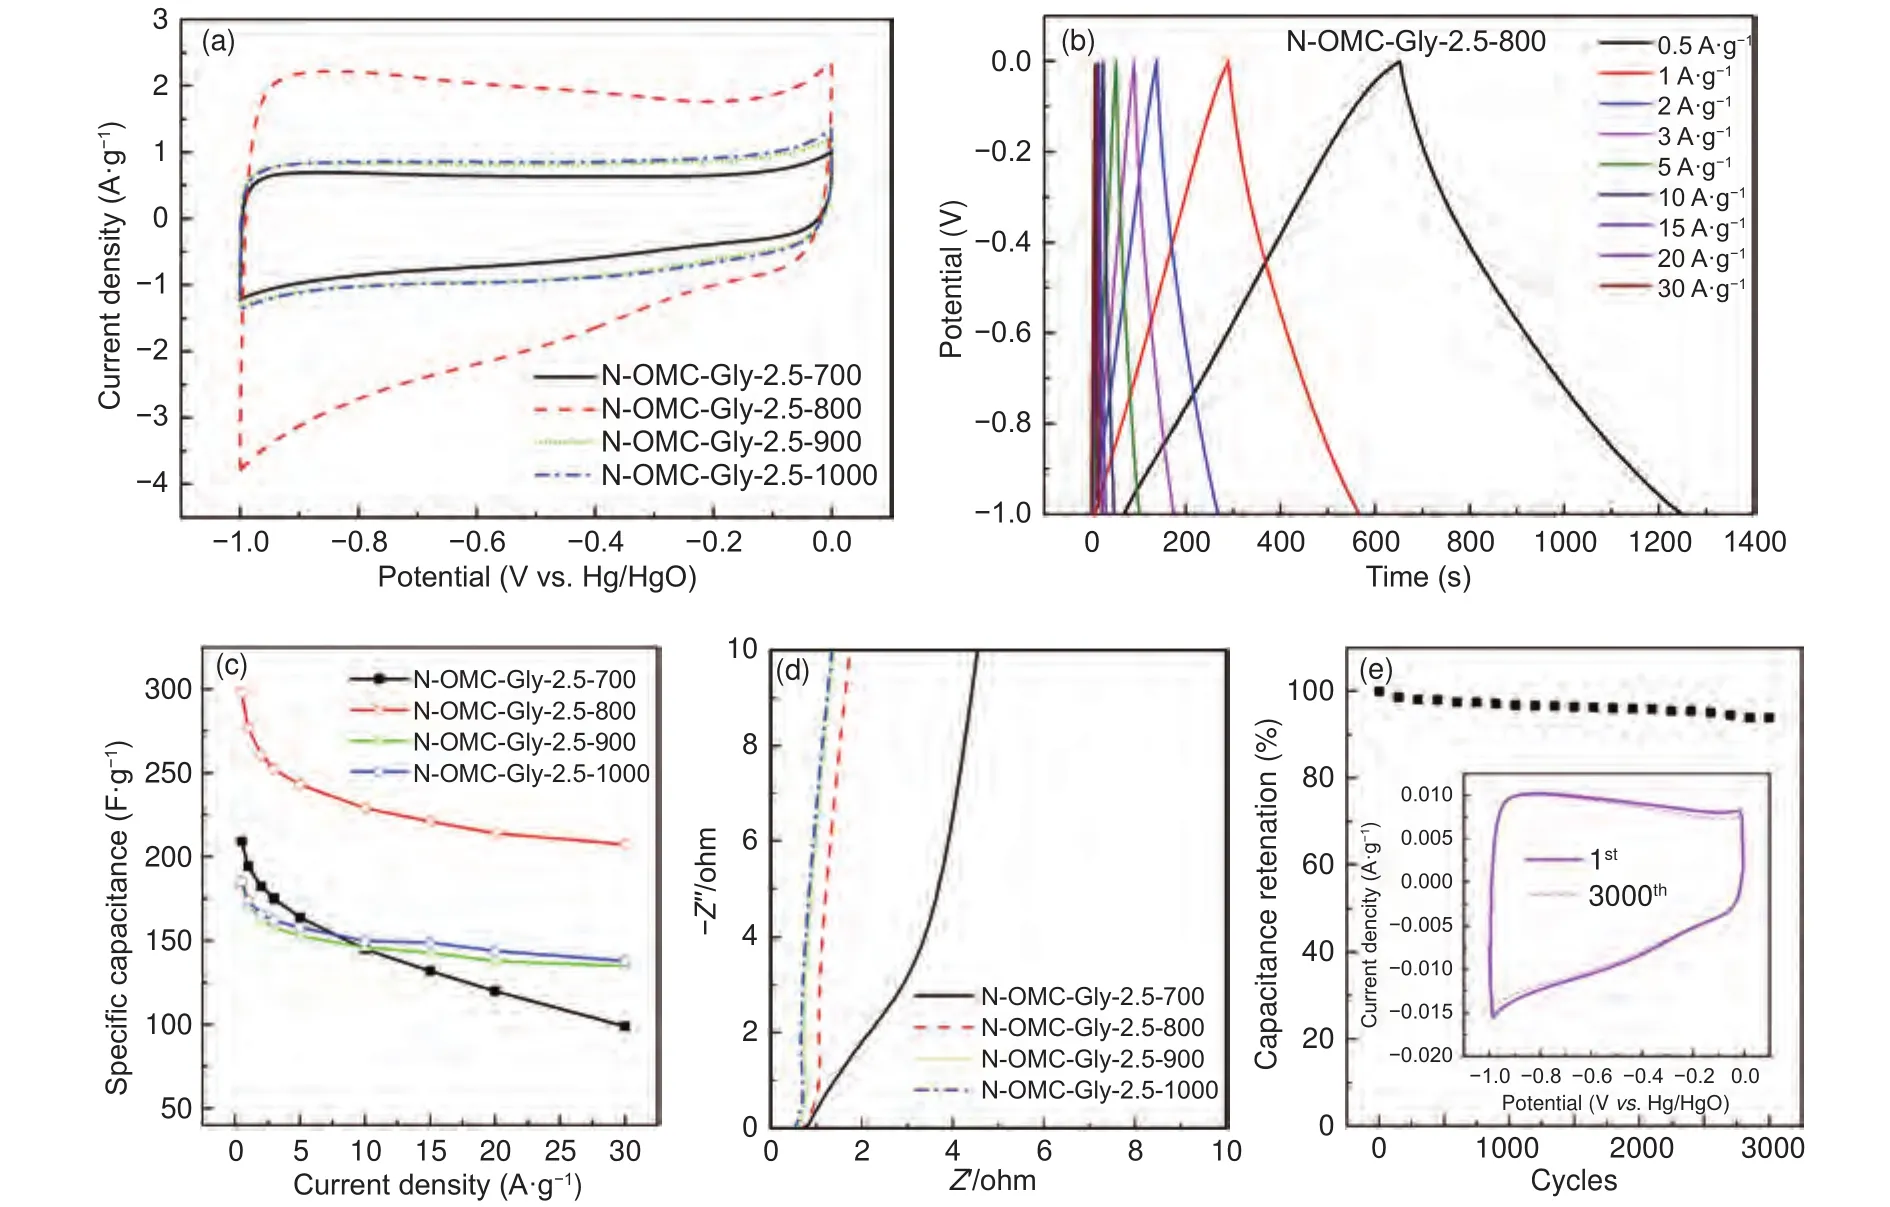
Fig.9 (a) CV and (b) GCD curves, (c) capacitance at different current densities, (d) the Nyquist plots, and (e) capacitance retention for cyclic test and the inset CV curves before and after cycling of the N-OMCs obtained at different temperatures with a Gly/SBA-15 mass ratio of 2.5.
At a fixed temperature of 800 °C, the samples obtained with different Gly/SBA-15 mass ratios also show different capacitance behaviors.The capacitance at 0.5 A·ggradually increases from 227 to 298 F·gat mass ratios of 1.0-2.5, and then shows a cliff-like drop to only 95 F·gat the mass ratio of 3(Fig.10a).At mass ratios of 1.0-2.5, the surface area of the resulted samples are close but decreases to some extent (Table 1) and the Nyquist plots show the similar charge resistance (Fig.10b).As a result, the gradual increase of the capacitance at mass ratios of 1.0-2.5 can be explained by two factors.The first one is the gradually increased nitrogen content (the N/C ratio increases from 0.063 to 0.096 at the mass ratio of 1.0-2.5) (Table 2) and the gradually enhanced micropore surface area (Table 1), which are helpful for pseudocapacitance and charge storage.The second one is the mesostructure ordering of the samples improves with the increase of the mass ratio (Fig.2).The better structure ordering could be helpful for overcoming the slow interparticle ion transport.However, with a very high Gly/SBA-15 mass ratio of 3, the resulted sample shows a cliff-like drop in capacitance.With too much Gly loaded, the surface of the resulted sample is covered with dense carbon layers.These dense carbon layers can decline the infiltration of electrolyte and greatly decrease the mass transfer rate, leading to the much poorer performance.On the other hand, all the samples obtained at 800 °C with different mass ratios show close rate capabilities (65%-73%) because of their similar graphitization and close charge resistance (Fig.10b).
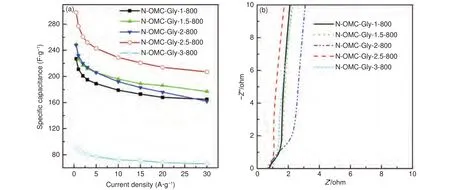
Fig.10 (a) Capacitance at different current densities and (b) the Nyquist plots of the N-OMCs obtained at 800 °C with different Gly/SBA-15 mass ratios.
In addition, the N-OMCs as electrode materials also show good ORR performance (Fig.11).The CV curve of the sample N-OMC-Gly-2.5-1000 in the O-saturated electrolyte shows a sharp peak at 0.76 V(Fig.11a), indicating a high ORR activity.The LSV curve of the sample shows onset and half-wave potentials of 0.92 and 0.83 V, avalue of 5.06 mA·cmand a high current density of 4.43 mA·cmat 0.8 V(Fig.11b).Such performance is inferior to that (onset and half-wave potentials of about 1.0 and 0.86 V and avalue of 5.50 mA·cm) of the commercial 20%Pt/C catalyst, but comparable to or better than some reported nitrogen-doped OMCs (Table S2).Compared with the 20% Pt/C catalyst, there is a peak in the LSV curve of N-OMC-Gly-2.5-1000 mainly because of its thicker catalyst layer.Initially, reduction of the Oboth stored inside the catalyst layer and diffused from the bulk contributes to the polarization current.With the consumption of the stored O, the current is only originated from the diffused O, leading to a smaller current and formation of the peak before the diffusion control zone.Comparatively, although the sample obtained at 1 000 °C possesses a relatively lower surface area and a much lower nitrogen content than those of the other samples obtained at 700-900 °C, it shows the best ORR performance(Fig.11b).This is mostly because of the better graphitization degree for facile electron transfer and the stable graphitic nitrogen for providing robust active sites.The LSV curves of the sample N-OMC-Gly-2.5-1000 at different rotation speeds show the similar shape with linearly increased current density(Fig.11c).The corresponding K-L plots show good linearity and give an average electron transfer number of 2.94 (Fig.11d), indicating the co-occurrence of the two-electron and four-electron reaction pathways.
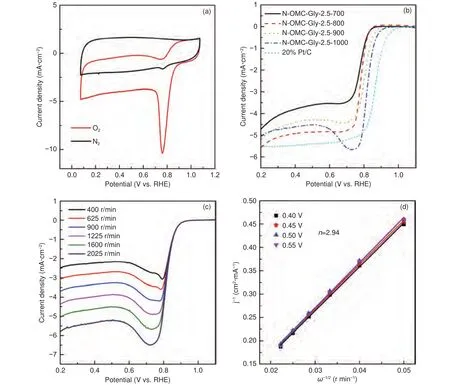
Fig.11 (a) CV curves of N-OMC-Gly-2.5-1000 in N2- and O2-saturated 0.1 mol L−1 KOH solution, (b) LSV curves of the samples obtained at 700-1000 °C with a Gly/SBA-15 mass ratio of 2.5, and (c) LSV curves at different rotation speeds and the corresponding (d) K-L plots of N-OMC-Gly-2.5-1000.
4 Conclusion
In summary, the solvent-free nanocasting method is used to turn the simplest amino acid (Gly) into N-OMCs with high surface areas (923-1 374 m·g),large pore volumes (1.32-2.21 cm·g), bimodal mesopores (4.8 nm and 6.2-20 nm) and high nitrogen content (3.66%-12.23%).The strong precursor-template adhesive forces and the tight mesopore confinement contribute to improved carbonization.The confined pyrolysis of Gly induces interesting structuration, namely, replicating ordered mesopores and creating disordered pore voids.By changing the Gly/SBA-15 mass ratio and temperature, the mesostructure ordering, particle size, porosity and nitrogen doping level can be tuned.A high Gly/SBA-15 mass ratio (in the range of 1-3) results in better structure replication,more nitrogen doping, more micropores but relatively smaller surface area and pore volume.A higher carbonization temperature improves graphitization but induces loss of nitrogen.The N-OMCs are promisingfor supercapacitor.A larger surface area, a higher nitrogen content and a better graphitization are preferred, but these properties can hardly be simultaneously optimized because they vary in opposite (either increasing or decreasing) trends.The optimized sample possesses a high specific capacitance of 298 F·gat 0.5 A·g, a high rate capability (70%) at 30 A·g, and an excellent cyclic stability.The NOMCs are also promising for ORR.The typical sample shows onset and half-wave potentials of 0.92 and 0.83 V and a limiting current density of 5.06 mA·cm.This work could provide useful information on how heteroatom-doped mesoporous carbon materials with attractive properties and performances can be synthesized from small organic molecules using the solvent-free nanocasting method.
We appreciate the financial support from the National Natural Science Foundation of China(21875153, 21501125), the Natural Science Foundation of Jiangsu Province (BK20150312), and the Jiangsu Shuangchuang Team Program.We also thank the Priority Academic Program Development (PAPD)of Jiangsu Higher Education Institutions for support.We thank Ms.GUO Ya at Soochow University for experimental assistance.

