Changes in Typhoon Regional Heavy Precipitation Events over China from 1960 to 2018※
Yangmei TIAN, John L. MCBRIDE, Fumin REN, Guoping LI, and Tian FENG
1College of Atmospheric Sciences, Chengdu University of Information Technology, Chengdu 610225, China
2State Key Laboratory of Severe Weather, Chinese Academy of Meteorological Sciences, Beijing 100081, China
3Honorary, School of Earth Science, University of Melbourne, and Research and Development Division,Bureau of Meteorology, Melbourne, VIC 3010, Australia
4Haikou Meteorological Observatory, Haikou Meteorological Bureau, Haikou 570100, China
ABSTRACT In earlier studies, objective techniques have been used to determine the contribution of tropical cyclones to precipitation (TCP) in a region, where the Tropical cyclone Precipitation Event (TPE) and the Regional Heavy Precipitation Events (RHPEs) are defined and investigated. In this study, TPE and RHPEs are combined to determine the Typhoon Regional Heavy Precipitation Events (TRHPEs), which is employed to evaluate the contribution of tropical cyclones to regional extreme precipitation events. Based on the Objective Identification Technique for Regional Extreme Events(OITREE) and the Objective Synoptic Analysis Technique (OSAT) to define TPE, temporal and spatial overlap indices are developed to identify the combined events as TRHPE. With daily precipitation data and TC best-track data over the western North Pacific from 1960 to 2018, 86 TRHPEs have been identified. TRHPEs contribute as much as 20% of the RHPEs, but 100% of events with extreme individual precipitation intensities. The major TRHPEs continued for approximately a week after tropical cyclone landfall, indicating a role of post landfall precipitation. The frequency and extreme intensity of TRHPEs display increasing trends, consistent with an observed positive trend in the mean intensity of TPEs as measured by the number of daily station precipitation observations exceeding 100 mm and 250 mm. More frequent landfalling Southeast and South China TCs induced more serious impacts in coastal areas in the Southeast and the South during 1990-2018 than 1960-89. The roles of cyclone translation speed and “shifts” in cyclone tracks are examined as possible explanations for the temporal trends.
Key words: typhoon, regional heavy precipitation events, changes, temporal and spatial characteristics
1. Introduction
In the context of global warming, with the increasing frequency of occurrence of extreme events worldwide, much attention has been paid to changes in extreme weather, with one focus being on extreme precipitation. Numerous studies have provided evidence for increases in the frequency and magnitude of extreme precipitation events in various parts of the world (Alexander et al., 2006), including America, Europe, and China (Karl and Knight, 1998; Klein Tank and Können, 2003; Zhai et al., 2005; Trenberth et al., 2007).
Early studies on extreme precipitation events paid close attention to single-station daily events (Zhang et al., 2000;Zhai et al., 2005; Klein Tank et al., 2006; Wang et al.,2007). The IPCC Special Report on Extremes (SREX)(IPCC, 2012) assessed the complex relationship between disasters and extreme events including extreme precipitation events, which depends on exposure and vulnerability as well as the severity of the extreme event itself. The spatial extent and the temporal persistence of an extreme event are two important aspects of its character and defining them is therefore important. For more than ten years, regional extreme precipitation, which includes the spatial extent and the temporal persistence, has attracted a growing concern(Moberg and Jones, 2005; Zhai et al., 2005; Xu et al., 2011;Kunkel et al., 2013; Walsh et al., 2014; Wu, 2015; Zou and Ren, 2015; Niu et al., 2018). In the context of research methods to define large-scale continuous regional extreme precipitation events, Ren et al. (2018) defined three categories: (1)Spatial simultaneity analyses, focusing on the impact area of events; (2) temporal persistence, emphasizing the study of time series; (3) identifying regional extreme events, taking both spatial continuity and temporal persistence into account.
Chen and Zhai (2013) identified regional heavy precipitation events by first identifying the continuity of a single station and then considering the spatial consistency. Ren et al. (2012) defined the acronym Regional Heavy Precipitation Events (RHPEs), which are identified through the general objective identification technique for regional extreme events (OITREE). Using this framework, Zou and Ren(2015) analyzed the spatio-temporal characteristics of RHPEs in China from 1961 to 2012 using the OITREE (These and other acronyms used in this paper are shown in Table 1).
Most daily precipitation records, worldwide and in China are associated with tropical cyclones or typhoons(Tao, 1980). For example, Reunion Island in the Southern Indian Ocean set a record for the highest precipitation in March 1952, with the maximum rainfall reaching 1870 mm in 24 hours, brought about by the presence of a tropical cyclone (Chen, 1977). In August 1975, a typhoon named Nina caused an extreme rainstorm of 1062 mm in 24 hours (Ding,1994) at Zhumadian in central China, this being a record for the Chinese mainland. Generally, heavy rainfall associated with a typhoon cyclone often leads to disasters such as reservoir collapse, landslide, debris flow and flash flood, posing a threat to life and society.
Given this, it is of interest to determine the contribution of tropical cyclones to RHPEs. Changes in Tropical Cyclone Precipitation (TCP) have been documented by Ren et al. (2002, 2006), Cheng et al. (2007), Wang et al. (2008),Knight and Davis (2007, 2009), Jiang and Zipser (2010),and Lavender and McBride (2021). Some studies have analyzed the extreme precipitation of tropical cyclones from the perspective of extremes at individual stations (Knight and Davis, 2009; Jiang and Qi, 2016; Villarini and Denniston,2016; Jiang et al., 2018; Cai et al., 2019; Dhakal, 2019; Qiu et al., 2019). Some studies have also analyzed the involved possible mechanisms of TCP, such as TC translation speeds(Lai et al., 2020), average duration and intensity of strong TCs (Liu and Wang, 2020), and atmospheric water vapor content and moisture transport (Gao et al., 2021). Although tropical cyclones produce the most intense rainfall in the world(Tao, 1980), few studies pay attention to RHPEs in the context of tropical cyclones.
In this study focusing on typhoon regional heavy precipitation events in China, we examine the contribution of tropical cyclones to RHPEs. Thus, we develop an objective definition of combined events, referred to here as Typhoon Regional Heavy Precipitation Events (TRHPEs). Section 2 introduces the data and methods. Section 3 outlines the objective methodology to identify TRHPEs. The main section of the paper is section 4 which uses station rainfall data over China in the period 1960-2018 to identify 86 TRHPEs.Their spatial structure over China, the seasonal distribution,and their percentage contribution to RHPEs are analyzed,along with temporal changes and relationship to cyclone tracks and speed of movement. A summary and concluding remarks are provided in section 5.
2. Data and method
2.1. Data
There are two primary datasets used in this study: (1)Daily precipitation observations over the period from 1200 UTC on the previous day to 1200 UTC on the present day for 1960-2018, from 2112 meteorological stations of the National Meteorological Information Center and the China Meteorological Administration (CMA), including 2089 over the Chinese mainland and 23 over Taiwan; (2) The TC best-track data at 6-hour intervals, from 1960 to 2018 over the western North Pacific from the Shanghai Typhoon Institute of CMA, (http://tcdata.typhoon.gov.cn/en/index.html) (Ying et al., 2014), including the position, minimum sea level pressure, and maximum wind speed. The station distribution is shown in Fig. 1.

Table 1. The acronyms used in this study to describe precipitation events and the objective algorithms used in their definition.
2.2. Methods
The identification of TRHPEs is based on two earlier objective identification techniques-OITREE and OSAT(the Objective Synoptic Analysis Technique), as referenced in Table 1, and described below.
2.2.1. OITREE technique
OITREE (Ren et al., 2012; Zou and Ren, 2015) is an objective identification technique for regional extreme events including RHPEs. For identifying RHPEs, the technique includes five steps: (1) select a daily index for each individual point (station) to represent precipitation conditions;(2) partition the natural daily heavy precipitation belts; (3) distinguish the temporal continuity of precipitation events; (4)construct the index system of RHPEs; and (5) choose the threshold extreme values (the index system) to define the regional precipitation events. The index system of RHPE refers to the five single indices including extreme intensity(I1), accumulated intensity (I2), accumulated impacted area(As), maximum impacted area (Am), and duration (D). An integrated index, which is a function of the five single indices, is defined as follows:

Ren et al. (2012) suggested that it is better to apply an objective method in calculating the five weighting coefficients (ei), and in this study, the objective method applied in Li et al. (2014) is adopted.
2.2.2. OSAT technique
Some climatological studies use a fixed radius, for example, 500 km, to define typhoon precipitation (Lonfat et al., 2004; Kamahori, 2012; Lavender and McBride, 2021).However, given the variations in typhoon size, the fact that the curved cyclone rainbands can extend as far as 1000 km(Ren et al., 2006; Jiang et al., 2008), and the frequent occurrence of rainfall by other synoptic systems in its close vicinity, it is widely recognized that the fixed radius method is merely expedient (Dare et al., 2012). An alternative methodology was used by Jiang and Zipser (2010) who defined precipitation features in terms of large areas of contiguous rainfall pixels. According to their method, typhoon rainfall is based on a fixed radius for the centroid of these precipitation features, though the features themselves, and so the typhoon rainfall, extend beyond the fixed radius.
In this paper, we define typhoon rainfall using the objective identification technique-OSAT of Ren et al. (2007),which is widely used to partition TC precipitation in China,both in forecast operations and climate change and risk analysis research (Luo et al., 2016; Jiang et al., 2018; Qiu et al.,2019; Ding et al., 2020; Feng et al., 2020). According to the structure distribution of the precipitation field, the method separates the daily precipitation field into independent rainbelts and discrete precipitation stations to distinguish the TC precipitation by the distance from the TC center between the independent rain belts as well as neighboring discrete precipitation stations.
2.2.3. The objective identification of a TRHPE
Based on OSAT (Ren et al., 2007) and OITREE (Ren et al., 2012), an objective identification of a TRHPE has been developed in this study. In the following, a typhoon case, in which precipitation occurred over China, is called a typhoon precipitation event (TPE). The flowchart of the technique for identifying TRHPEs is provided in Fig. 2. There are three main steps: (1) to identify the two sets (temporal and spatial overlaps) of precipitation events; (2) to establish overlap indices; (3) to establish a standard for identifying TRHPEs.
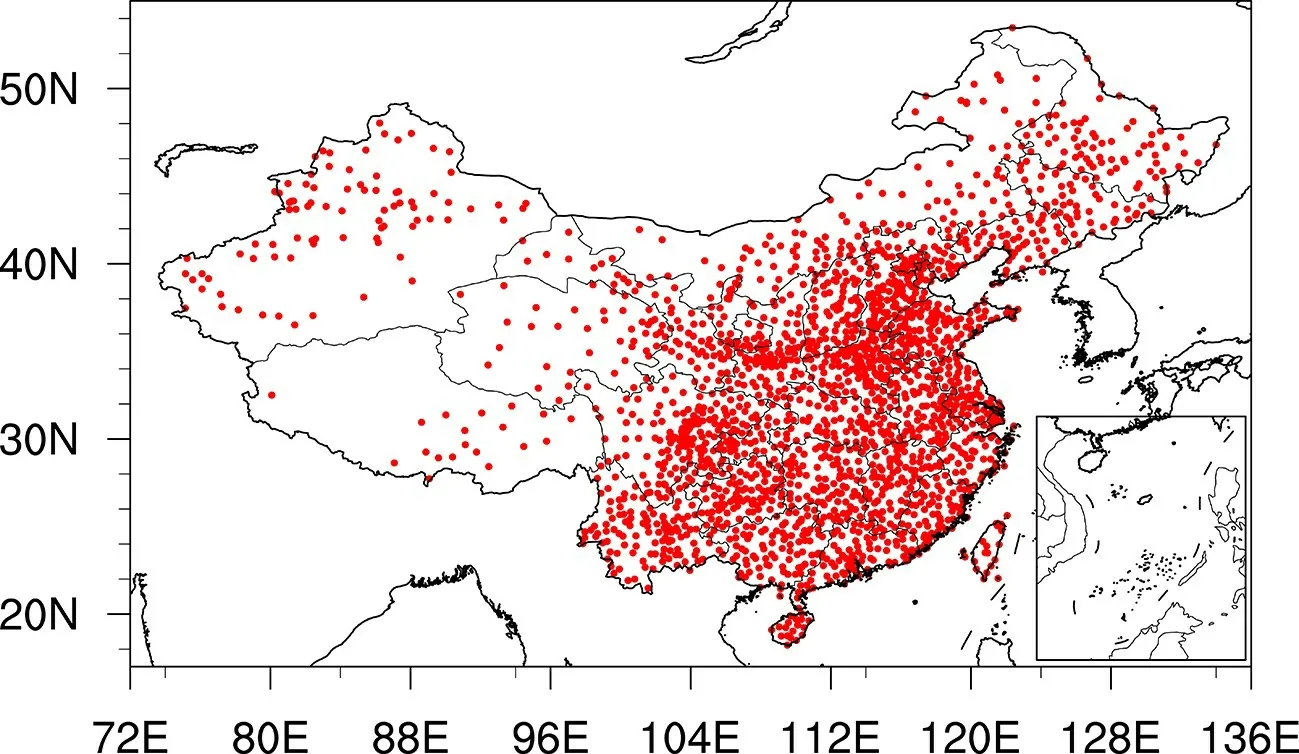
Fig. 1. Distribution of the 2112 stations applied in this study.

Fig. 2. Flowchart for the objective identification of typhoon regional heavy precipitation events (TRHPEs).
The first step is to use OITREE and OSAT to identify RHPEs and TPEs during the analysis period, respectively.The second step is to establish two indices for the overlap between the two sets of events. This can be divided into three sub-steps. Sub-step 1 is temporal overlap identification. For every event pair, a RHPE and a TPE, they have their own durations-RHPE duration (D1) and TPE duration (D2) in days. Its purpose is to determine if the event pair has an overlap duration (t):

wherep(D1) andp(D2) are the period (actual calendar days) of RHPE duration (D1) and TPE duration (D2), respectively. If t > 0, that means the event pair has an overlap duration and so we turn to the next sub-step. Sub-step 2 is spatial overlap identification. Its objective is to judge the daily number of overlap stations for the RHPE and the TPE during the overlap duration (t). Sub-step 3 consists of calculating two indices: the average RHPE station overlap rate (R1)and the average TPE station overlap rate (R2). The equations are as follows:
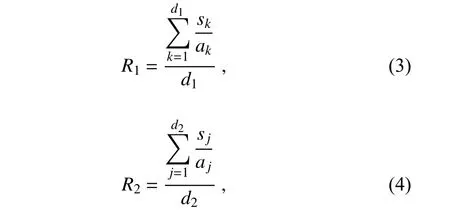
where Eq. (3) applies to the RHPE and the variables skandakare the number of overlap stations and total stations on day k, respectively, while Eq. (4) applies to the TPE and the variables sjandajare the numbers of overlap stations and total stations on day j, respectively. The final step is to set up a functional relationship ofR1andR2as a standard for identifying TRHPEs.
Some parameters have been determined from repeated calculations and experimentation by comparisons with the actual situation. In step 1, the parameters of OITREE are set as follows: the threshold for defining daily abnormal heavy rainfall for a station is the 95th percentile of daily precipitation; the distance threshold for defining neighbor stations is 250 km; the threshold for the number of stations in a daily abnormal heavy precipitation belt is 10; the neighboring abnormal ratio is 0.1, and the five weighting coefficients(e1,e2,e3,e4,e5) of the integrated index are 0.18, 0.25, 0.22,0.21 and 0.14 respectively. In addition, considering the significant influence of strong events, the threshold of the integrated index Z for defining an RHPE for China was determined to be 2.0, which was decided by removing the events with low integrated index based on the frequency distribution of the integrated index. Using this parameter set produces 454 RHPEs.
Over the same data set using the OSAT technique,1,041 TPEs have been identified. Following step 2, 191 potential TRHPEs were obtained with differentR1andR2(Fig.3). In step 3, Eq. (4), which is the functional relationship ofR1andR2for identifying TRHPEs, was established. According to the following relationships, if an event pair (an RHPE and a TPE) meets either of the two conditions-R1>0.2 orR1>0.12 andR2>0.1, it is defined as a TRHPE.

3. Validation of the technique for identifying TRHPEs
To illustrate the impact of the objective identification,two events are selected respectively on the left and right sides of the screening line (the red line in Fig. 3). On the right side, the yellow point (R1= 0.16 andR2= 0.12)includes precipitation associated with landfalling typhoon Lucy in 1974. The RHPE duration corresponding to this TRHPE is 17 days from 2 August to 14 August, and the TCP duration is from 9 August to 13 August. Before the coincidence, RHPE was affected by the southwest vortex, shear line and other systems for 9 days, mainly in southwest, northern and other parts of East China. On 9 and 10 August, TCP with weak intensity appeared in Taiwan, Fujian and other places and could not be identified as RHPE; TCP coincided with RHPE with 53 stations on 11 August, which was mainly concentrated in Taiwan and Fujian. On the 12th, the number of coincident stations increased to 107 with the increasing intensity of precipitation in Fujian and heavy precipitation occurring in parts of Anhui, Jiangsu, and Jiangxi.The RHPE average stations coincidence rate reached 98%on the 13th, with 130 stations overlapped. The precipitation intensity in East China was enhanced, among which the largest precipitation intensity was in Shandong. On 14 August, the typhoon disappeared, but the heavy precipitation caused by the typhoon continued, and the center of the heavy precipitation remained on the Shandong Peninsula. In general, during the coincidence of the two types of events,the coincidence of the intensity centers of precipitation performed well. It is appropriate that this point is classified as being a TRHPE.

Fig. 3. The distribution of 191 potential typhoon regional heavy precipitation events (TRHPEs). The abscissa is average RHPE station overlap rate R1 while the ordinate is average TPE station overlap rate R2.
On the other side of the screening line, the red point (R1= 0.19 andR2= 0.06) is considered to not satisfy the criterion to be a TRHPE. The TCP component of this event is caused by side-swiping typhoon Nancy in 1986. The RHPE duration is from 20 June to 23 June, and the TCP duration is from 22 June to 25 June. The common duration is only one day (23 June) with 41 stations in common. On the 24th and 25th, the precipitation intensity was weak and only TCP continued. The contribution of the typhoon to RHPE was small and the event should not be identified as a TRHPE.
The above analyses indicate that it is reasonable that the yellow point belongs to TRHPE while the green point does not. It is noted that the staggering of the screening line adds only 3 additional events.
4. Analysis of the characteristics of TRHPEs over China
Using the objective method described in Section 3, a total of 86 TRHPEs were identified. Based on the highest values of the integrated index Z, the top 10 TRHPEs are shown in Table 2. The No. 1 TRHPE is associated with Typhoon Herb in 1996, with the precipitation covering Southeast China, the middle and Lower Yangtze River and Taiwan.The extreme intensity 1094.5 mm occurred over Taiwan and is one of the most extreme daily totals ever recorded in China. The second most severe TRHPE is associated with Typhoon Tim (1994), which landed in Taiwan on July 10 and then moved northwestward, affecting Southeast China and Central China successively (Meng et al., 2002). It should be noticed that most of the RHPEs continued after the typhoon dissipated, which indicates an important contribution of post-landfall cyclone remnants to extreme regional rainfall events.
Inspection of the 4th and 5th columns of the Table reveals that the RHPE almost always continues for several days after the TPE has been completed. For the leading ten events, the number of days the RHPE continued after the TPE finished are respectively (3, 3, 5, 6, 4, -1, 6, 3, 0, 4).This is one of the first findings of this study: the post landfall rainfall is a major contributor to the RHPEs.
Figure 4 shows TRHPE frequency (blue line, righthand ordinate) for different extreme intensity values. The columns (left hand ordinate) show the ratio of the number of TRHPEs to RHPEs (orange column) and to TPEs (grey column). The extreme intensity of TRHPEs is mainly between 200 and 600 mm, with 48 events between 200-400 mm and 27 events between 400-600 mm. The ratios of TRHPEs to the two original precipitation events increase with increasing extreme precipitation intensity. For single station extreme intensities (I1) equal to or greater than 1000 mm intensity, the ratio of TRHPEs to TPEs reaches 100%.This is consistent with the conclusion of Chen et al. (2010)that the most serious extreme precipitation in China is related to typhoons. It is also noted that most TPEs are not TRHPEs, the ratio being only 8%.

Table 2. List of top 10 TRHPEs over China.
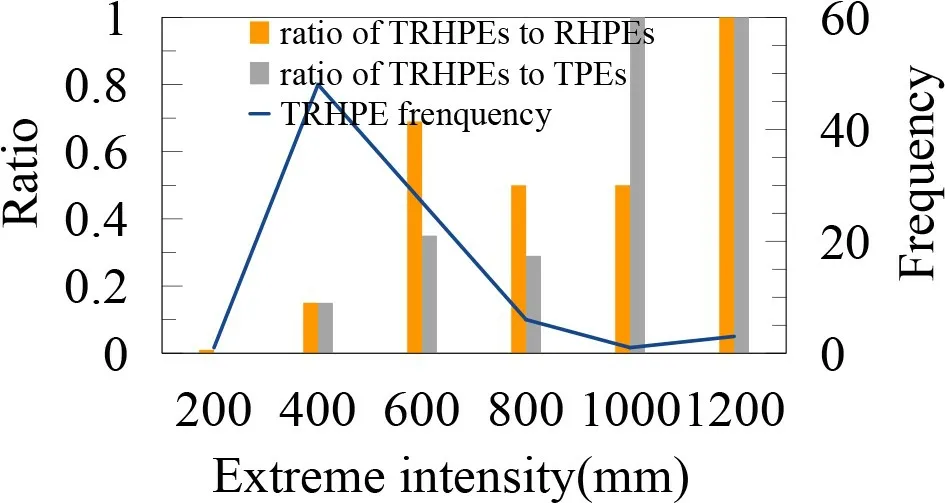
Fig. 4. TRHPE frequency (blue line, right hand ordinate) for different extreme intensity values. The extreme intensity values displayed on the abscissa are the highest daily rainfall at a single station during the event. The columns (left hand ordinate) show the ratio of the number of TRHPEs to RHPEs(orange column) and to TPEs (grey column).
Figure 5a displays the annual variation of TRHPEs during 1960-2018 with an upward trend at a rate of 0.14 (10 yr)-1, significant only at the 10% level according to the nonparametric Kendall’s tau test (Kendall and Gibbons, 1981)(All the trend analyses in this paper are based on this method). The maximum annual frequency is 5 in 1994.Over the period of the 59 years, there have been 12 years without TRHPEs, including four in the 1970s and three in the 1980s. The trend of RHPE annual frequency (Fig. 5b) is also positive, consistent with TRHPE’s. The trend of TPEs(Fig. 5c) is downwards, consistent with the finding of Wang et al. (2008), with a long-term downward trend at a rate of-0.88 (10 yr)-1, which is statistically significant at a level of 0.05. As discussed by Wang et al. (2008), this long-term decrease in tropical cyclone rainfall over China is related to a shift in tropical cyclone tracks, specifically with fewer landfalls occurring over Southern China.
The peak value of the annual ratio of TRHPEs to RHPEs (Fig. 5d) and TRHPE’s to TPEs (Fig. 5e) basically corresponds to the peak value of the annual TRHPE frequency, with a maximum in 1994. They all display an increasing trend from 1960 to 2018. The ratio of TRHPEs to TPEs has an upward trend at a rate of 0.14% (10 yr)-1which is statistically significant at the 5% confidence level.
Variations of the annual accumulated integrated index Z, and the five single indices for TRHPEs of China during 1960-2018 do not have apparent trends and all fail to pass the significance test, so the related figures are omitted. The annual extreme intensity has a weak increasing trend with a rate of 3.8 mm (10 yr)-1. They all had high values during the middle 1960s and the middle and late 1990s.
It is noted in Fig. 5d that the TRHPEs contribute only of the order of 20% to the RHPEs, consistent with 86 TRHPEs out of 454 RHPEs over the 59 years. This small percentage is mainly due to the fact that the RHPEs occur over all of China, as shown in the spatial distribution climatology of RHPE’s of Zou and Ren (2015), and that a large percentage of the RHPEs are associated with the Mei-Yu front.The seasonal variations of TRHPE frequency and extreme intensity are shown in Fig. 6. TRHPEs occur from May to October, with a maximum of 43 events in August followed by July with 24 events (Fig. 6a), consistent with the conclusion of Jiang and Qi (2016) that TC extreme precipitation occurs most frequently in July and August. Comparing Fig.6a with the distribution of RHPEs in Fig. 6 of Zou and Ren(2015), it is seen that the distribution of TRHPEs lags that of RHPEs, which have high frequencies in June and July.
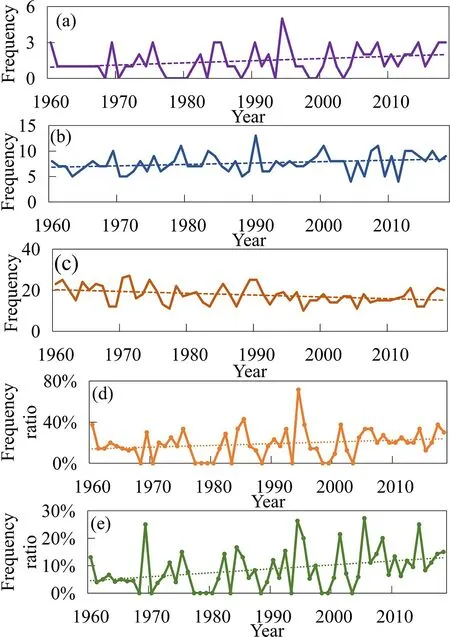
Fig. 5. Annual variations of (a) TRHPE frequency, (b) RHPE frequency,(c)TPE frequency, (d) ratio of TRHPEs to RHPEs, and (e) ratio of TRHPEs to TPEs (the dotted line represents the linear trend).

Fig. 6. Seasonal variations of TRHPEs over China during 1960-2018: (a) frequency; (b) maximum extreme intensity(mm).
Consistent with the frequency distribution, August is also the peak of the monthly maximum extreme intensity of TRHPEs, followed by July and October, with maximum extreme intensity exceeding 1000 mm (Fig. 6b). The frequency and extreme intensity of TRHPEs have seasonal characteristics, with a unimodal pattern in frequency and a bimodal pattern in intensity, though the apparent bimodal structure may possibly be due to sampling limitations.TRHPEs are prevalent in summer and have a high precipitation intensity, peaking in August, and rarely occur in spring and winter, which is consistent with the activities of tropical cyclones affecting China (Ren et al., 2011).
The spatial distribution of the frequency of TRHPEs is presented in Fig. 7a, showing that TRHPEs influence most of central and eastern China, especially the coastal regions,with a decrease in frequency from southeast to northwest.High-frequency values mainly affect southwest Zhejiang and coastal areas of Fujian with more than 30 events over the 50 years. Typically, less than 10 events influence northern China. Accumulative intensity shows high values above 3000 mm over coastal areas in Southeast and South China.The spatial distribution of accumulated intensity is consistent with that of frequency, with a decrease from southeast to northwest (Fig. 7b). It is noted that high frequency and accumulative intensity area spread from southeast to south China, which may be related to the westward movement of the prevailing typhoon track first proposed by Wu et al.(2005).
As shown in Figs.7c and 7d, the frequency and accumulative intensity during 1990-2018 are both higher than 1960-89, especially in some of the coastal areas of Southeast and South China. Frequency increases by 17 events in Xiamen, and accumulative intensity increases by more than 4000 mm in Alishan. This spatial distribution of the influence of the TRHPE is consistent with the earlier findings of Luo et al. (2016) on the contributions of TC events to extreme station precipitation over China.
To further analyze the increase in TRHPE frequency and accumulative intensity between the earlier and the later period, a mean intensity index for a specific type of event is defined:

where n is the number of events in a year, and miis the number of occurrences of single-station daily precipitation exceeding ≥100 mm or ≥250 mm during the event. MII is defined only when the n, the number of events, is non-zero.
As shown in Fig. 8, the mean intensity indices (MIIs) in tropical cyclone events (TPEs) have positive trends for both indices ≥100 mm and ≥250 mm, significant at the 95% confidence level. It is noted that MII also has positive trends at both 100 mm and 250 mm for general RHPE events, though not significant at the 95% level, (figures omitted). The increase in intensity of TPE events (as quantified by the MII indices) is consistent with the positive trends shown earlier in Fig. 5 for both the number of TRHPE events (Fig. 5a)and the percentage of tropical cyclone events that are classified as TRHPE events (Fig. 5e). So, it is reasonable to believe that the increasing trends in MIIs in TPEs have resulted in the insignificant upward trend of TRHPEs during 1960-2018.
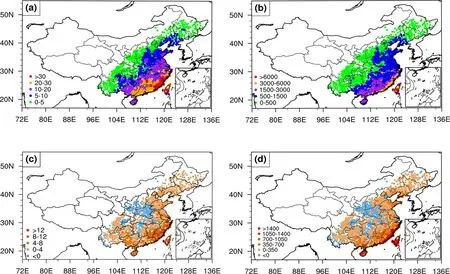
Fig. 7. Spatial distribution of TRHPE frequency and accumulated intensity ( I2, units: mm) over China.Frequency/accumulated intensity: (a/b) during 1960-2018, (c/d) the difference between 1990-2018 and 1960-1989 (later period minus earlier period).
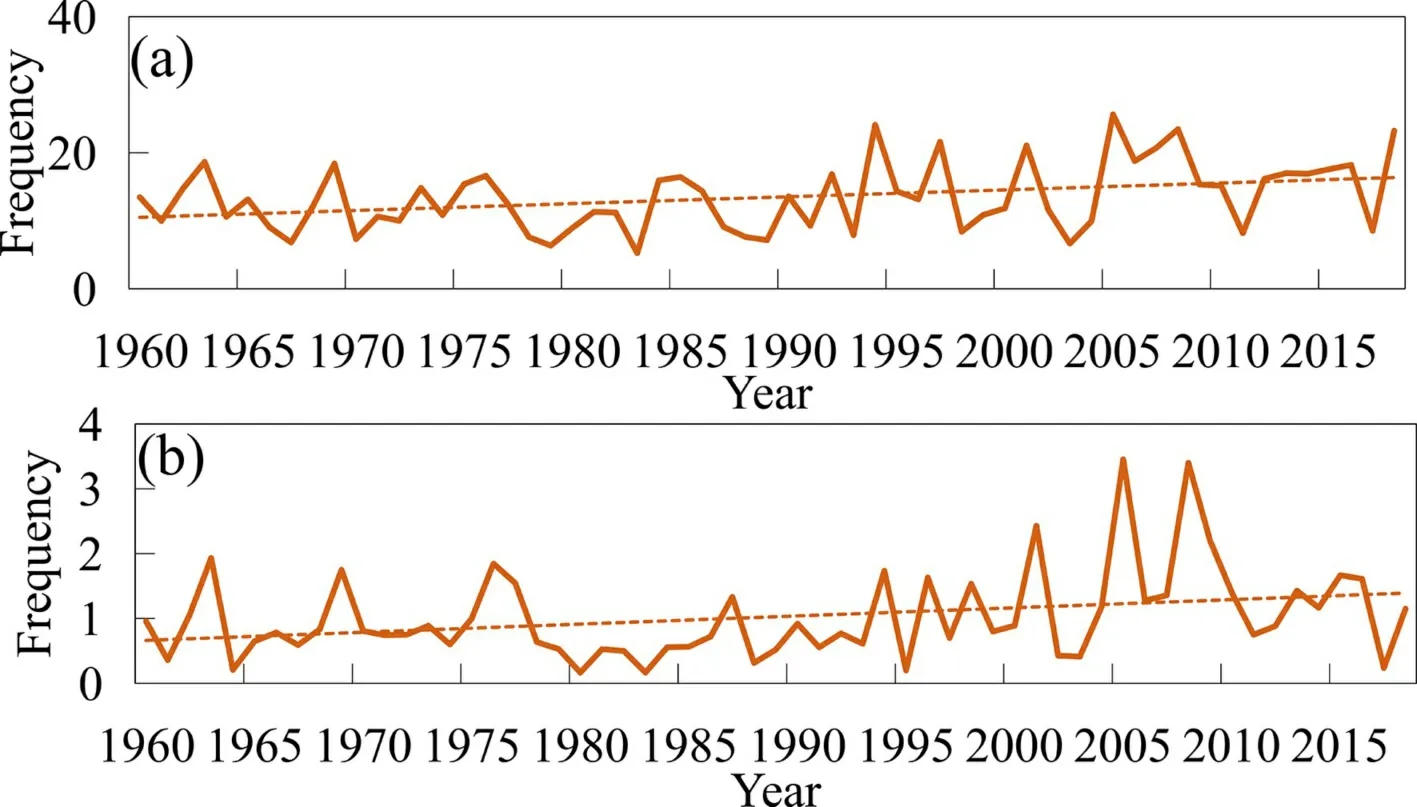
Fig. 8. Temporal variations of Mean Intensity Indices (MIIs) for tropical cyclone precipitation events (TPE) of grade (a) ≥100 mm, (b) ≥250 mm for the period 1960-2018.

Table 3. Correlation coefficients between internal variables of TCs (rows) and indices of the TRHPE (columns). The first two rows are the average and minimum TC translation speed during the TRHPE event. The third row is average TC intensity as measured by maximum wind speed during the TRHPE. The three columns are the precipitation volume, the maximum single-station daily rainfall intensity and the duration of the TRHPE event. Bold numbers are significant at the 90% level, with * at the 95% level, using nonparametric Kendall tau test.
To explore the possible roles of internal Tropical Cyclone variables on the characteristics of the TRHPEs, correlations were performed against seven indices of the TRHPEs,including the integrated index Z, the five single indices and the volume precipitation. Table 3 shows the correlations that were statistically significant. TRHPE extreme intensity is positively correlated with average TC intensity and has a negative correlation with the minimum cyclone translation speed. The correlations in the table make physical sense in that the slower the TC translation speed, the greater the integrated precipitation and the longer the TRHPE event duration. However, despite the statistical significance, the correlations are small. Trends were also examined for the internal TC variables, but no significant trends were found.Kossin (2018) indicated that the annual mean tropical cyclone translation speed shows significant slowdown trends over both land and ocean in the basin of the western North Pacific. However, our analysis for TPE events affecting China finds no significant long-term trend for either average TRHPE translation speed or minimum TRHPE translation speed.
A more promising line of investigation to understand the temporal changes shown in Fig.7 is the analysis of the variation in cyclone tracks between the earlier and the later period. Figure 9a shows that the number of TC tracks causing TRHPEs is 34 during 1960 to 1989 and 52 during 1990 to 2018 (Fig. 9b). The TRHPE TCs can be divided into two categories according to the tracks-the turning-track TCs landing on Southeast China and the westward-track TCs landing on South China. Inspection of the figures shows the number of TCs in the first category is greater than in the second category, which means that Southeast China is more frequently affected by TRHPEs than South China. In addition,the number of the first category of TCs increases from 11 in 1960-80 to 17 in 1990-2010, and that of the second category of TCs increases from 17 to 24.
5. Summary and discussion
This study extends our earlier research on Regional Heavy Precipitation Events to examine the role of tropical cyclones. To identify and define TRHPEs, three steps were followed: (1) the identification over the years of study of all RHPE and all TPE events; (2) establishing indices for identifying both temporal and spatial overlap between the two types of events; (3) establishing a standard for classifying an event as a TRHPE.
A total of 86 TRHPEs were identified over China from 1960 to 2018. These represent approximately 20 percent of the RHPEs in the same period. As shown in Fig. 4, more than 50% of the RHPE events with individual station daily rainfall exceeding 600 mm are associated with tropical cyclones. The seasonal variation of TRHPEs lags that of RHPEs and shows similar seasonal distribution to tropical cyclones with a peak in August. The spatial structure is that TRHPEs influence most of central and eastern China, especially the coastal regions.

Fig. 9. The TC tracks causing TRHPEs during (a) 1960-89 and (b) 1990-2018.
Inspection of the ten most extreme TRHPE’s reveals that for eight of the ten, the RHPE continues for 4 to 6 days after the TPE has finished. This indicates that a major contribution to RHPEs is rainfall occurring in the week following a typhoon landfall. This finding should motivate further research on understanding the role of landfalling typhoons on subsequent medium-range rainfall.
Temporal trends of frequency and extreme intensity of TRHPEs are positive, while the ratios of TRHPEs to RHPEs and to TPEs also exhibit upward trends with the ratio to TPEs being statistically significant. These long-term trends are mainly because of the significantly increasing trends in mean intensity indices in TPEs of both grade ≥100 mm and ≥250 mm. Spatial analyses reveal more serious impacts in coastal areas in Southeast and South China during 1990-2018 than 1960-89, which are more likely to be affected by socioeconomic disasters.
There is a statistically significant, but small, relationship between integrated TRHPE precipitation and minimum TRHPE translation speed in the sense that slower moving typhoons result in more TRHPE precipitation. Also, the slower TC translation speed is associated with longer duration TRHPE events. The complexity of these relationships requires further exploration. Tracks of cyclones contributing to TRHPEs fall into two distinct families, and the number in each has increased from 1960-89. A primary factor for the increasing trend in THRPE events may be that there has been a corresponding increase in the number of rainfall stations experiencing extreme daily rainfall (≥100 mm and≥250 mm) from a TC.
One of our primary purposes for studying extreme regional scale extreme events is to understand the impacts of climate change over China. Under the impact of human activities, climate change and its regional response are complex and diverse. More detailed studies will be conducted to understand the impacts of climate change on heavy precipitation. Here we have developed an objective definition for the tropical cyclone contribution to a regional extreme event and have produced the subsequent time series of TRHPE events. It is hoped these will contribute in a substantial way to ongoing studies. Such research will involve real-time monitoring of extreme regional precipitation events, diagnosing and making projections of long-term changes, and the understanding of mechanisms for changes in regional extreme precipitation events.
Acknowledgements. This work was supported by the National Key R&D Program of China (Grant No.2018YFC1507703), the National Natural Science Foundation of China (Grant No. 41675042), and the Jiangsu Collaborative Innovation Center for Climate Change. The authors would like to express their sincere appreciation to Dr. Jingxin LI and Mr. Haibo ZHOU for their kind help.
Open Access This article is licensed under a Creative Commons Attribution 4.0 International License, which permits use, sharing, adaptation, distribution and reproduction in any medium or format, as long as you give appropriate credit to the original author(s) and the source, provide a link to the Creative Commons licence, and indicate if changes were made. The images or other third party material in this article are included in the article’s Creative Commons licence, unless indicated otherwise in a credit line to the material. If material is not included in the article’s Creative Commons licence and your intended use is not permitted by statutory regulation or exceeds the permitted use, you will need to obtain permission directly from the copyright holder. To view a copy of this licence, visit http://creativecommons.org/licenses/by/4.0/.
 Advances in Atmospheric Sciences2022年2期
- Advances in Atmospheric Sciences的其它文章
- Growing Threat of Rapidly-Intensifying Tropical Cyclones in East Asia※
- Northward Shift in Landfall Locations of Tropical Cyclones over the Western North Pacific during the Last Four Decades※
- Climatology of Tropical Cyclone Extreme Rainfall over China from 1960 to 2019※
- A Climatological Perspective on Extratropical Synoptic-Scale Transient Eddy Activity Response to Western Pacific Tropical Cyclones※
- What Drives the Decadal Variability of Global Tropical Storm Days from 1965 to 2019?※
- Impact of the Western Pacific Tropical Easterly Jet on Tropical Cyclone Genesis Frequency over the Western North Pacific※
