Northward Shift in Landfall Locations of Tropical Cyclones over the Western North Pacific during the Last Four Decades※
Ting CHEN, Shumin CHEN*, Mingsen ZHOU, Chaoyong TU,Aoqi ZHANG, Yilun CHEN, and Weibiao LI
1School of Atmospheric Sciences, Sun Yat-sen University, Guangzhou 510275, China
2Southern Laboratory of Ocean Science and Engineering, Zhuhai 519082, China
3Guangzhou Institute of Tropical and Marine Meteorology, China Meteorological Administration,Guangzhou 510062, China
ABSTRACT This study analyzes landfall locations of tropical cyclones (TCs) over the western North Pacific during 1979-2018.Results demonstrate that the landfall locations of TCs over this region have shifted northward during the last four decades,primarily due to the shift of landfalling TC tracks, with the decreasing/increasing proportion of westward/northward TC tracks. In particular, the northward shift of the landfalling TCs was not related to their formation locations, which have not markedly changed, whereas “no-landed” TCs have significantly shifted northward. TC movement was significantly and positively correlated to the zonal component of the steering flow, while the correlation between TC movement and the meridional component of the steering flow was relatively unobvious. The westward steering flow in the tropical central Pacific that occurred around the formation and early development of the westward TCs was significantly weakened, which was unfavorable for their westward movement, thereby, causing the higher proportions of northward moving tracks. This weakened westward flow was related to the northward shift of the subtropical high ridge, which was caused by significant weakening of the southern part of the subtropical high. The vertical wind shear, sea surface temperature, and convective available potential energy also showed that the northern region of the western North Pacific became more favorable for TC development, whereas the upper divergence, low-layer relative vorticity, and accumulated water vapor content were not obviously related to the northward shift of TCs.
Key words: tropical cyclone, track, landfall location, northward shift, steering flow, background environment
1. Introduction
Tropical cyclones (TCs), characterized by strong wind and large amounts of precipitation, often cause catastrophic disasters and lead to significant economic losses and casualties, especially in China and surrounding areas, such as the Indochinese Peninsula, Korean Peninsula, Japan, Luzon,and Indonesian islands. Research shows that the impact from western North Pacific TC activities has increased in recent decades, specifically for China (Zhang et al., 2011).The impact becomes even more disastrous when TCs make landfall, owing to their power dissipations, causing large amounts of destructive power to impact coastal regions (Liu et al., 2020). Thus, although substantial progress has already been achieved in improving TC track forecasts, further improvements in determining landfall locations would be greatly beneficial. Simulations and comparisons between different TC cases were recently performed to investigate the mechanisms of TC movement and improve TC track predictions. For instance, previous studies have been able to improve TC track predictions using data assimilation,model systems, or deep learning methods (Qin and Mu,2012; Rüttgers et al., 2019). Despite these improvements,some uncertainties still exist in forecasting TC landfall locations based on their tracks.
TC tracks are impacted by large-scale environmental flow, the axially symmetric circulation of the TC, and the planetary vorticity gradient (Wang et al., 1998). Among these factors, large-scale environmental flows, which are referred to as steering flows, have the greatest influence on TC tracks; thus, they are often used to predict and analyze TC movement (Chan and Gray, 1982; Chan, 1984; Wu and Chen, 2016). Steering flows are closely related to largescale environmental circulation, especially the subtropical high (Chan and Gray, 1982). In addition, there are other factors that affect TC landfall, as TCs typically move toward regions with conditions that are favorable for their development. For example, Xu et al. (2013) found that TCs are more likely to move toward warmer land, and Wang et al. (2011) suggested that changes in TC tracks in recent decades are linked to the warming of the global sea surface temperature (SST).
Accompanied by global warming during recent decades (Zhao et al., 2020), factors related to TC movement also appear to be undergoing long-term variations, which have possibly led to changes in TC tracks. TC track changes was related to the long-term variation of TC itself (Wu et al., 2006) and the environmental factors. Investigations into the subtropical high in the western North Pacific show that there was a significant decadal shift in the late 1970s or early 1980s (He and Gong, 2002; Ye et al., 2015). The longterm variation of the subtropical high was also obvious during the late 1990s, which was related to the phase shifting of the Pacific Decadal Oscillation (PDO) from positive to negative approximately during 1998, as the geopotential height was highly correlated to the PDO index (Liu and Chan,2008; Tu et al., 2020). The Western Pacific Warm Pool began to warm after 1999 (Huangfu et al., 2015), which coincided with the westward relocation of the monsoon trough,which affected TC activity over the western North Pacific(Chen and Huang, 2008; Wu et al., 2012; Huang et al.,2018). Hu et al. (2018) reported that the synergy of the shifting El Niño-Southern Oscillation (ENSO) and 1998 Pacific climate regime contributed to the northwestward shift of autumn tropical cyclogenesis locations over the western North Pacific. Other studies have also identified a long-term northward shift of TC tracks. Based on numerical studies,He et al. (2015) and Shen et al. (2018) suggested that the SST climatological change in the western North Pacific caused a significant poleward shift of TC tracks. Using the TC trajectory model, Zhang et al. (2018) highlighted that TC activity has been suppressed in the South China Sea,whereas TC occurrences along the southeast coastal regions of China have increased. Moreover, Sun et al. (2019) analyzed the northward migration of TC occurrence over the western North Pacific based on a comparison of the periods 1982-97 and 1998-2018, suggesting that the large-scale environmental steering flow was responsible for the northward shift .
Based on the abovementioned results, the landfall locations of historical TCs were possibly affected by the longterm northward shift of TC tracks. As reported in some earlier studies (Wu et al., 2005; Wang et al., 2009; Yang et al., 2009), there was a decrease in TC landfalls over southern China and an increase over the northern regions of China. Considering that TCs making landfall in different western North Pacific countries are generally affected by the same large-scale systems (i.e., the subtropical high), landfall locations of TCs in the entire western North Pacific warrant a detailed analysis. Thus, this study aims to analyze the long-term variation in TC landfall locations and TC potential destructive power over the western North Pacific in relation to TC movements and background environmental factors. TCs generated during the peak of the season (July to October) from 1979 to 2018, over the western North Pacific were analyzed. The remainder of this article is divided into five sections: section 2 presents the data used in this study, section 3 describes the investigation of the long-term northward shift of landfalling TCs, section 4 describes the long-term variations in the related TC environment, and section 5 provides a summary and discussion of the findings.
2. Data
The China Meteorological Administration (CMA) TC Best Track Data were obtained from http://tcdata.typhoon.org.cn (Ying et al., 2014), and the best track data of the Regional Specialized Meteorological Center (RSMC)Tokyo - Typhoon Center were obtained from http://www.jma.go.jp/jma/jma-eng/jma-center/rsmc-hp-pub-eg/besttrack.html. Both datasets contain TC positions, minimum central pressures, and surface-level maximum wind speeds at 6-hour intervals during July-October, 1979-2018. TC genesis is defined by when a system reaches or exceeds tropical storm strength (a maximum wind speed equal to or greater than 17.2 m s-1). TC landfall locations pertaining to China were obtained from the CMA Tropical Cyclone Data Center (http://tcdata.typhoon.org.cn/), landfall locations for Japan were obtained from the Digital Typhoon dataset(http://www.digital-typhoon.org), and landfall locations for the remaining regions were defined as the positions where the TC first arrived on land based on the land-sea distribution obtained from the GEBCO Grid (https://www.gebco.net). Furthermore, the ECMWF ERA-Interim reanalysis dataset (https://apps.ecmwf.int/datasets/; Dee et al., 2011) with 6-hourly and monthly data from 1979-2018 and a spatialgrid resolution of 1° × 1° were used. These data were obtained to understand the variations in large-scale background environmental factors related to TC movement over the western North Pacific, including variables such as the meridional winds, zonal winds, temperature, specific humidity, relative humidity, and geopotential height at each pressure level, SST, and surface pressure. PDO index data from the WMO Regional Climate Center I RA II (Asia) (RCCs)(IPCC, 2007), Tokyo Climate Center, Japan Meteorological Agency was obtained from http://ds.data.jma.go.jp/tcc/tcc/products/elnino/decadal/pdo.html. Further analysis methods are presented before the results in each of the following sections.
3. Long-term northward shift in landfalling TCs and their potential destruction
The final landfall locations of TCs over the western North Pacific have exhibited a shift toward northern regions during the last four decades (Fig. 1). Considering that TC activity was suppressed in the South China Sea while the impact of TC on other coastal regions of China had increased during the last few decades (Zhang et al., 2018),the final landfall locations were divided based on whether the TCs influenced the South China Sea. Here, the final landfall locations were classified into two regions (Fig. 1a):region A includes the eastern side of the Indochinese Peninsula and the southern parts of China and the Philippines and the nearby islands (TCs that passed through the Philippines or the nearby islands and then dissipated over the sea were classified into this region); region B includes the eastern and northeastern parts of China, the Korean Peninsula, and Japan. The number and proportion of landfalling TCs in region A decreased significantly from 7.5 (57%) to 5.5(40%) (> 90% confidence level in Student’s t-test) during the 40-year period, whereas the proportion of landfalling TCs in region B increased by approximately 2 (17%) (>90% confidence level according to the Student’s t-test) during the same period (Figs. 1b and c) as shown by the values of the fitted regression line. According to the linear trend,the annual mean latitude of landfalling locations has significantly moved northward by more than 1° latitude during the 40-year period (Figs. 2a and b); the longitude of landfalling locations has not changed significantly (< 90% confidence level according to the Student’s t-test) (Figs. 2c and d).

Fig. 1. (a) Map of the western North Pacific with colored coastal lines that indicate regions A and B. (b and c) Number(red color using the left coordinate), percentage (black color using the right coordinate), and linear trendline of landfalling TCs in regions A and B, from CMA Best Track data. *indicates that the linear trendline of the TC numbers (red) or percentage (black) was above the 90% confidence level according to the Student’s t-test.
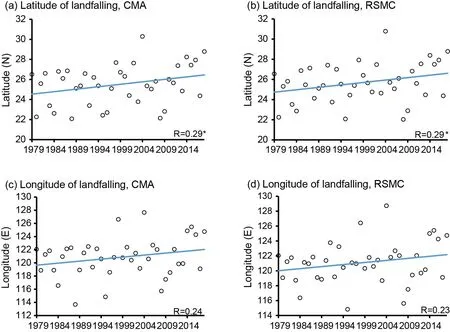
Fig. 2. (a and b) Latitude and (c and d) longitude of the annual mean landfall location of TCs with a linear trendline for CMA (a and c) and RSMC (b and d) Best Track data, respectively. * indicates that the linear trendlines were above the 90% confidence level according to the Student’s t-test.
Although the landfalling locations of TCs have shifted northward, the number of landfalling TCs over the western North Pacific has not significantly changed. The linear trend of the number of landfalling TCs for both best track datasets was below the 90% confidence level, though the number of total TCs decreased relatively obviously during the same period (Figs. 3a and b). Since the total TC numbers were the sum of landfalling TCs and “no-landed” TCs (TCs that have not landed anywhere during their lifetime), the decrease of total TC numbers was attributed to the decrease in the “no-landed” TCs. The causes of the decrease in the“no-landed” TCs warrant further investigations. In addition,their formation locations, including the longitudes and latitudes, have not significantly changed during this period, as none of these changes were significantly above the 90% confidence level according to the Student’s t-test based on the correlation coefficients, as shown in Figs. 3c-f. This suggests that the northward shift in TC landfall locations was mainly due to long-term changes in the trajectories of landfalling TCs. Notably, although the formation locations of landfalling TCs have not significantly changed during the recent decades, our results also show that the formation locations of the “no-landed” TCs have moved significantly northward(Fig. 4). Thus, our results are not in conflict with previous studies, which suggest that the formation locations of TCs have shifted northward during recent decades (i.e., Daloz and Camargo, 2018; Zhang et al., 2018; Sun et al., 2019),and features related to the tracks of landfalling TCs and“no-landed” TCs need to be further evaluated. Based on the linear trendlines in Figs. 3 and 4, the main difference between the “no-landed” TCs and landfalling TCs was the mean formation longitude, which was generally > 140°E for“no-landed TCs and generally < 140°E for landfalling TCs.This suggests that the formation locations of “no-landed”TCs were more eastward compared to the formation locations of the landfalling TCs. The tracks of “no-landed” TCs have moved closer to the continent during the analyzed 40-year period (figures not shown), but both the number and proportion of landfalling TCs have not significantly increased(Figs. 3a and b). Thus, a comprehensive analysis is needed in this respect. Moreover, Wu et al. (2015) reported that the annual mean formation location has shifted significantly westward during 1979-2009. Our results also show that the formation locations of landfalling (Figs. 3c and d) and “nolanded” (Figs. 4a and b) TCs have shifted slightly westward during this earlier period. The relatively weaker trends were possibly caused by the different averaging period,since our analysis only estimated TCs during July-October,whereas the previous report (Wu et al., 2015) estimated TCs for the entire year.
The northward shift in the landfall locations was related to the northward shift in TC tracks. Based on previous studies (Chan and Gray, 1982), the TC tracks were categorized into three types using their trajectories prior to landfalling.Figure 5 shows the distribution of the three types of TC tracks: westward or southwestward tracks, where the angle between the mean trajectory and due west was < 22.5°(Type A); northwestward tracks, where the angle between the mean trajectory and due west was > 22.5° (Type B); and redirected or northeastward TC tracks, where the trajectory changed to northward or northeastward from westward or northwestward before making landfall in regions A or B(Type C). As discussed in the introduction (section 1), an interdecadal shift in large-scale environmental conditions occurred after 1999 (Huangfu et al., 2015; Huang et al.,2018); thus, the analysis herein, is classified based on two periods (1979-98 and 1999-2018). Except for a few TC cases, the primary landfall locations for TCs of types A, B,and C were regions A, B, and B, respectively. All the locations of the TC tracks for the three types shifted northward during the last four decades (Figs. 5a, c, and e). Some of the Type A TCs made landfall in region B during the second 20-year period (Fig. 5a), which was consistent with the results of Cao et al. (2006) and of the Working Group I to the Fourth Assessment Report of the Intergovernmental Panel on Climate Change (IPCC AR4). In turn, more Type B TCs landed in northern China, Korea, and Japan after 1999. The number of TC tracks of varying types also changed significantly between 1979 and 2018. The number of Type A TCs decreased by approximately 1-2 (15%) during the last four decades (Fig. 6a), whereas the sum of the number of types B and C TCs increased by approximately 1-2 (15%) during the same timeframe (Fig. 6b), based on the values shown by the fitted regression line.
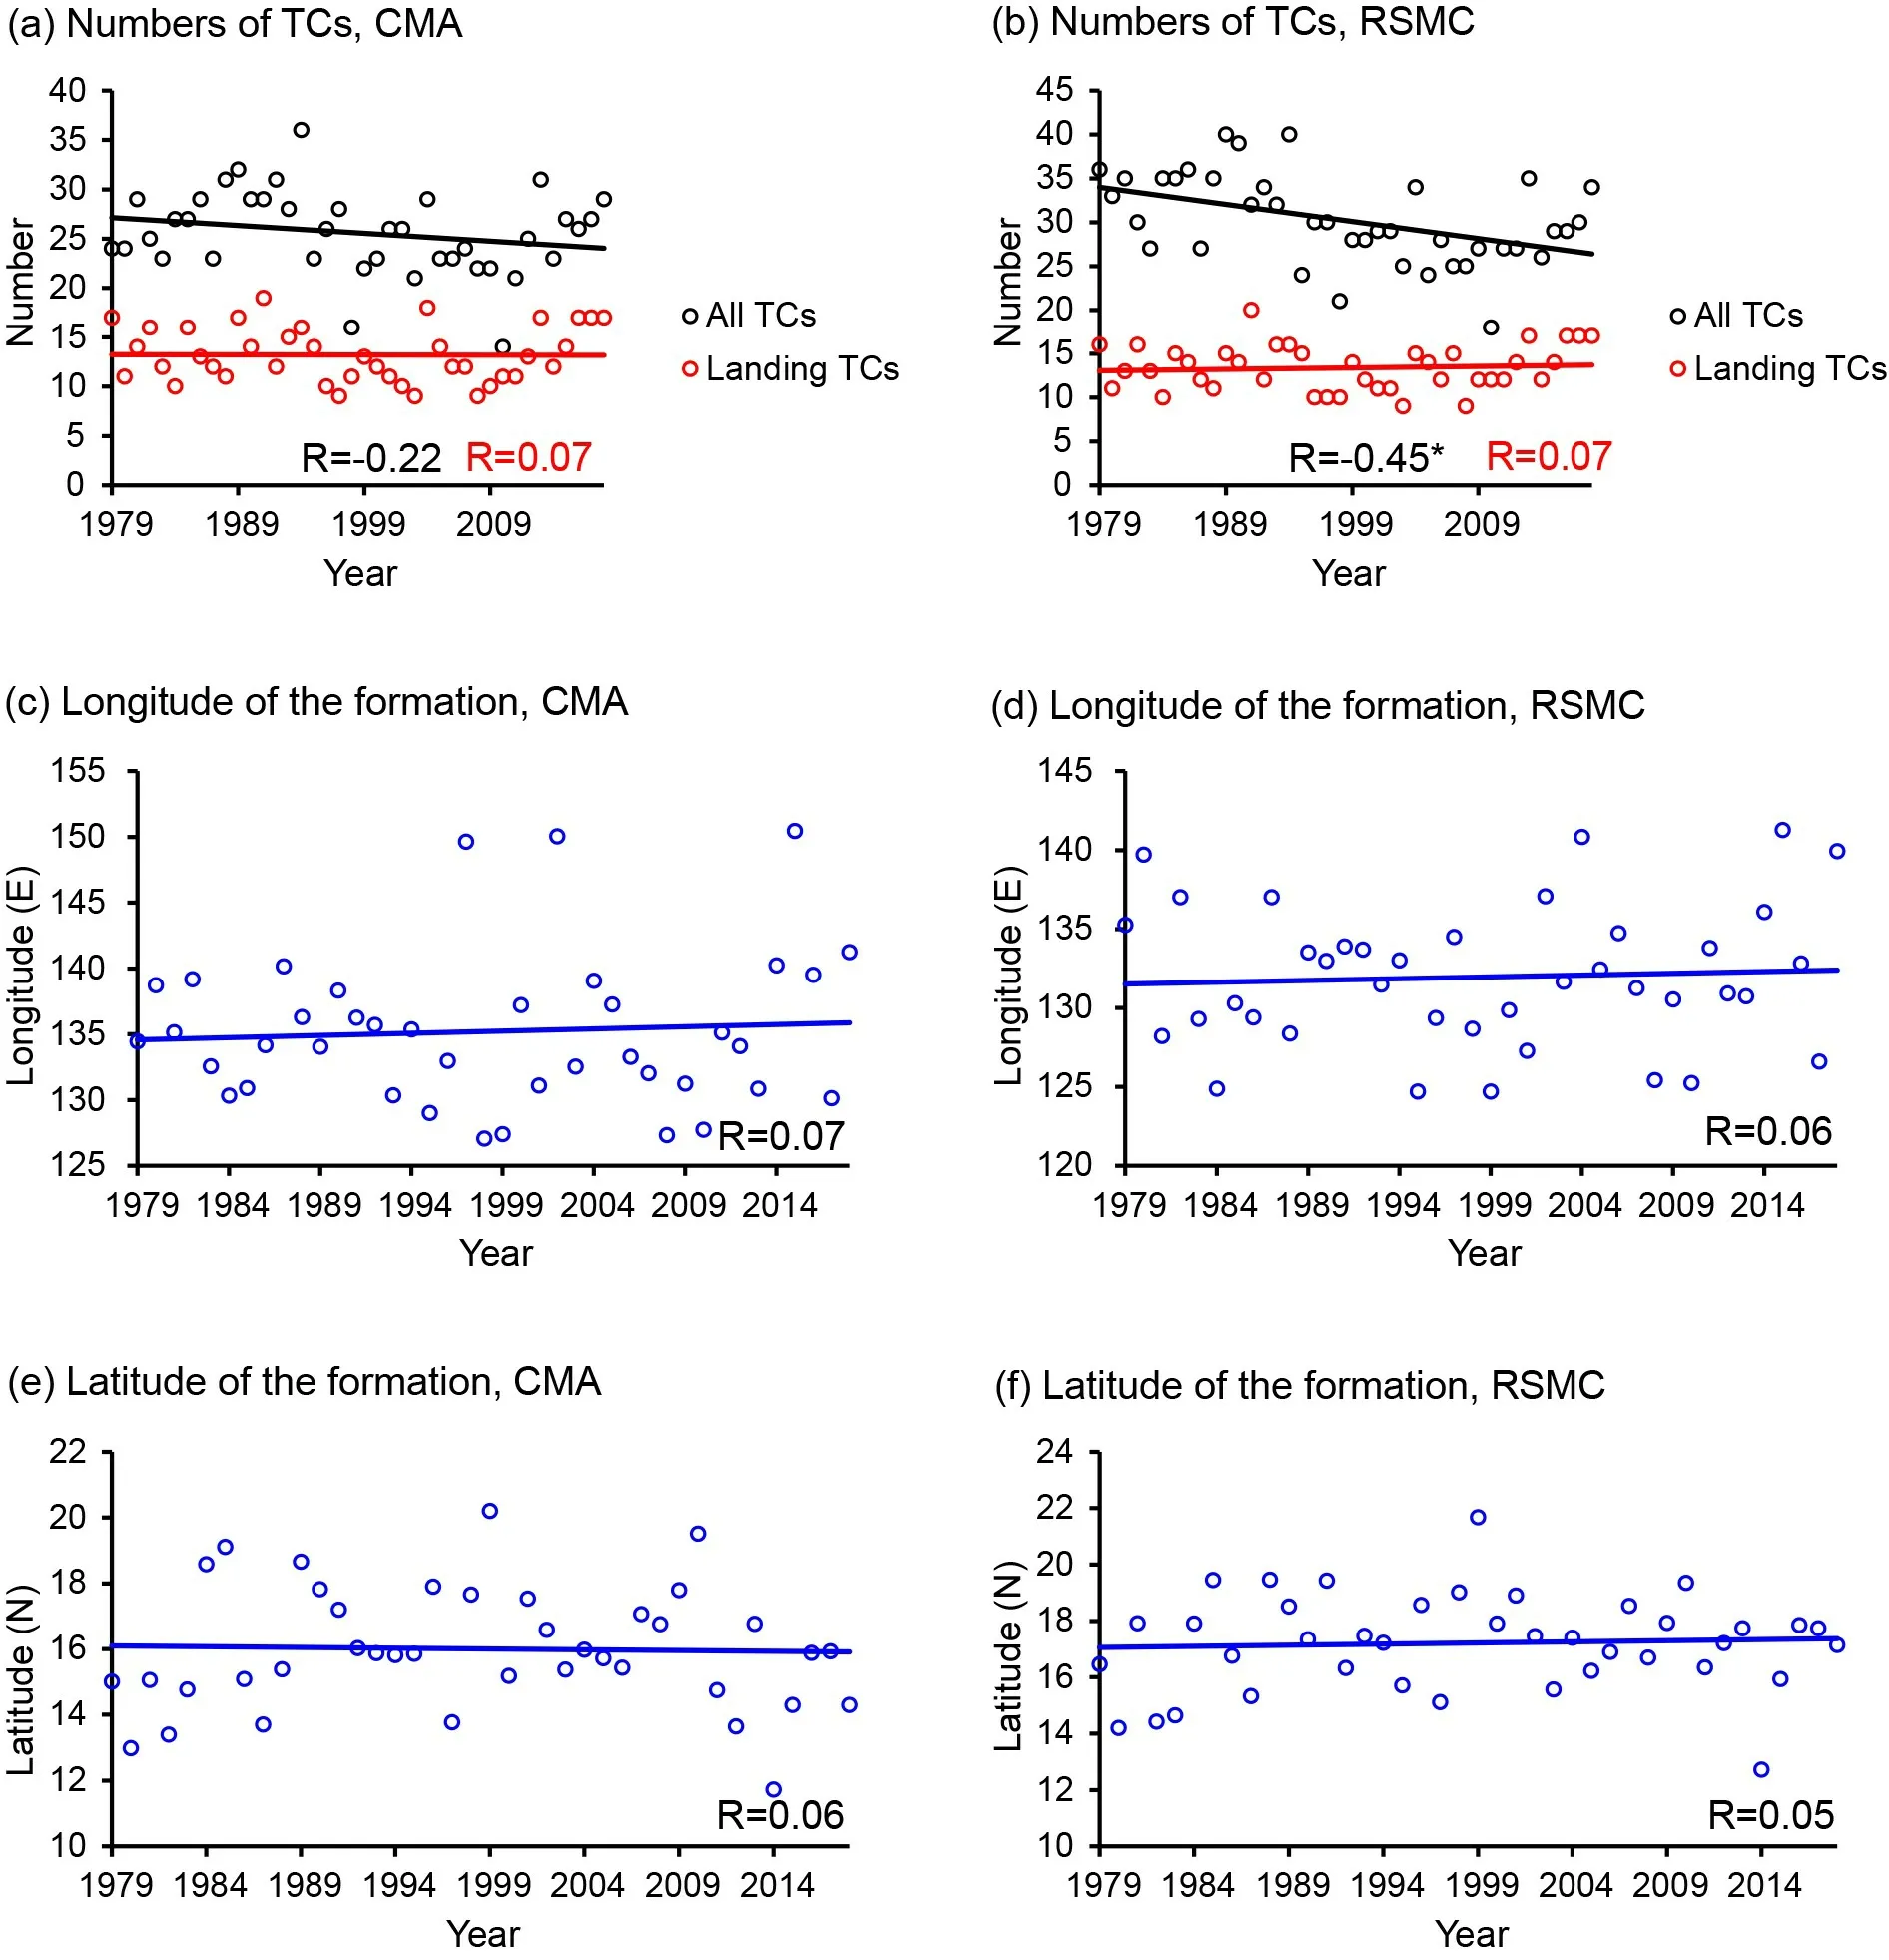
Fig. 3. (a and b) Number of all TCs and landfalling TCs in regions A and B with linear trendlines for CMA and RSMC Best Track data, respectively. (c and d) Longitude and (e and f) latitude of the annual mean formation location of the landfalling TCs with a linear trendline for CMA and RSMC Best Track data, respectively. * indicates that the linear trendlines were above the 90% confidence level according to the Student’s t-test.
The distribution of accumulated power dissipation during the TC period (SumPD; units: J m-2) was analyzed to infer the changes in the TC influence area and potential destruction (Figs. 5b, d, and f). Based on the studies by Emanuel (1999) and Sriver and Huber (2006), the SumPD can be estimated as:

Fig. 4. (a and b) Longitude and (c and d) latitude of the annual mean formation location of the “no-landed” TCs with a linear trendline for CMA (a and c) and RSMC (b and d) Best track data, respectively. * indicates that the linear trendlines were above the 90% confidence level according to the Student’s t-test.

whereCDis the drag coefficient, ρ is the dry air density,Vis the 10-m wind speed, τ is the duration of each TC, andnis the number of TCs. Wu et al. (2008) have explained that the changes in accumulated PDI are primarily because of the changes in the TC frequency, lifetime, and intensity.Thus, the distribution of PDI can reveal the areas where TCs occurred most frequently, as well as the regions influenced by the TCs. The strongest winds within TCs generally occur near, but several kilometers away from, their centers. Hence, large values of SumPD do not strictly reflect the locations of the TC tracks, but instead indicate the proximity of the tracks. Besides, TCs are relatively weak during their early stage and usually reach their maximum intensity shortly before landfall. Hence, the values of SumPD are large for the areas closer to the continents and are relatively small for the open oceans. Therefore, the distribution of the SumPD can reflect on the TC track to some extent, though it is not precisely representative of the location of the average TC track. Finally, some Type C TCs were active during the lifetime of Type A TCs; thus, the values near Japan, as shown in Fig. 5b, are relatively large. Overall, the high value center of SumPD is more northward and closer to the continent in the second 20-year period than in the first one.Moreover, the SumPD of Type A TCs decreased, whereas that of Type B and C TCs increased. This is possibly related to the northward shift of the TC tracks and the locations of their maximum intensity (Kossin et al., 2014; Gu, 2019).
Notably, the above analysis is based on the CMA Best Track data, and the reported findings are further confirmed using the RSMC Best Track dataset (Figs. 2b and d; Figs.3b, d, and f; and Figs. 4b and d). These results are similar to those found using the CMA Best Track data (Figs. 2a and c;Figs. 3a, c, and e; and Figs. 4a and c), except for the total TC numbers, which decreased sharply during the last four decades. Other results from the RSMC Best Track data (figures not shown) are also similar to those obtained using the CMA Best Track data shown in Figs. 1, 5, and 6.
4. Long-term variations in the background environmental conditions of TCs
4.1. Changes in the steering flow over the last four decades
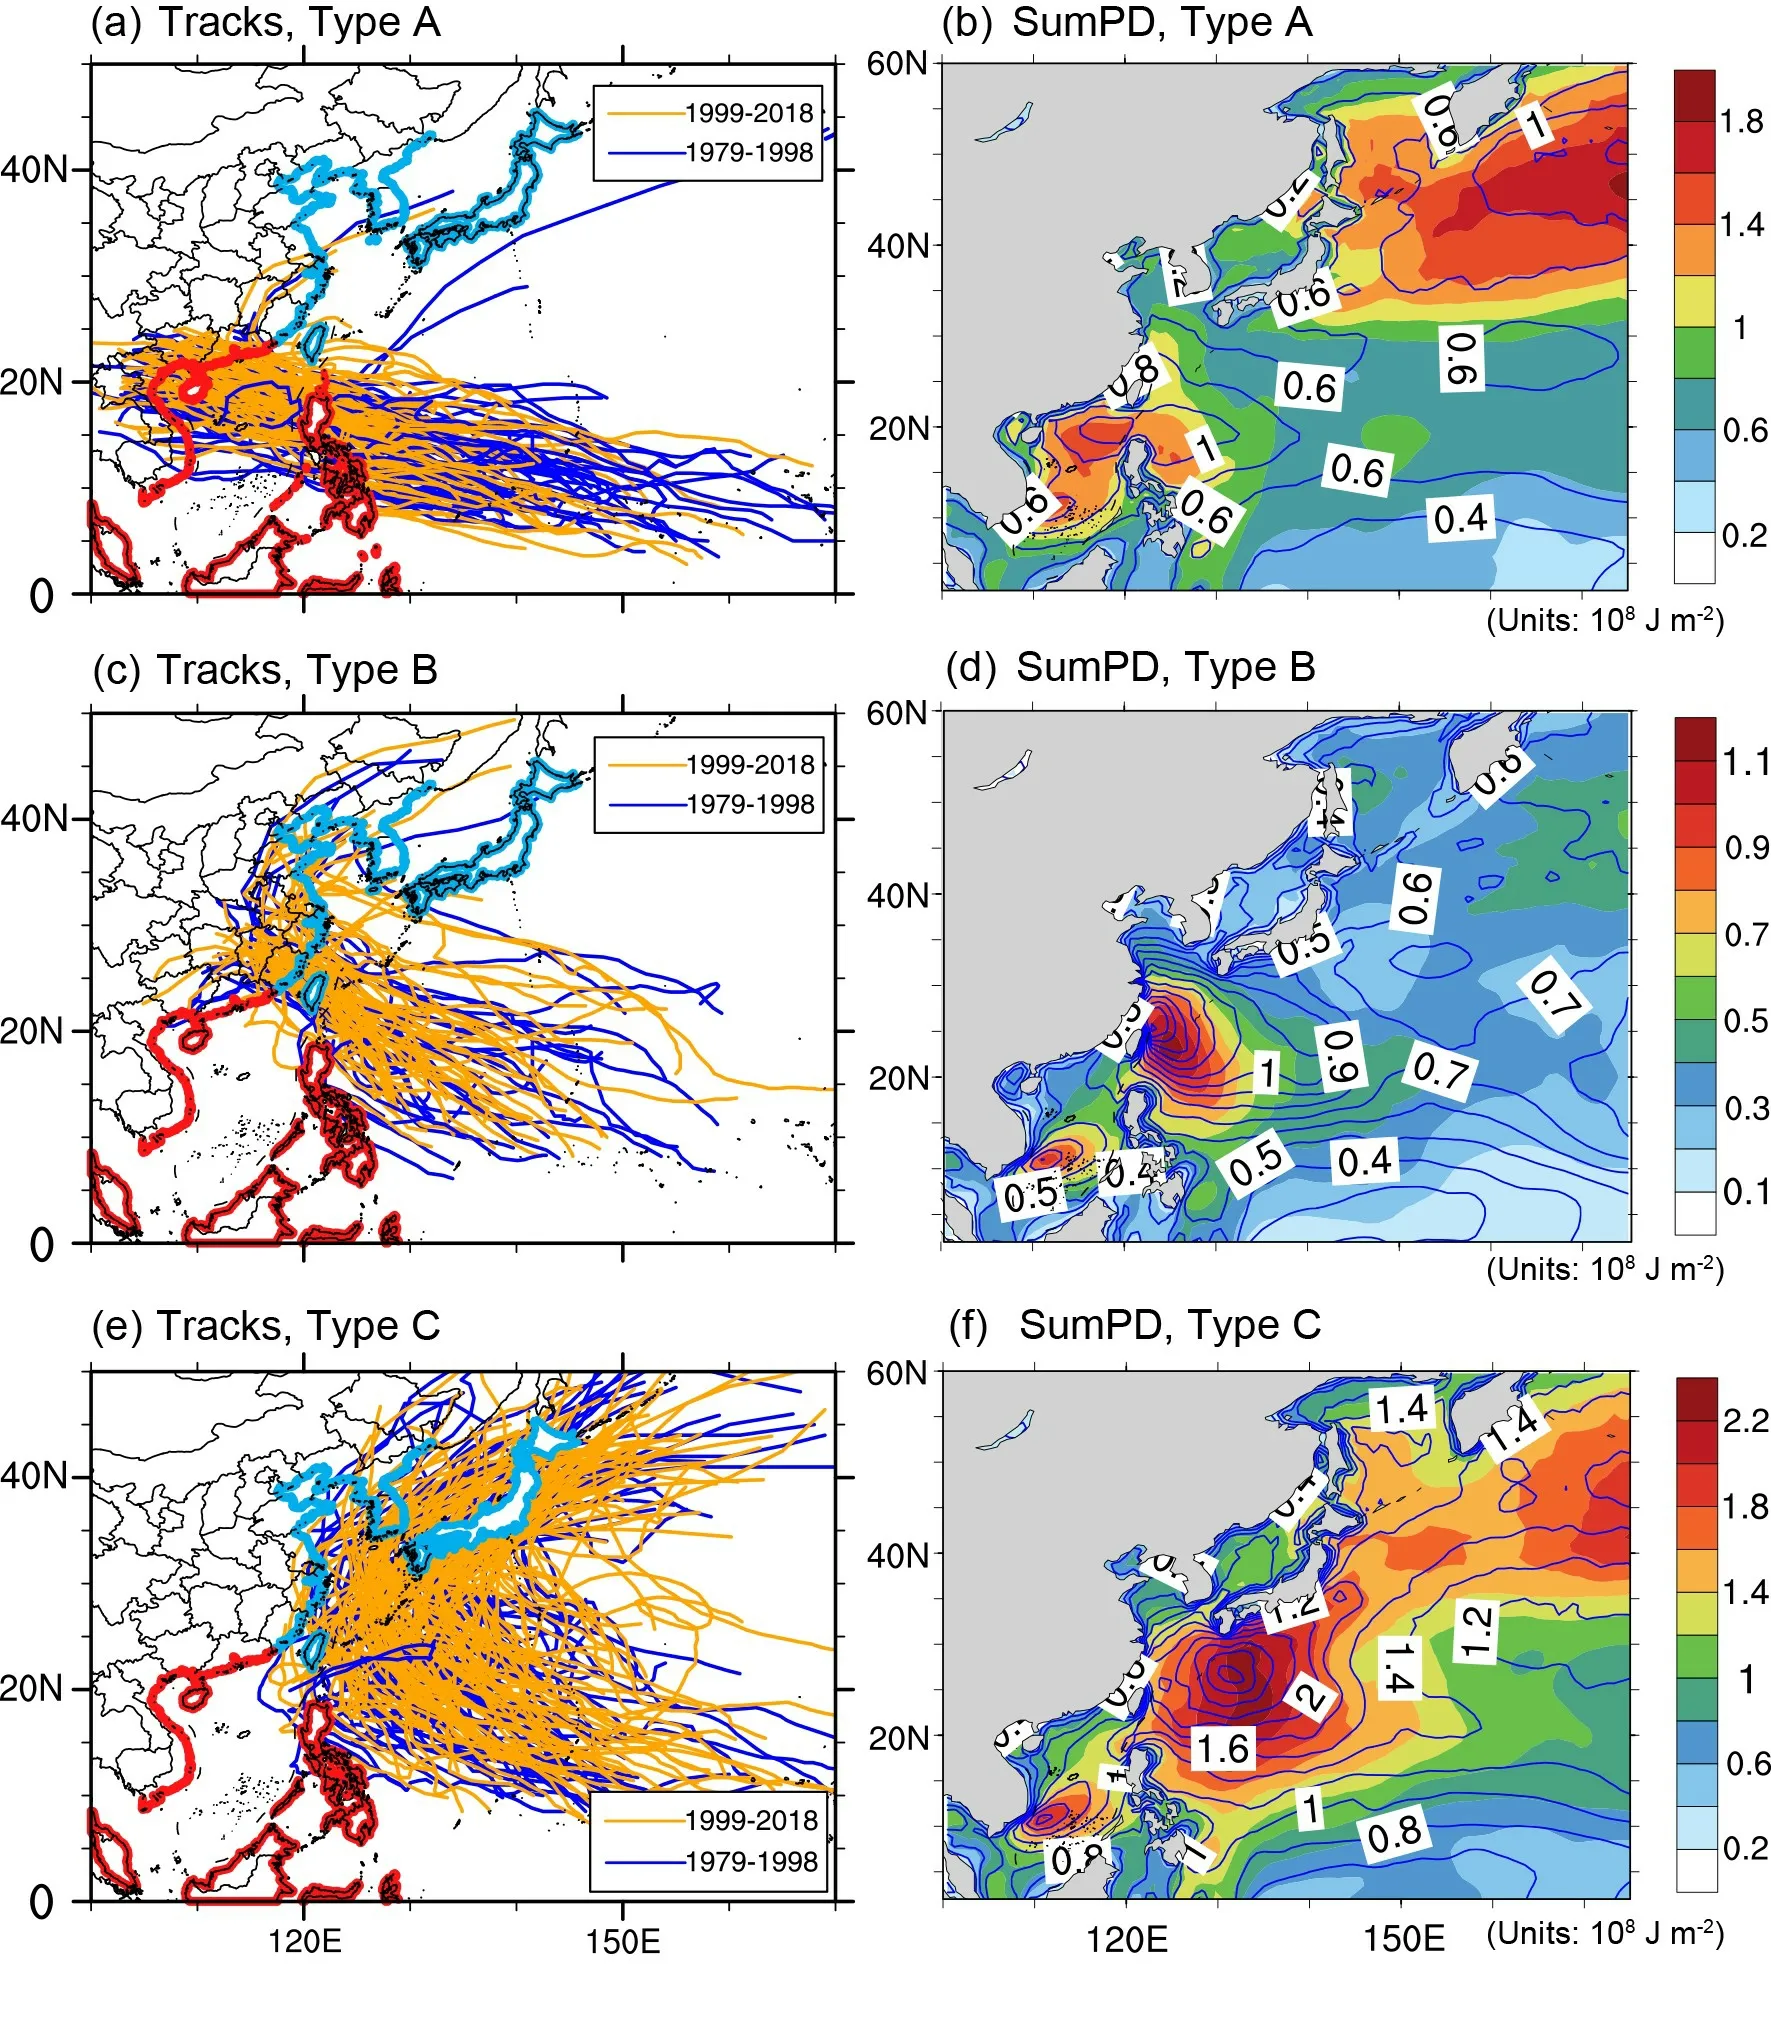
Fig. 5. TC tracks (a, c, and e) and their accumulated power dissipation (b, d, and f) during TC period (SumPD) (units:108 J m-2) for (a and b) Type A, (c and d) Type B, and (e and f) Type C TCs. Blue and orange lines in (a, c, and e) show the tracks of 1979-98 and 1999-2018, respectively, from CMA Best Track data. Shading and contours (b, d, and f) show the tracks of 1979-98 and 1999-2018, respectively, where the contour intervals are 0.2 × 10⁸ J m-2 for (b) and (f) and 0.1 × 10⁸ J m-2 for (d).
The annual correlation coefficient (R) between TC forward speed and simultaneous steering flow at the center of the TC for landfalling TCs was analyzed (Fig. 7). The steering flow was estimated by the mean wind from 300-900 hPa within a ring defined by the area between a 3°-9°radius from the TC center, based on the analysis of Peng et al. (2015). TheRwas estimated using the following steps:1) standardized TC motion and steering flow for each TC are calculated using Eq. (2):
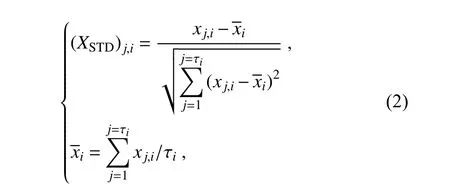
whereXSTDrepresents the standardized TC forward speed or steering flow of the zonal/meridional component,xis its original value at each time step,iis the TC number,jis the time step, and τiis the total number of time steps of this TC;2) using Eq. (3),Ris calculated using the standardized estimated variables for all landfalling TCs during July-October of each year,
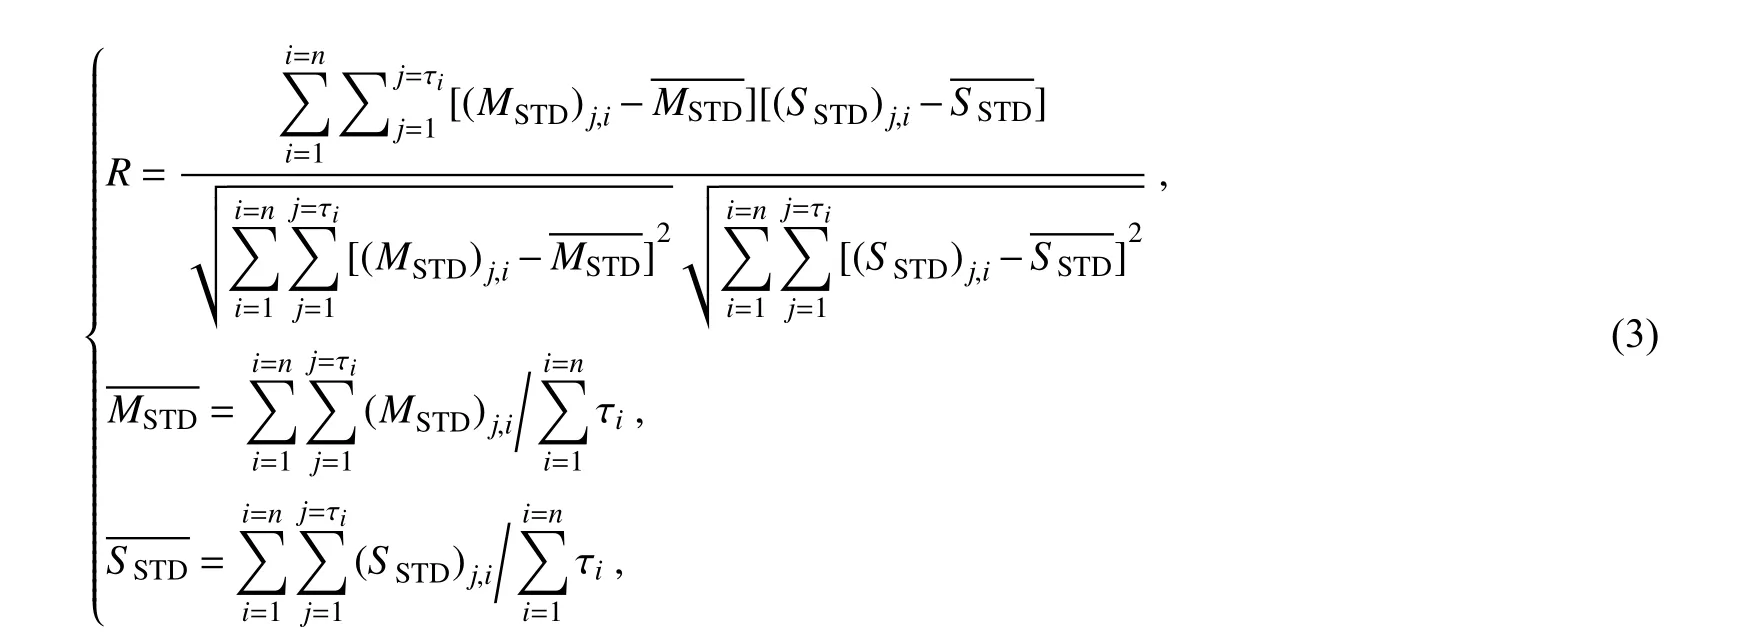
whereMSTDandSSTDrepresent the standardized TC forward speed and steering flow of the zonal/meridional component, respectively. As shown in Fig. 7, TC movement is significantly positively correlated to the zonal component of the steering flow, with annual correlation coefficients above the 90% confidence level according to the Student’s t-test. The correlation between TC forward speed and the meridional component of the steering flow was not strong, with annual correlation coefficients oscillating between positive and negative and several being below the 90% confidence level according to Student’s t-test.
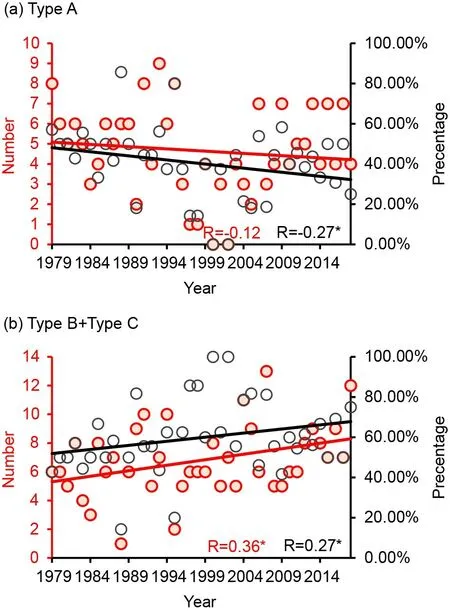
Fig. 6. Number (red color using the left coordinate) and percentage (black color using the right coordinate) of TC tracks of (a) Type A and (b) Types B and C with a linear trendline from the CMA Best Track data. * indicates that the linear trendline was above the 90% confidence level according to the Student’s t-test.
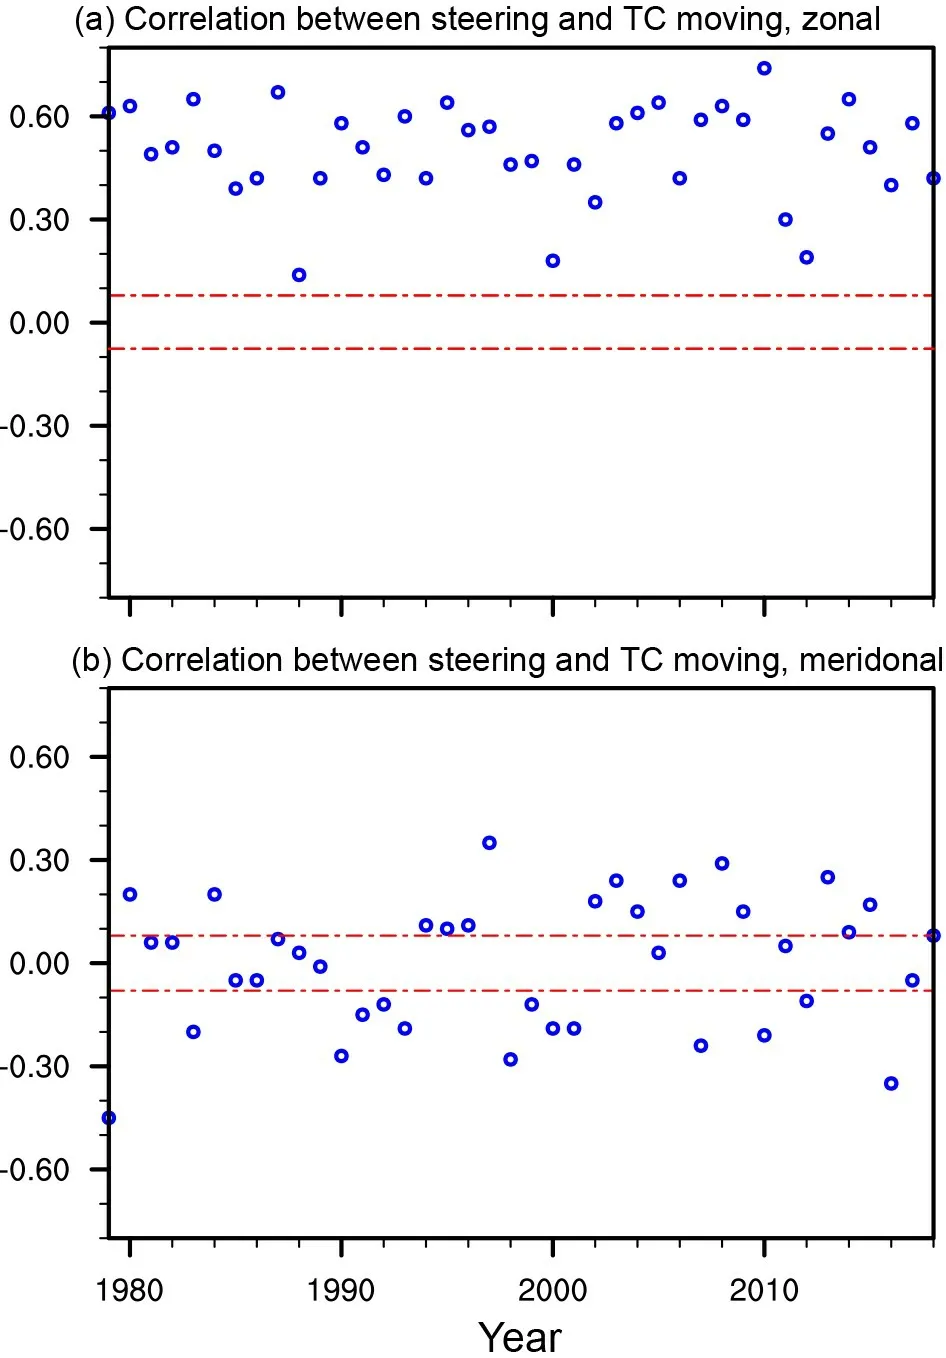
Fig. 7. Annual correlation coefficients between the TC forward speed and simultaneous steering flow at the same location as the TC center of landfalling TCs. (a) and (b) show the zonal and meridional component, respectively. Red dashed lines indicate the 90% confidence level according to the Student’s t-test.
Long-term changes in the steering flow of TCs at each horizontal grid point of data were analyzed. The easterly wind around the 110°-160°E and 5°-15°N-region was significantly weakened during both summer and autumn seasons,with the largest value being > 0.1 m s-1(10 yr)-1(Figs. 8a and c). Significantly positive trends in the zonal component of the steering flow occurred over this region, suggesting that the easterly wind (negative value) over this region was gradually weakened. Analysis of the mean steering flow at the locations of the landfalling TCs (Fig. 9) shows that westward steering flow at TC locations in the 110°-160°E and 5°-15°N-region was also significantly decreased (Fig. 9c).Here, the averaging area of the 110°-160°E and 5°-15°Nregion was defined based on the results shown in Figs. 8a and c, as discussed above. Further investigation also showed that the changes of the zonal component of the steering flow in the latitude zone of 5°-15°N were more obvious than in other latitude zones, and it is also more obvious than the changes of the meridional component at all latitude zones (figures not shown). As the formation and the early development of Type A TCs usually occurred in this region(Fig. 5a), the gradually weakened easterly wind was not favorable for the westward movement of TCs. Thus, the number of TCs that followed the westward track (Type A)decreased, leading to an increase in the proportion of landfall TCs in region B.
Previous studies have reported that the poleward shift of TCs was mainly related to the enhancement of the northward steering flow that is close to East Asia (Wu and Wang,2004; Shan et al., 2017; Li et al., 2020). This enhancement of northward steering flow is also observed in this study(Figs. 8b and d), and it is also verified by the results shown in Fig. 9b, although they are not as significantly related to the northward motion of TCs as the decrease of the westward steering flow over the tropical central Pacific (the region between 110°-160°E and 5°-15°N) mentioned earlier. Thus, the physical link between the zonal/meridional component of the steering flow and TC motion deserves additional attention. On one hand, as shown by Li et al. (2020), the values of the meridional component of the steering flow were not as large as those of the zonal component. The zonal component of the steering flow was generally three to five times of the meridional component(Fig. 8). On the other hand, besides steering flow, TC motion is also affected by other factors, including Coriolis force and internal TC dynamics (Zhang and Zheng, 2020).
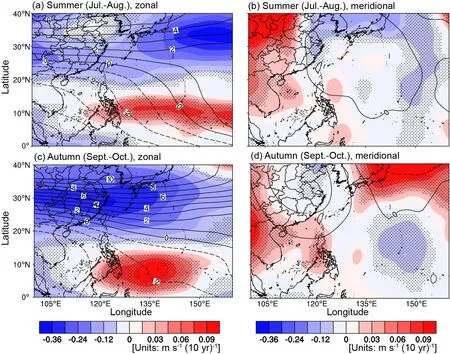
Fig. 8. Spatial distribution of linear trends [shading; units: m s-1 (10 yr)-1] and the mean value (contours; units: m s-1) of the zonal component of the steering flow for TCs during (a and b) summer (July-August) and (c and d) autumn(September-October) from 1979 to 2018. (a and c) and (b and d) show the zonal and meridional component, respectively.Dots indicate areas for the linear trends that were above the 90% confidence level according to the Student’s t-test.
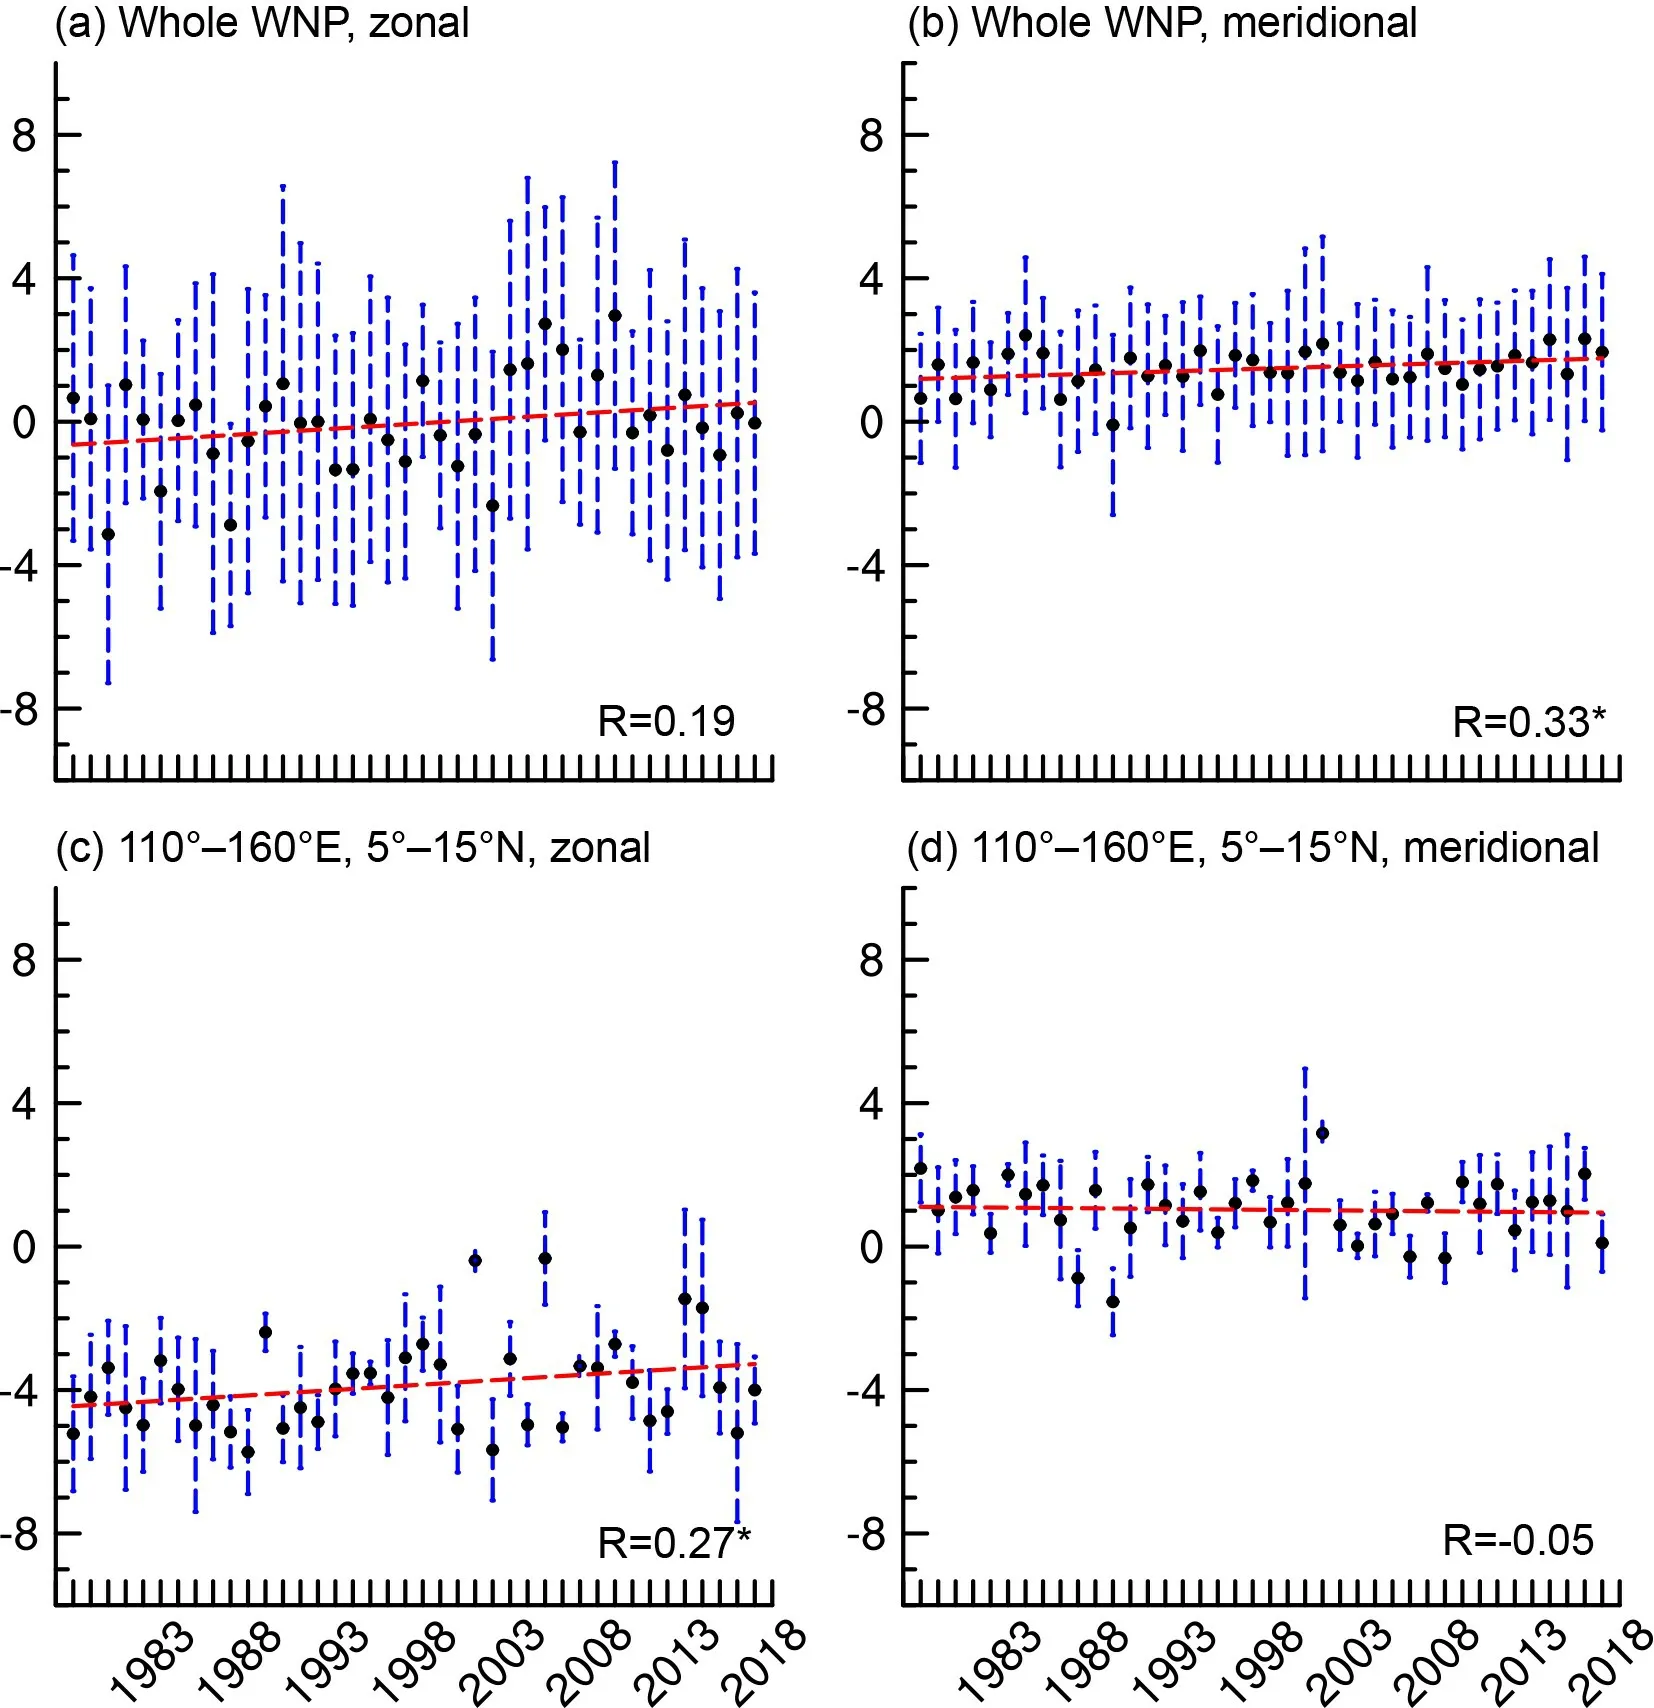
Fig. 9. Mean simultaneous steering flow at the same location as TC center with a linear trendline of landfalling TCs. (a and b) Whole western North Pacific (WNP). (c and d) Region of 110°-160°E and 5°-15°N. (a and c) and (b and d) show the zonal and meridional component, respectively. * indicates that the linear trendline was above the 90% confidence level according to the Student’s t-test.
4.2. Northward shift in the subtropical high ridge
The weakened easterly wind reflected in the zonal component of the steering flow in the tropical region over the western North Pacific was related to the northward shift in the subtropical high ridge. The linear trends in the subtropical high ridge show an average northward shift of approximately 1° during the last four decades (Fig. 10), owing to the weakening of the geopotential height in the southern part of the subtropical high during the same period (Fig. 11). The linear trends show an anomaly in the geopotential height at 500 hPa, which is relative to their mean value in the western North Pacific. This abnormality was estimated further to analyze the spatial variation in the subtropical high, avoiding interferential factors contributed by the overall pressure changes caused by the temperature changes of global warming; both variables are governed by the equation of state.The values at the southern part of the subtropical high (i.e.,10°-25°N for summer and 15°-20°N for autumn) significantly decreased over the last four decades, with numerous significant reduction values of > 0.2 gpm (10 yr)-1.
The weakened westward steering flow at the region near 110°-160°E and 5°-15°N was related to the northward shift in the subtropical high ridge. As the pressure and its meridional gradient were weakened at the southern part of the subtropical high ridge, the zonal winds were weakened, as per the geostrophic wind law. Thus, the westward steering flow of TCs was weakened. These changes were favorable for the northward shift in TC tracks during this period.
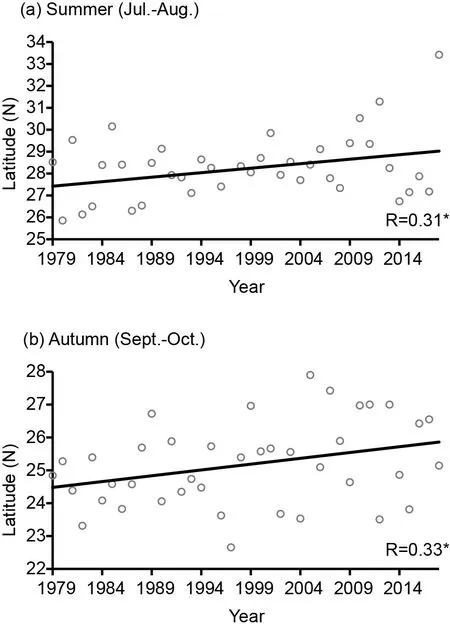
Fig. 10. Linear trendlines of the mean latitude of the subtropical high ridge for the (a) summer (July-August) and(b) autumn (September-October) of the TC season. * indicates that the linear trendline was above the 90% confidence level according to the Student’s t-test.
4.3. High-latitude areas in the western North Pacific turned favorable for TC development

Fig. 11. Spatial distribution of linear trends [shading; units:gpm (10 yr)-1] and the mean value (contours; units: gpm) of the abnormalities in the geopotential height at 500 hPa to their mean value over the western North Pacific during (a) summer(July-August) and (b) autumn (September-October) from 1979 to 2018. Dots indicate areas where the linear trends were above the 90% confidence level according to the Student’s t-test.


Fig. 12. Spatial distribution of linear trends [shading; units: m s-1(10 yr)-1] and the mean values (contours; units: m s-1) of the vertical wind shear over the western North Pacific during (a)summer (July-August) and (b) autumn (September-October) from 1979 to 2018. Dots indicate areas where the linear trends were above the 90% confidence level according to the Student’s t-test.
Vertical wind shear in the latitudinal zone of approximately 25°-40°N significantly decreased, especially during the autumn season (Fig. 12). The SST also largely increased in a similar latitudinal zone, with a maximum value >0.8 K(10 yr)-1(Fig. 13). The long-term linear trends of CAPE were favorable for the northward shift of TCs, as they increased in the higher-latitude region (>20°N) and decreased in the lower-latitude region (<20°N) (Fig. 14). In turn, the long-term changes of the upper divergence, low layer relative vorticity, and accumulated water vapor content were not obviously related to the northward shift of TCs (figures not shown). Thus, these findings suggest that vertical wind shear, SST, and CAPE at the latitudinal zone>20°-25°N became more favorable for TC development,and possibly contributed to the northward shift in TC tracks during the last four decades. The formation latitude of both landfalling and “no-landed” TCs was mainly <20°N (Figs. 3 and 4), while the more favorable environmental vertical wind shear, SST, and CAPE for TC development occurred at the latitudinal zone >20°-25°N. Thus, these favorable environmental conditions have negligible effect on the formation of TCs.
Of note, the long-term change in SST may have also contributed to the northward shift in the subtropical high ridge by weakening the southern portion of the subtropical high.The increase in SST in the tropical region (<20°N) was not as large as that in the higher-latitude zone (>25°N for summer and >20°N for autumn; Fig. 13), which weakened the SST gradient between the two regions. The difference in SST between the tropical and subtropical regions is the main factor influencing the generation of the Hadley Cell(Bellon and Sobel, 2010). As the subtropical high is one of the main components of the Hadley Cell, the southern part of the subtropical high (<20°-25°N) was possibly weakened. Moreover, TC track and landfalling may also be associated with remote SST anomalies. Gao et al. (2021)found that a warm SST anomaly in the western part of the western North Pacific in autumn can affect landfalling intense TC frequency through air/sea-coupled processes induced by a warm SST anomaly in the tropical North Atlantic during the spring season. In addition, Wang and Chen (2018) reported that a positive spring SST gradient between the tropical Indian Ocean and western North Pacific generates a zonal circulation between the regions,thereby inducing the cold SST anomaly in the western North Pacific and unfavorable conditions and steering flow for TC genesis and landfalls in China. A positive correlation between the Pacific Meridional Mode (PMM) index and landfalling TC frequency over China during June-November was investigated (Gao et al., 2020), revealing that the PMM can modulate large-scale circulation over the western North Pacific, thereby affecting steering flow and environmental conditions that determine TC landfalls and genesis location or frequency. Thus, the relationship between landfall location and remote SST anomalies warrants further investigation.

Fig. 14. Spatial distribution of the linear trends [shading; units:J kg-1 (10 yr)-1] and the mean value of the convective available potential energy (CAPE) (contours; units: J kg-1)over the western North Pacific during (a) summer (July-August) and (b) autumn (September-October) from 1979 to 2018. Dots indicate areas for the linear trends that were above the 90% confidence level according to the Student’s t-test.
5. Summary and discussion
The impacts of western North Pacific TCs in China have increased in recent decades, resulting in a need to improve our understanding of TC landfall positions and related TC tracks. Steering flows that are closely related to large-scale environmental circulation, including the subtropical high, have the greatest influence on TC tracks. Previous studies have shown that TCs typically move toward regions that are favorable for their development. Factors related to TC movement also appear to have long-term variations, which are accompanied by global warming (Zhao et al., 2020) and interdecadal changes in large-scale circulation, such as the PDO (Liu and Chan, 2008). The PDO are closely related to the subtropical high, have shifted toward the negative around 1998, suggesting it has a relationship with the long-term changes of TCs. Thus, the landfall locations of TCs are possibly affected by long-term variations.The present study focuses on improving our understanding of the northward shift in landfall locations of TCs over the western North Pacific by analyzing data for the period 1979-2018.
TC landfall locations and their potential destruction area in coastal regions over the western North Pacific have shifted northward in the last four decades; this is mainly due to the northward shift in TC tracks that do not exhibit any significant relationship with the number of the landfalling TCs and their formation locations. Previous studies have shown that the formation locations of TCs have shifted northward during the recent decades (Daloz and Camargo, 2018;Zhang et al., 2018; Sun et al., 2019). In contrast, the present study shows that only the formation locations of “nolanded” TCs have shifted northward, whereas the formation locations of landfalling TCs have not significantly changed during the recent decades. Thus, different features related to the tracks and formation locations between landfalling TCs and “no-landed” TCs require further evaluation.
Further analyses showed that TC movement was significantly and positively correlated to the zonal component of the steering flow, whereas the correlation between TC movement and the meridional component of the steering flow was not apparent. The easterly winds around the formation and early development area of westward TCs are significantly weakened, which is not favorable for the westward movement of TCs, causing the increased proportion of northward movement in TC tracks. Previous studies have mainly reported that the poleward shift of TCs is related to the enhancement of northward steering flow close to the East Asian continent (Wu and Wang, 2004; Shan et al., 2017; Li et al., 2020). However, our results have shown that the decrease in westward steering flow over the tropical central Pacific (110°-160°E and 5°-15°N-region) was more significantly related to the northward shift of TCs. Thus, the physical link between the zonal/meridional component of steering flow and TC motion warrants further analysis and discussion.
The weakened westward steering flow was related to the northward shift in the subtropical high ridge, which was caused by the significant weakening of the southern part of the subtropical high during the considered 40-year period.As discussed in the introduction (section 1), the long-term variation in the subtropical high is related to the variation of the PDO. Liu and Chan (2008) showed that the geopotential height at the southern part of the subtropical high is positively related to the PDO index, which was decreasing during the period considered, according to data from WMO RCCs. Thus, the southern part of the subtropical high was weakened. As mentioned in section 4, the weakened subtropical high may also be related to the difference in SST between the tropical and subtropical regions caused by the increased SST of the entire western Northern Pacific region.Hence, both the interdecadal variations (such as the PDO)and global warming have contributed to the northward shifting of TC tracks through impacts on the subtropical high and need more investigation.
The analysis of the vertical wind shear, SST, and CAPE also showed that the conditions in the high-latitude zone of the western North Pacific have become more favorable for TC development, whereas long-term changes of upper divergence, low-layer relative vorticity, and accumulated water vapor content were not obviously related to the northward shift of TCs. In addition, as per projections, the western North Pacific TC activity may shift poleward owing to the effects of the warming climate (Wu et al.2014; Kossin et al. 2016). This poleward shift is apparently associated with changes in environmental factors (Kossin et al., 2014). The Indian Ocean heat flux, East Asian summer monsoon (Wu et al., 2011), and Hadley cells (Sharmila and Walsh, 2018) may also play a role in the poleward migration of TCs.
Acknowledgements. This study was supported by the Fundamental Research Funds of the Special Program for Key Research and Development of Guangdong Province (Grant No.2019B111101002), Guangzhou Science and Technology Planning Project (Grant No. 201903010036), China Postdoctoral Science Foundation (Grant No. 2020M683021), National Natural Science Foundation of China (Grant Nos. 42075004, 41875021, and 41830533), and Key Laboratory of Tropical Atmosphere-Ocean System (Sun Yat-sen University), Ministry of Education.
 Advances in Atmospheric Sciences2022年2期
- Advances in Atmospheric Sciences的其它文章
- Growing Threat of Rapidly-Intensifying Tropical Cyclones in East Asia※
- Climatology of Tropical Cyclone Extreme Rainfall over China from 1960 to 2019※
- A Climatological Perspective on Extratropical Synoptic-Scale Transient Eddy Activity Response to Western Pacific Tropical Cyclones※
- What Drives the Decadal Variability of Global Tropical Storm Days from 1965 to 2019?※
- Impact of the Western Pacific Tropical Easterly Jet on Tropical Cyclone Genesis Frequency over the Western North Pacific※
- Tropical Cyclones over the Western North Pacific Strengthen the East Asia-Pacific Pattern during Summer※
