The Surface Energy Budget and Its Impact on the Freeze-thaw Processes of Active Layer in Permafrost Regions of the Qinghai-Tibetan Plateau
Junjie MA, Ren LI, Hongchao LIU, Zhongwei HUANG, Tonghua WU, Guojie HU, Yao XIAO,Lin ZHAO, Yizhen DU, and Shuhua YANG,,,,70000,
2University of Chinese Academy of Sciences, Beijing 100049, China
3Key Laboratory for Semi-Arid Climate Change of the Ministry of Education, College of Atmospheric Sciences,Lanzhou University, Lanzhou 730000, China
4School of Geographical Sciences, Nanjing University of Information Science & Technology, Nanjing 210044, China
(Received 18 February 2021; revised 17 August 2021; accepted 23 August 2021)
ABSTRACT The surface energy budget is closely related to freeze-thaw processes and is also a key issue for land surface process research in permafrost regions. In this study, in situ data collected from 2005 to 2015 at the Tanggula site were used to analyze surface energy regimes, the interaction between surface energy budget and freeze-thaw processes. The results confirmed that surface energy flux in the permafrost region of the Qinghai-Tibetan Plateau exhibited obvious seasonal variations. Annual average net radiation (Rn) for 2010 was 86.5 W m-2, with the largest being in July and smallest in November. Surface soil heat flux (G0) was positive during warm seasons but negative in cold seasons with annual average value of 2.7 W m-2. Variations in Rn and G0 were closely related to freeze-thaw processes. Sensible heat flux (H) was the main energy budget component during cold seasons, whereas latent heat flux (LE) dominated surface energy distribution in warm seasons. Freeze-thaw processes, snow cover, precipitation, and surface conditions were important influence factors for surface energy flux. Albedo was strongly dependent on soil moisture content and ground surface state, increasing significantly when land surface was covered with deep snow, and exhibited negative correlation with surface soil moisture content. Energy variation was significantly related to active layer thaw depth. Soil heat balance coefficient K was > 1 during the investigation time period, indicating the permafrost in the Tanggula area tended to degrade.
Key words: Qinghai-Tibetan Plateau, permafrost, energy budget, freeze-thaw process, thawing depth
1. Introduction
The Qinghai-Tibetan Plateau (QTP), with average altitude above 4000 m, is locally known as “The Third Pole of the Earth”. The QTP plays a significant role in the Asian monsoon and climate system (Pan and Li, 1996; Wu et al., 2005;Qiu, 2008; Han et al., 2017; Yang et al,. 2019a). Vast permafrost areas have developed across the QTP due to its altitude and specific climatic conditions. According to the recent work carried out over the QTP, the permafrost area covers about 1.06 million km2, occupying 42.4% of the total plateau (Zou et al., 2017). Permafrost forms a special underlying surface, with considerable impact on ground-air exchange, land surface processes, and hydrological cycles(Duan et al., 2012; Wang et al., 2016; Cao et al., 2018;Deng et al., 2020; Hu et al., 2020). Freeze-thaw processes are basic permafrost characteristics, with considerable impact on water cycles (Wang et al., 2003; Niu and Yang,2006; Lawrence et al., 2008; Yang et al., 2014; Wang and Yang, 2018) and ecosystems (Schuur et al., 2008, 2015;Chen et al., 2011; Zhu et al., 2019), causing significant changes in energy and moisture exchange between the land surface and atmosphere (Li et al., 2006; Stevens et al.,2007; Yang and Wang, 2019). Freeze-thaw processes also affect surface albedo, evapotranspiration, soil infiltration, runoff, and vegetation conditions, which consequently affect the surface energy budget (Yang et al., 2007; Guo et al.,2011a; Chen et al., 2014; Wu et al., 2016; Ma et al., 2021).Hence, soil freeze-thaw processes can extensively impact the climate.
Solar energy is an important climate factor and the basic driving force behind many physical and biological processes on the Earth’s surface (Prueger et al., 2004; Li et al.,2010). Thus, the solar radiation energy budget and distribution are bound to affect thermal mechanisms for the underlying surface. Several studies have confirmed that the land surface absorbs considerable solar radiation energy and undergoes intense seasonal changes in terms of surface energy flux (Ma et al., 2003; Yao et al., 2008; Guo et al., 2011b). Surface energy flux between land surface and atmosphere significantly influence atmospheric circulations, which drives climate systems from local to global scales (Eugster et al.,2000; Berbert and Costa, 2003; Yao et al., 2011; Hu et al.,2019). Therefore, it is essential to estimate energy flux exchange between land surface and atmosphere of the QTP.Relationships between surface energy fluxes and freezethaw processes could be meaningful, helping researchers to understand mechanisms affecting the active layer freezethaw process (Li et al., 2011; Wang et al., 2019, 2020).There have been significant advances in related research work on the QTP. Since the 1970s, scientists in China and abroad have studied QTP energy budgets theoretically and experimentally. The first meteorological science experiment on the QTP (QXPMEX, May-August 1979) (Tanaka et al., 2001, 2003; Ma et al., 2009) greatly promoted research into solar radiation and energy balance in the QTP.The second experiment considered in-depth observational studies of QTP surface energy and water processes, and hence climate change impacts. These experiments resulted in great progress toward understanding surface energy and water budgets, regional evaporative fraction, atmospheric chemistry, and climate change in the permafrost regions over the QTP (Li et al., 2007; Yao et al., 2008, 2011; Xue et al., 2013; Ma et al., 2014; Wang et al., 2019). Existing research has shown that permafrost formation and variations are related to radiative heat exchange with ground surfaces and the underlying radiation-heat balance structure(Yang et al., 2007; Li et al., 2013; Yao et al., 2020). These relationships are determined by net radiation, where the magnitude depends not only on global radiation but also on underlying surface conditions and net long-wave radiation (Zhou et al., 2000; Alados et al., 2003; Ogunjemiyo et al., 2005;Zhang et al., 2010). Previous studies provide a solid foundation for the study of the effects of the freeze-thaw process on the active layer in the QTP, but it is challenging to obtain in situ data due to natural QTP conditions, and surface energy budget variation effects on freeze-thaw processes in QTP active layer are relatively less well known. Hence, relationships between freeze-thaw processes and the surface energy budget are worthy of further elucidation to provide better understanding of land-atmosphere interactions on the QTP.
Considering the important role of freeze-thaw process in the surface energy budget, the main purpose for this paper are to: (1) explore surface energy flux characteristics and interactions with freeze-thaw processes; (2) discuss permafrost degradation trends in the Tanggula area from an energy budget perspective, given the background of global warming; and (3) analyze surface energy accumulation influences on permafrost thaw depths. Therefore, this study established a study area in the Tanggula mountain area of the QTP and gathered data from 2005 to 2015. Sections 2 and 3 describe the data and methods used in this study, and section 4 shows analysis results and discuss interactions between radiation flux and freeze-thaw cycles.
2. Site and data
The basic data used in this study were obtained from the established Tanggula site (91°52′E; 33°04′N and 5100 m) (Fig. 1) located in the hinterland of the QTP. The observation site is flat with open surrounding terrain, comprising grassy alpine meadow as the main land surface type with 30%-40% coverage (Yao et al., 2008; Li et al., 2019). Average annual air temperature is about -4.9°C, mean annual air pressure is about 538 hPa, and annual precipitation is about 436.7 mm (Gu et al., 2015). Active layer thickness is about 3.36 m (Li et al., 2012), and the soil is frozen from December to March. The active layer thaws from the ground surface beginning around the end of April. Generally speaking,the Tanggula site represents prevailing conditions of permafrost in the QTP hinterland (Gu et al., 2015).

Fig. 1. Map of the study area and the locations of the monitoring sites along the Qinghai-Tibetan Highway.The frozen ground map data were derived from Zou et al. (2017).
Data used in this study were primarily drawn from meteorological and active layer hydrothermal data on the Tanggula site from 1 January 2005, to 1 January 2015, but 2009 data is missing. Active layer hydrothermal data used in this study included soil temperature and soil moisture. Soil temperature was measured from 2-300 cm below ground by 105 T thermocouple probes with ±0.1°C accuracy. A Stevens Hydro probe was employed to measure soil moisture content with ±3% accuracy. Measurements taken by these sensors were recorded with a CR1000 data logger (Campbell Scientific). All instruments were sampled every 5 minutes and data were averaged over 30 minutes (Li et al.,2019). Meteorological data included soil heat flux, snow depth, precipitation, vapor pressure, air temperature, radiation fluxes, and wind velocity. Soil heat flux was monitored using HFP01 at 5, 10, and 20 cm below the surface with ±3% accuracy. Snow depth was measured by SR50-L,and precipitation was monitored using a T-200B weighing rain gauge (Geonor, Norway) with accuracy ±0.1 mm(Yang et al., 2020). Air temperature was measured by HMP45C-L at 2, 5, and 10 m above ground. Downward short-wave, upward short-wave, downward long-wave, and upward long-wave radiation fluxes were measured using a four-component net radiometer at 2 m above ground. Wind velocity was obtained using a 05103-L at 2, 5, and 10 m above ground. Meteorological sensors were connected to a CR23X data logger (Campbell Scientific) and data were recorded in Local Standard Time (LST, LST = UTC + 8). Table 1 provides detailed information of the instruments related to the study at Tanggula site.

Table 1. Observation items and instruments.
3. Methods
3.1. Net radiation
The net radiation (Rn) was calculated from the four radiation components according to the following equation:

whereS↑ andS↓ are upward and downward short-wave radiation (W m-2), respectively; andL↑ andL↓ are upward and downward long-wave radiation (W m-2), respectively.
3.2. Ground heat flux
The ground heat flux (G0) was calculated according to the following equation:

whereGzis observed soil heat flux (W m-2) at a depth ofzcm, herezis 5 cm, andCsis soil volume heat capacity(J m-3K-1), additionally, in the north QTPCsvalues were suggested to be 1.18 × 10⁶J m-3K-1(Tanaka et al., 2001).
3.3. Sensible and latent heat flux
Sensible and latent heat flux (Hand LE, respectively)were calculated by the Bowen ratio method (Bowen, 1926)according to the following equations,
and


whereβis the Bowen ratio, calculated using the Gao and Wen (1996) scheme,

whereuis surface wind velocity (m s-1),eis vapor pressure (hPa), andris water available for evaporation, which is replaced by average precipitation for the current and previous month.
Comparisons with the eddy correlation method have been carried out. According to the assessment of Ji et al.(2002) of the characteristics of the atmospheric heating field in the northern QTP, the results forHusing this scheme were slightly larger than that using the eddy correlation method, and results for LE were more dependent on monthly precipitation. Changes also varied with total precipitation each year. In general, calculations using the proposed scheme are relatively simple, and hence it provides an ideal alternative in the absence of eddy correlation data. Thus, the proposed scheme can be used to accurately calculateHand LE in the study area.
3.4. Surface albedo
Average daily surface albedo was calculated by dividing total reflected solar radiation of the day by total solar radiation for the day,

whereR(t) andQ(t) are reflected and total radiation flux density, respectively; and -t0andt1are sunrise and sunset times,respectively.
4. Results and Discussion
4.1. Annual surface energy budget change characteristic
Net radiation combines effects from various radiation components and a factor that characterizes radiant heat exchange in the Earth’s climate system, reflecting net radiation budget at the ground surface, which has great impact on shallow soil temperature. Therefore, the changes of the air temperature and shallow soil temperature are in good agreement with the annual changes inRn(Wang et al.,2019). As can be seen in Fig. 2,Rnincreases sharply from March to April, with corresponding significant soil temperature increase (Fig. 3). However,Rndecreases rapidly from September to October with significant soil temperature cooling (Figs. 2 and 3). The energy jumps from March to April and September to October are related to the seasonal changes of the QTP. Overall, step increases in radiant energy during spring and sharp declines in autumn greatly promote rapid atmospheric circulation conversion from spring to summer and autumn to winter in the QTP (Ji et al., 2002).
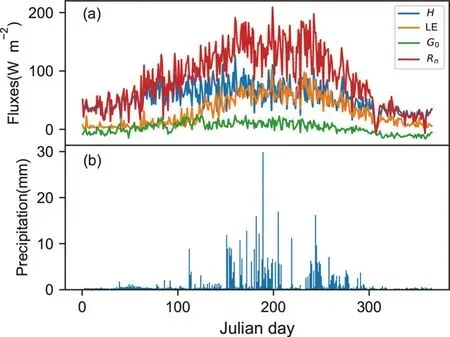
Fig. 2. Process variations for several factors at Tanggula, in 2010: (a) surface energy fluxes (units: W m-2), and (b) precipitation (units: mm).

Fig. 3. Active layer (a) soil temperature (units: °C) and (b) moisture profiles(units: m3 m-3) at Tanggula in 2010.
Ground heat flux (G0) reflects heat transfer between underlying surface and topsoil, and variations are mainly due to the difference in soil temperature and the underlying surface. Fluctuations inG0are very consistent withRn, following its seasonal variation. HenceG0exhibits significant seasonal pattern (Fig. 2a), and both exhibit unimodal changes peaking in summer and plunging in winter.G0was positive from April to September and negative from January to March and October to December. Thus, the soil absorbs heat from the surface during summer and then spreads it downward, whereas it releases heat upward during winter.Figure 3a shows that positive and negative changes inG0are basically consistent with freeze-thaw processes of the active layer. Vertical changes in the soil temperature in the active layer (Fig. 3a) suggests that the soil starts to freeze in October and the freezing process ends in November. Soil temperature is negative from November to March of the following year. Thus, the negativeG0period is consistent with the freezing period.Rngradually increases due to seasonal variations in solar altitude, and soil temperature also increases due to surface energy accumulation (You et al., 2017). Soil temperature is positive from mid to late April, with the frozen surface (0°C line) gradually moving downward to reach maximum depth in late September. The active layer is thawing andG0is positive during this period.
Rapid changes inRn(compare Figs. 2a and 3a) promote cold and warm season transition, which is very closely related to freeze-thaw processes in the active layer. The active layer begins to thaw during the conversion process,whereas it begins to change from warm to cold season when local surface energy budget falls sharply from September to October, and the active layer soil begins to freeze. In general, the freeze-thaw cycle of the active layer is closely related to the surface energy budget (Gu et al., 2015).
Sensible and latent heat flux (Hand LE, respectively)are major terms in the surface energy balance equation. Figure 2a also illustrates the annual trends ofHand LE in Tanggula area in 2010. Seasonal trends inHand LE are obvious,withHrelatively high in spring, reduced during summer,then gradually increasing in autumn. In contrast, LE exhibits the opposite seasonal pattern, and dominates the energy budget in summer and autumn, whereasHis dominant in winter and spring.His consistent with annual variation ofRn.Rnis small during winter when surface soil is frozen.Therefore,His smallest. The significantRnincrease in spring increases surface temperature, and the active layer begins to thaw. During this stage, radiation is mainly converted intoH, which displays the highest value during the year.The summer monsoon arrival in QTP increases precipitation and hence increases soil moisture content (Fig. 2b), and vegetation begins to grow (Li et al., 2019). This makes the increase in LE particularly obvious in summer. In contrast,Hdecreases in summer andHchanges in autumn are less obvious than for summer.
Seasonal variation trends for LE are more obvious and are more affected by rainfall and shallow soil moisture (compare Figs. 2 and 3), consistent with Wang et al. (2019). The rainy season at Tanggula is coincident with the summer monsoon, which usually starts in May and ends in October (Fig.2b) (Yang et al., 2000). This period also corresponds to the thawing period of the freeze-thaw cycle of the active layer.As illustrated in Fig. 3b, shallow soil moisture content attained a maximum during this period. LE increases significantly from April due to increasing air temperature, land surface temperature, and soil moisture content, reaching a maximum in July and having the most impact on the surface energy balance. The soil begins to freeze in October to November with decreasingRnand liquid water content in the topsoil layer. Precipitation also decreases sharply during this period, and hence LE also decreases. Four seasonal freeze-thaw regimes can be divided in the active layer above permafrost, which are the spring warming regime(SW), the summer thawing regime (ST), the autumn freezing regime (AF), and the winter cooling regime (WC) (Zhao et al., 2000; Hinkel et al., 2001). The different freeze-thaw regimes and monthly average values ofH, LE, and Bowen ratio are summarized in Table 2. During the SW, the change inHis much larger than LE, i.e., heat exchange is mainly based on sensible heat transport. When the ST arrives, LE increases rapidly as precipitation increases, becoming equivalent toH. Bowen ratio gradually decreases at this stage. LE increases sharply from July to September with the arrival of the QTP rainy season, surpassingHand taking a dominant position. LE subsequently decreases rapidly during the AF,owing to reduced precipitation and surface soil moisture content, andHdominates surface energy budget during the WC.
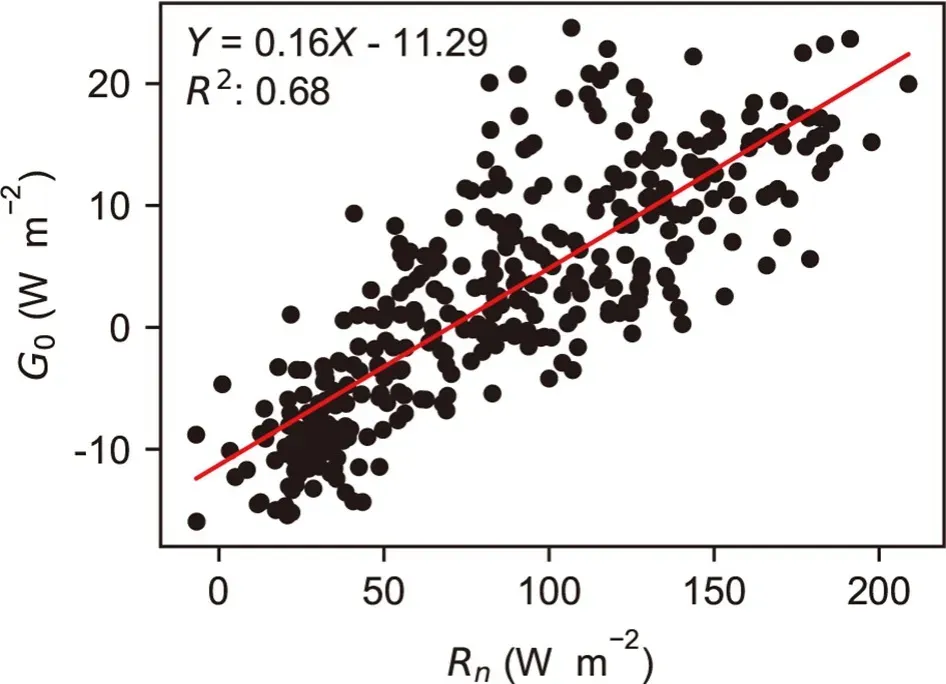
Fig. 4. Surface heat flux (G0, units: W m-2) and net radiation(Rn, units: W m-2) using 2010 daily average data at Tanggula.
There is strong interaction between soil hydrothermal processes and surface energy regime throughout the active layer (Yang and Wang, 2019). The most important factors influencing surface energy budget variation from April to May are triggered by freeze-thaw processes (You et al.,2017). Rapidly increasing soil moisture during soil thawing causes a dramatic LE increase. The monsoon arrival over the plateau after May significantly increases soil moisture,and hence LE increases more rapidly to exceedHin the summer (Yao et al., 2020). Next, the active layer begins to freeze by the end of September (Zhao et al., 2000), and decreasing soil moisture suppresses LE increases. Reduced surface radiation reduces soil temperature, resulting in reducedH. Thus, energy flux variations are mainly affected by freeze-thaw processes and the monsoon, and different factors dominate in different seasons (Wang et al., 2019).
Daily trends and fluctuations forG0exhibit good agreement with those forRn. Thus,G0was significantly affected byRnon a daily scale. Figure 4 shows that the relationship betweenRnandG0in the Tanggula site is strongly linear.Regression relationships between the two other underlying surface types in QTP permafrost regions were estimated previously, as listed in Table 3. Changes inG0andRnare very consistent with similar linear correlations for different underlying surfaces in the permafrost region, as in Su (2002). This correlation is more significant on annual and monthly scales than daily scales. Therefore,G0can be approximated byRnon annual and monthly scales in the absence of observational data, consistent with Yang et al. (2019b).
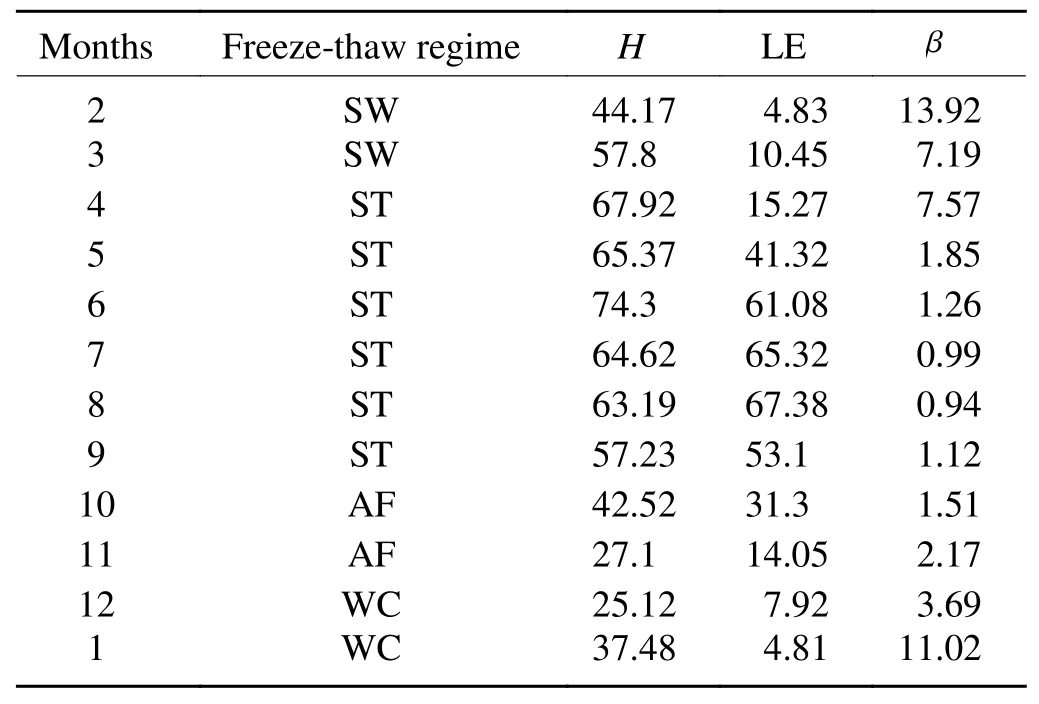
Table 2. Monthly sensible heat flux H (W m-2), latent heat flux LE (W m-2), and Bowen Ratio β for the Tanggula region, 2010.

Table 3. Regression equations for different Qinghai-Tibetan Plateau regions.
4.2. Surface albedo and snow cover effects on surface energy flux
Surface albedo is an important parameter for land-atmosphere energy balance, with small changes in albedo magnitude directly affecting the land surface energy budget(Strugnell and Lucht, 2001). Figure 5a shows that Tanggula area surface albedo was low in summer and high in winter,mainly due to differences in surface cover type (snow in winter and vegetation in summer) and in soil moisture.Although snowfall in QTP was mainly concentrated in the winter, there were still occasional snow events during the plateau monsoon season. Daily mean surface albedo was extreme after snowfalls due to strong solar radiation reflection by ice and snow (Gu et al., 2015; Yao et al., 2020). The impact of the snowfall process on the surface albedo was divided into two cases as follows. One was that there were large amounts of snow remaining for long periods,whereupon surface albedo immediately attained a maximum after snowfall, and then slowly reduced as the snow thawed. The other was a small amount of snowfall, causing the surface albedo to suddenly increase to extremes, which also thawed more quickly, whereupon albedo reduced more sharply forming a sharp peak. Figure 4b shows that for the first case, with snow already covering local surfaces, albedo increased significantly, and the daily average surface albedo could reach a maximum of 0.9; whereas the average surface albedo of Tanggula in 2010 was 0.22.
Figure 5a also shows that even without snow cover,albedo during winter was always higher than during summer, mainly due to two reasons. On the one hand, the soil was relatively dry during winter even with bare vegetation cover, hence generally high albedo; and on the other hand,the large albedo in the cold season is also related to the freezing of the surface soil. Due to the ice particles on the surface, the albedo during the frozen period is large. In contrast, surface vegetation growth and monsoon season during summer meant soil moisture content and vegetation leaf area indexes increased, greatly reducing surface albedo.
Maximum monthly average albedo occurred in November due to heavy snowfalls in mid-October (Fig. 5b) creating a thick snow cover through November, with daily maximum snow depth exceeded 6.5 cm. Snow cover can significantly impact surface energy distribution and radiation balance due to increased albedo and low thermal conductivity(Déry and Brown, 2007). Figure 5b shows that snow cover for the Tanggula site was relatively short for each season.Even during winter, when snowfall events were more frequent, snow cover did not last for the entire cold season,and snow cover changes in most eastern QTP areas had similar characteristics (Robinson et al., 1995; Xu et al., 2017).Snow cover has significant impact on surface energy budget and soil water and heat processes:Rndecreased almost 100%,Hdecreased after snowfall on day 305 (comparing Figs. 2 and 4), andG0changed from positive to negative,transporting heat to the ground surface due to the phase change from snow.Rnincreased sharply as snow began to melt andHandG0also gradually increased. Heat to melt snow mainly comes from heat transfer from the soil to the surface. Soil and the surface lose heat during this process, and hence this has an overall cooling effect on the soil. Snow cover has particularly significant soil and atmospheric cooling in the Tanggula region due to short snow accumulation period, which is dominated by ablation (Li et al., 2021). The number of snow cover days in the QTP has consistently decreased, consistent with global warming, further weakening this cooling effect (Flanner et al., 2011).

Fig. 5. Tanggula 2010 (a) ground surface albedo, and (b) snow depth(units:cm).
There is also negative correlation between shallow soil moisture content and surface albedo. Albedo is generally less than 0.3 for the Tanggula area if snow cover effects are removed, hence this study only considered regions where albedo was below 0.3 to eliminate snow effects. Figure 6 shows the relationship between surface albedo and 5 cm soil moisture content at the Tanggula observation site in 2010.Surface albedo decreased with increasing water content in the shallow soil layer. Since the albedo for water is relatively low, higher soil moisture content will tend to reduce surface albedo, which is consistent with practical experience(Zhao and Sheng, 2019).
4.3. Soil heat balance coefficient trends
Soil heat flux is also an important component for surface heat balance. Soil absorbs heat and soil temperature rises when surface heat flux is positive; whereas soil gives off heat and soil temperature decreases when it is negative.We introduced the dimensionless soil heat balance coefficientKfor convenience (Li et al., 2007),

whereGs+is total heat transferred from the land surface to the soil in a year, andGs-is the total heat transferred upward from soil to the land surface in a year.
IfK= 1, then heat absorbed by the soil balances with heat released by the soil during the year.K> 1 means the soil absorbs more heat than it releases, and hence soil temperature increases. Permafrost may degenerate ifK> 1 for extended periods. IfK< 1, heat absorbed by the soil in a year is less than heat released, and soil temperature reduces. Permafrost will develop ifK< 1 for extended periods.
Figure 7 shows thatK> 1 for the whole study region and all 10 years considered. AverageKvalue is about 1.41 over the study period with maximum in 2010 and minimum in 2014. Thus, the soil was warming overall, leading to unstable frozen ground and tendency for permafrost to degrade. This was consistent with related studies regarding permafrost degradation in the QTP in the context of global warming (Zhang et al., 2012; Shen et al., 2016). Figure 8a shows that active layer thickness changes followed the same trend as forK, significantly increasing over the study period, and Fig. 8b confirms the trend for active layer thicknesses along the Qinghai-Tibetan Highway. Table 4 provides information on observation sites for active layer thickness data along the Qinghai-Tibet Highway.

Fig. 9. Surface energy effects on active layer thawing depth (TD) at the Tanggula site: (a)global radiation Q, (b) net radiation Rn, (c) shortwave absorption radiation Sn, and (d) ground heat source intensity HIS.

Table 4. Location of the active layer measurements along the Qinghai-Tibetan highway.
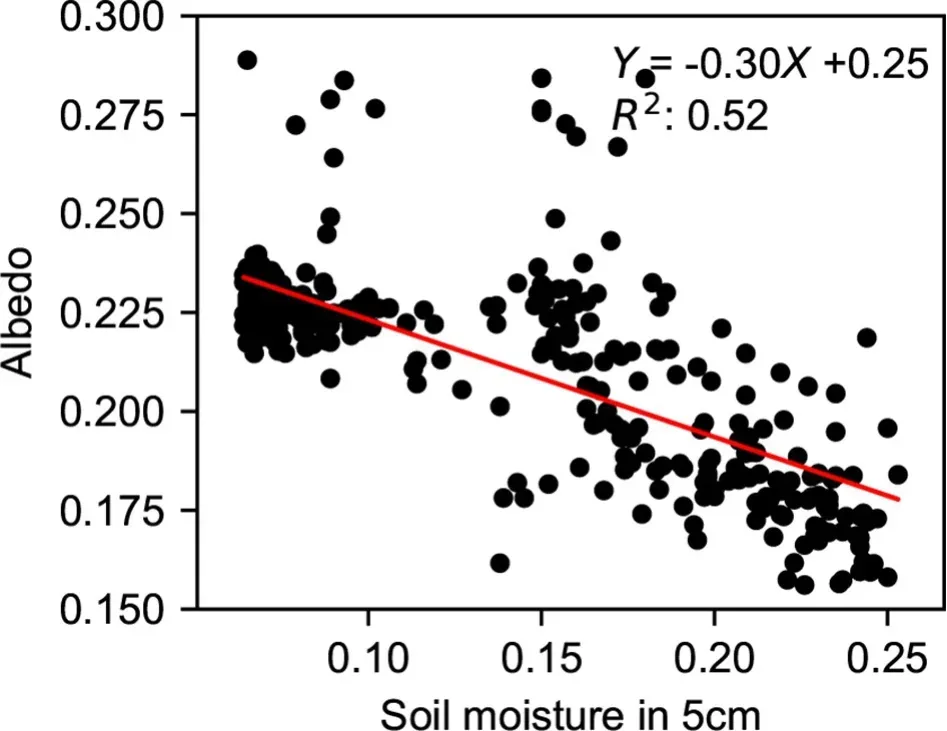
Fig. 6. Surface albedo and soil moisture content (units: m3 m-3)in 5 cm using 2010 daily average data at Tanggula.
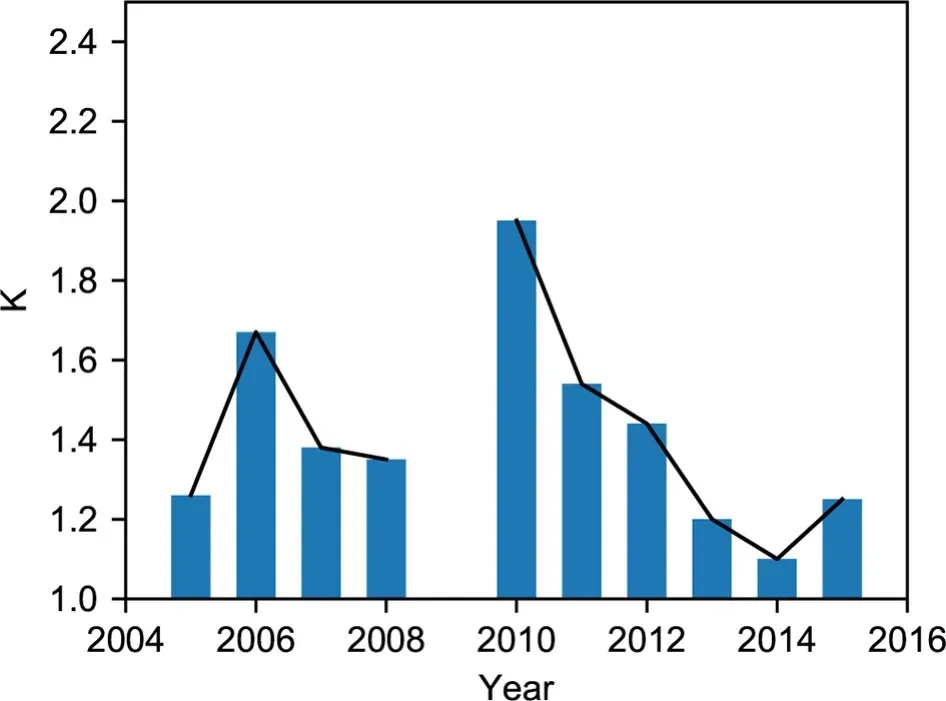
Fig. 7. Yearly mean soil heat balance coefficient (K) over the study period at Tanggula.

Fig. 8. Yearly mean active layer thickness (units: cm) for (a)the Tanggula study region, and (b) along the Qinghai-Tibetan Highway.
4.4. Surface energy accumulation impact on active layer thaw depth
Since freeze-thaw processes in the active layer are closely related to surface energy budget and soil thermal energy variations, as discussed above, changes in energy received at the surface eventually cause changes in soil heat.The most intuitive indicator of soil condition is soil temperature changes. With the periodic change of the solar radiation energy received at the surface during the year, freeze-thaw cycles occurred in the active layer (Li et al., 2011). Seasonal thawing process of active layers in permafrost regions was caused by the solar radiative heat reaching the ground and passing into the soil (Li et al., 2013). Generally, the thawing of the active layer in the northern QTP started from April to September. Therefore, this study considered April to September as the thawing period and analyzed surface energy the impacts on thaw depth (TD).
Figure 9 shows TD changes from the Tanggula Comprehensive Observation Field with respect to global radiationQ,Rnshortwave absorption radiationSn, and ground heat source intensity HIS (Figs. 9a-d, respectively). Surface energy changes had great impact on TD, with active layer TD being minimized when local surface energy accumulation is 0.0 MJ m-2, and increasing with surface energy accumulation. The relationship between the two factors can be described by a power relationship,

whereaandbare regression coefficients, andxrepresents each radiation accumulation.
Table 5 shows regression coefficients for each radiation component and overall correlation coefficient r is greater than 0.98 (p< 0.01). Figure 9 shows that dispersion was very low, and the relationship between energy changes and TD was significant. The process of soil thawing in the active layer is a heat absorption process, where energy and heat accumulation intensifies soil thawing due to the significant relationship between surface energy and thawing depth.

Table 5. Regression coefficients of Eq. (8) for different components.
5. Conclusions
This paper analyzed surface energy variation effects on freeze-thaw processes of the active layer in the permafrost regions over the QTP. The data detailing annual changes in soil temperature, soil moisture, surface albedo, snow cover,and surface energy fluxes were obtained, and the soil heat balance coefficientKwas introduced to analyze surface energy budget effects on permafrost stability. Results also showed that surface energy accumulation had great influence on active layer thaw depth, and the following conclusions were drawn.
(1)Rnexhibited significant seasonal changes, being small in winter and large in summer at Tanggula.G0exhibited similar annual trends toRn, with smallestG0(negative)in winter and largest (positive) in summer. There was a significant linear regression relationship betweenG0andRn,with both having considerable effect on freeze-thaw processes.
(2)Hand LE were the major ground heat balance equation terms at Tanggula. The cold season was dominated byH, whereas warm season was dominated by LE.Hwas largest in spring, reduced in summer; whereas maximum LE occurred in summer and smallest occurred in winter.
(3) Albedo was low in the summer, high in winter, and increased significantly when the surface was snow-covered at Tanggula. Albedo had negative correlation with surface soil moisture.
(4) Soil heat balance coefficientKwas greater than 1.0 for all years monitored, indicating that permafrost tended to degrade. Results also showed that surface energy accumulation had important influence on active layer thaw depth.
Acknowledgements. This work was supported by the National Natural Science Foundation of China (Grant Nos.42071093, 41671070), the National Key Research and Development Program of China (2020YFA0608500), the State Key Laboratory of Cryospheric Science (SKLCS-ZZ-2020), and the National Natural Science Foundation of China (Grant Nos. 41941015,42071093, 41690142, 41771076, 41601078, and 41571069). We appreciate the reviewers’ valuable comments and suggestions,which helped improve the quality of this paper.
 Advances in Atmospheric Sciences2022年1期
- Advances in Atmospheric Sciences的其它文章
- FY-3E: The First Operational Meteorological Satellite Mission in an Early Morning Orbit
- Satellite All-sky Infrared Radiance Assimilation: Recent Progress and Future Perspectives
- Impacts of Oceanic Fronts and Eddies in the Kuroshio-Oyashio Extension Region on the Atmospheric General Circulation and Storm Track
- Ocean Response to a Climate Change Heat-Flux Perturbation in an Ocean Model and Its Corresponding Coupled Model
- Dissimilarity among Ocean Reanalyses in Equatorial Pacific Upper-Ocean Heat Content and Its Relationship with ENSO
- Comparison of the Anthropogenic Emission Inventory for CMIP6 Models with a Country-Level Inventory over China and the Simulations of the Aerosol Properties
