
Deformation mechanism of fine structure and its quantitative relationship with quasi-static mechanical properties in near β-type Ti-4.5Mo-5.1Al-1.8Zr-1.1Sn-2.5Cr -2.9Zn alloy
2022-01-11 07:53:24XinjieZhuQunboFnDuouoWngHihoGongYuGoHongYuXingwngChengZhimingZhouLiuYng
Xinjie Zhu ,Qunbo Fn,* ,Duouo Wng ,Hiho Gong ,Yu Go ,Hong Yu ,Xingwng Cheng,Zhiming Zhou,Liu Yng
a National Key Laboratory of Science and Technology on Materials Under Shock and Impact,School of Materials Science and Engineering,Beijing Institute of Technology,Beijing,100081,China
b Beijing Institute of Technology Chongqing Innovation Center,Chongqing,401135,China c School of Materials Science and Engineering,Chongqing University of Technology,Chongqing,400054,China d Chengdu Advanced Metal Materials Industrial Technology Research Institute Co.Ltd.,Chengdu,610000,China
Keywords:Deformation mechanism Fine structure Quantitative relationship Titanium alloy
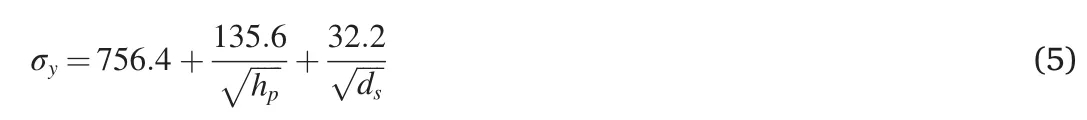
ABSTRACT The deformation mechanism of the fine structure composed of primary α phase (αp) and acicular secondary α phase(αs)on quasi-static mechanical properties is still not very clear.The main controversy is focused on the role of αp in the mechanical behavior.In this paper,the microstructure of the heat-treated near β-type Ti-4.5Mo-5.1Al-1.8Zr-1.1Sn-2.5Cr-2.9Zn alloy after tensile tests was observed by transmission electron microscopy (TEM).And the results showed that in the slight deformation region the dislocations were accumulated at the intersection of αp and β matrix separated by αs,while only a few dislocations nucleated in β matrix.In the severe deformation region,a large quantity of dislocations in both αp and β matrix were observed.It can be inferred that αp deformed firstly and then activated the deformation of β matrix,that is,the thickness of αp and the inter-particle spacing of αs played a dominant role in the deformation process.The quantitative relationship between the yield strength and the microstructure parameters is consistent with this inference.By adjusting the solution treatment parameters and the subsequent aging treatment,three fine structures were obtained,and the corresponding mechanical properties were determined.Furthermore,the yield strength can be described by the mathematical model σy=756.4+135.6/+32.2/,where hp and ds are the thickness of αp and the inter-particle spacing of αs,respectively.
1.Introduction
Titanium alloys are widely used in national defense industry for its high strength,good toughness and low density [1,2].These excellent properties,especially the strength of titanium alloys,are closely related to the microstructure.Therefore,the strength of titanium alloy is extremely sensitive to the variation of microstructure parameters.Even small changes of microstructure will significantly alter the strength of titanium alloy,which is particularly evident in the relationship between the strength and the fine structure containing primary α phase (αp) and secondary α phase(αs).The strengthening mechanisms of titanium alloys are mainly summarized as solution strengthening [3],grain boundary strengthening [4,5],deformation strengthening [6] and dispersion strengthening [7,8],in which the grain boundary strengthening mechanism has been extensively studied in the fine structure.Ren et al.[9]investigated the relationship between the microstructure parameters and the mechanical properties of a near β-type Ti-5321 alloy under different heat treatment conditions.It was found that the strength of the titanium alloy can be effectively improved by increasing the number and decreasing the size of acicular αs.The main strengthening mechanism was that the β matrix separated by acicular αseffectively restricted the dislocation motion.In fact,this phenomenon has been observed not only in near β-type titanium alloys[10–12],but also in β-type titanium alloys.Zhao et al.[13,14] investigated the effect of microstructure on the mechanical properties of a new β-type Ti-3.5Al–5Mo–6V–3Cr–2Sn-0.5Fe alloy.The result showed that with the precipitated acicular αsbecame denser and finer,the strength of the titanium alloy was significantly improved.The corresponding strengthening mechanism was that the precipitation and refinement of acicular αsincreased the α/β grain boundary area,which could effectively hinder the dislocation motion.In addition,Sadeghpour et al.[15] found the similar regularities when exploring the relationship between α-phase morphology and the tensile properties of a β-type titanium alloy.
Based on the above researches,in order to accurately tailor the microstructure parameters to obtain ideal mechanical properties,the quantitative relationship between the fine structure and mechanical properties has become a promising research field.Mantri et al.[4]fitted the quantitative relationship between the acicular αsin coarse β grains and the yield strength of a β-type Ti–15Mo–3Nb-2.7Al -0.2Si alloy as σy=830.4+0.26where σ0=830.4 MPa was the single-phase friction coefficient and d was the inter-particle spacing of αs.Zhu et al.[16] proposed that the hierarchical distribution of αp,sub-micro α-rod and nanoscale αswas the main reason for the high strength and high ductility of a metastable β-type Ti–5Al–4Zr–8Mo–7V alloy.In addition,the results revealed that the relationship between acicular αsand the yield strength satisfied the Hall-Petch like equation:σy∞k0/√---λ,where σywas the yield strength,K0was the correlation coefficients of material,and λ was the inter-particle spacing of acicular αs.However,the effect of αpand α-rod on mechanical properties was not further quantified.Devaraj et al.[17]argued that the relationship among the yield strength,αpand αsin coarse β grains of a β-type Ti–1Al–8V–5Fe alloy accorded with the equation:σy=442.6/lp+60.2/ls,where 442.6 MPa and 60.2 MPa were the correlation coefficients of αpand αs,lpand lswere the inter-particle spacing of αpand αs,respectively.Ren et al.[9] demonstrated to a similar conclusion when investigating the correlation between microstructure parameters and mechanical properties of a near β-type Ti–5Al–3Mo–3V–2Cr–2Zr–1Nb–1Fe alloy.In summary,the above researches are based on the grain boundary strengthening mechanism,that is,grain boundaries restrict dislocation motion in numerous small domains,which increases the resistance of dislocation motion.For acicular αs,the strengthening mechanism is that dislocation motion is restricted in nanoscale region of β matrix which is separated by acicular αs.Therefore,the maximum length of dislocation motion is the inter-particle spacing of two αs[18–22].However,the strengthening mechanism of αpis controversial.The above researches argue that dislocation motion is restricted in β matrix separated by αp,and the maximum length of dislocation motion is the inter-particle spacing of two αp.However,Zhu et al.[23]put forward the opposite view that the softer αpdeforms first than β matrix and dislocation motion is restricted in αp.Therefore,the maximum length of dislocation motion was the grain thickness of αp.The controversy about the role of αpindicates that the deformation mechanism of the fine structure containing αpand αsis still not clear,which constraints the precise design of the microstructure characteristics in titanium alloys.
In order to solve the controversy of the deformation mechanism for the fine structure,especially to further quantify the relationship between the fine structure and mechanical properties,a near β-type Ti-4.5Mo-5.1Al-1.8Zr-1.1Sn-2.5Cr-2.9Zn alloy developed by Beijing University of Technology [24] was solution-treated under different conditions and then identically aging-treated to obtain three fine structures with different microstructure parameters.Combining the microstructure observation with the quasi-static mechanical properties,the deformation mechanism of the fine structure was revealed,and the quantitative relationship between microstructure parameters of the fine structure and the yield strength were established.
2.Experiment procedure
The as-received material in the present study is a near β-type titanium alloy ingot with a size of Φ470 mm prepared via triple melting in a vacuum arc remelting furnace,and its composition is listed in Table 1.The β-transus temperature was determined to be 985±5°C by means of metallographic method.After soaking at 970°C for 1 h,the as-cast ingot with a thickness of 60 mm machined from the original as-cast ingot by wire-cutting technology was hot-rolled to a 7.5-mm thick plate.Afterwards,the specimens machined from the hot-rolled plate were solutiontreated under different conditions and then identically aging-treated to obtain three fine structures with different microstructure parameters(the detailed description about the design of the heat treatment scheme and the control of the fine structure will be given emphasis in the“Design and regulation of the fine structure”section).

Table 1 Composition of the titanium alloy used in the present study(wt.%).
As shown in Fig.1,the specimen for quasi-static tensile tests was machined from the heat-treated plates by wire cutting method,with the loading direction parallel to the rolling direction (RD).In addition,the yield strength (YS),the ultimate tensile strength (UTS) and the percentage elongation were measured using an Instron Universal Testing machine (Instron 5500R,Instron,Boston,USA) with the strain rate of 10-3/s at room temperature.
The specimen for microstructure characterization was mechanically polished and etched in Kroll's reagent (10 mL HF,30 mL HNO3,and 200 mL H2O) after being ground with various (400–2000) grits of SiC paper.Subsequently,the microstructure characterization was performed via Optical Microscopy (OM,ZEISS Axiovert 25,Carl Zeiss AG,Jena,Germany) and Field Emission Gun Scanning Electron Microscopy (FEGSEM;Quanta 200FEG,FEI,Hillsboro,USA),with the observation direction parallel to the normal direction(ND).For the observation of the fine details in the microstructure,the failure specimen was characterized by means of transmission electron microscopy(TEM),which was performed on a FEI Tecnai G2 microscope(FEI,Hillsboro,USA)operated at 200 kV.For TEM observation,the specimen with a diameter of 3.0 mm was machined using the electron discharge method and then polished to 100 μm using various (400–2000) grits of SiC paper;afterwards,the specimen was finally prepared via a twin-jet electrochemical polishing method.Furthermore,the metallographic analysis software of Image Pro Plus V6.0 (Media Cybernetics,Washington,DC,USA) was used to analyze the microstructure quantitatively.
3.Results and discussion
3.1.Design and regulation of the fine structure
The microstructure of the hot-rolled Ti-4.5Mo-5.1Al-1.8Zr-1.1Sn-2.5Cr-2.9Zn alloy is shown in Fig.2.It can be seen from Fig.2(a)that the microstructure is composed of lamellar αpand transformed β phase(βT),and the average thickness of lamellar αpis about 0.5 μm.As shown in Fig.2(b),the microstructure of the βTregion is composed of β matrix and acicular αswith an average thickness of about 100 nm.
In order to obtain the fine structure containing lamellar αpand acicular αs,the solution treatment under different conditions and the following aging treatment were carried out on the hot-rolled titanium alloy.The heat treatment process and microstructure design path are shown in Fig.3.Firstly,one specimen was solution-treated at 880°C for 1 h followed by air cooling (AC),and the other two specimens were solution-treated at 920°C for 1.5 h followed by air cooling and water quenched (WQ),respectively.Finally,the three specimens were agingtreated at 650°C for 3 h followed by air cooling.The three specimenswere hereafter labeled as 880°C AC specimen,920°C AC specimen and 920°C WQ specimen,respectively.
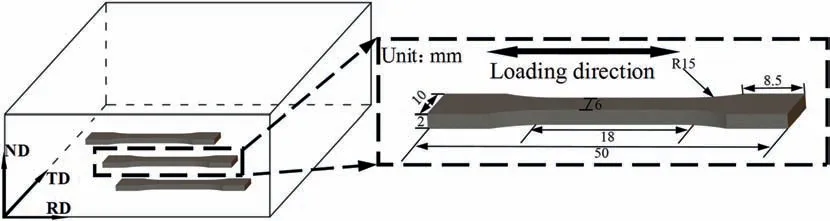
Fig.1.Schematic diagram of the specimen for quasi-static tensile tests.
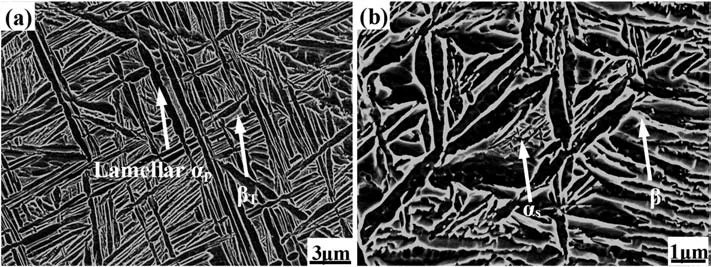
Fig.2.Microstructure of the hot-rolled titanium alloy.(a) The SEM image and (b) the high magnification view of βT regions.
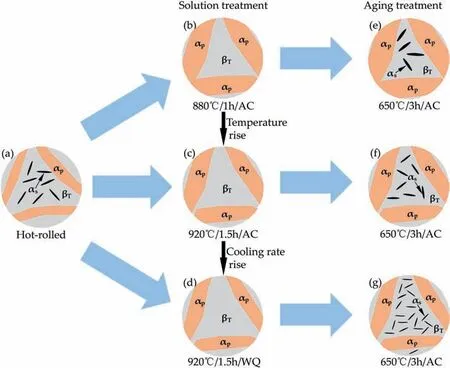
Fig.3.Schematic diagram of heat treatment process and microstructure design path.The microstructure design containing the microstructures of the(a)hot-rolled,(b)880 °C/1 h/AC solution treated,(c)920 °C/1.5 h/AC solution treated,(d)920 °C/1.5 h/WQ solution treated,(e)880 °C/1 h/AC+650 °C/3 h/AC completely heattreated,(f) 920 °C/1.5 h/AC+650 °C/3 h/AC completely heat-treated and (g) 920 °C/1.5 h/WQ+650 °C/3 h/AC completely heat-treated titanium alloys.
Firstly,in order to obtain the microstructure with different grain sizes of α phase and fraction fractions of α/β phases,the hot-rolled titanium alloy shown in Fig.3(a)was solution-treated under various conditions.As shown in Fig.3(b),the hot-rolled titanium alloy was solution-treated at 880°C for 1 h followed by air cooling(880°C/1 h/AC).The purpose of setting the solution temperature at 880°C which was far away from the β-transus temperature(985±5°C)was to maintain the driving force of α→β element diffusion at a low degree,thus making only a bit of α phase transform into β phase in the material.This strategy constrained the expansion of β grain boundaries,and then the growth of β grain was controlled in a narrow scope.Correspondingly,severe decrease in the grain size of α phase was effectively resisted for the limited shrinkage of α grain boundaries.Consequently,the microstructure shown in Fig.4(a)was obtained.As shown in Fig.3(c),the hot-rolled titanium alloy was solution-treated at 920°C for 1.5 h followed by air cooling (920°C/1.5 h/AC).The purpose of increasing the solution temperature from 880°C to 920°C and the solution time from 1 h to 1.5 h was to increase the driving force of α→β element diffusion,thus making a lot of α phase transform into β phase in the material.This strategy made β grain grow up adequately.Correspondingly,the grain size of α phase decreased sharply for the great shrinkage of α grain boundaries.Consequently,the microstructure shown in Fig.4(b) was obtained.As shown in Fig.3(d),the hot-rolled titanium alloy was solution-treated at 920°C for 1.5 h followed by water quenched (920°C/1.5 h/WQ).Changing the cooling mode from air cooling to water quenched was helpful to inhibit the growth of α phase and the decrease of the grain size of β phase in the cooling process [25,26].The purpose of this strategy was to obtain the microstructure with larger β grains compared with the 920°C/1.5 h/AC specimen.Simultaneously,the corresponding grain size of α phase is the smallest compared with the 880°C/1 h/AC specimen and the 920°C/1.5 h/AC specimen.Consequently,the microstructure shown in Fig.4(c)was obtained.
Previous studies indicate that acicular αsprecipitates in the aging treatment process.In the present study,the same aging treatment(650°C/3 h/AC) was carried out on the above solution-treated specimens.In this case,α phase and β phase reached the equilibrium state[27],i.e.,the contents of α phase as well as β phase in three completely heat-treated specimens were consistent.In fact,the microstructure characteristics of the solution-treated titanium alloys have a significant influence on the formation of the fine structure,and the precipitation of acicular αsis closely related to the volume fraction of β phase[28].With the increase of solution temperature (880°C–920°C) and cooling rate(AC-WQ),the volume fraction of β phase was controlled and gradually increased,as shown in Fig.4(a)–4(c),to promote more nucleation points for αsduring aging treatment.With the growth of acicular αs,once two αsconnected with each other,the growth process would be stopped immediately[29].Therefore,as shown in Fig.3(e)–3(g),finer and denser acicular αsprecipitated during the aging treatment of the solution-treated specimen with higher volume fraction of β phase.In the period of aging treatment,on the one hand,the volume fraction of α phase in βTregion increased gradually with the acicular αsbecoming denser and finer;on the other hand,the growth process of αpwas almost the same during the same aging treatment.This strategy ensured that the trend of αpsize in completely heat-treated specimens was consistent with that of the solution-treated ones.Finally,three fine structures shown in Fig.5 and Fig.6 were obtained.
Fig.5 shows the microstructures of the completely heat-treated specimens,in which the microstructures of the 880°C AC,920°C AC and 920°C WQ specimens are shown in Fig.5(a),(b) and (c),respectively.The results of the quantitatively analysis for microstructure parameters indicate that the thickness of lamellar αpin 880°C AC specimen was about 1.48 μm,while that of 920°C AC and 920°C WQ specimens decreased to about 1.15 μm and 0.84 μm,respectively.
Fig.6 shows the microstructures of the βTregions in the completely heat-treated specimens.In 880°C AC specimen,the thickness of acicular αswas about 0.13 μm,and the inter-particle spacing of αswas about 0.11 μm,as shown in Fig.6(a).However,the thickness values of αsin the 920°C AC specimen and the 920°C WQ specimen were 0.081 μm and 0.056 μm,respectively,and the corresponding inter-particle spacing values of αswere 0.072 μm and 0.049 μm,as shown in Fig.6(b)and(c).
In order to clearly illustrate the microstructure differences of the 880°C AC,920°C AC and 920°C WQ specimens,as shown in Figs.5 and 6,the corresponding microstructure parameters are listed in Table 2.

Table 2 Microstructure characteristics of the 880 °C AC,920 °C AC and 920 °C WQ specimens.
3.2.Mechanical properties
Fig.7 shows the true strain-stress curves of the completely heattreated titanium alloys determined at room temperature and a strain rate of 10-3/s.It can be seen that the 880°C AC specimen exhibited the highest elongation of about 12.74% but the lowest strength (YS:967 MPa,UTS:1025 MPa).With the solution temperature increasing from 880°C to 920°C,the elongation of the 920°C AC specimen decreased to 11.15%,and the yield strength and ultimate tensile strength increased rapidly to 1003 MPa and 1073 MPa,respectively.With the cooling mode changing from AC to WQ,compared with the 880°C AC specimen and 920°C AC specimen,the 920°C WQ specimen exhibited the lowest elongation of about 10.75% but the highest strength (YS:1050 MPa,UTS:1118 MPa).
3.3.Influence mechanism of the fine structure on mechanical properties
In the present study,the same aging treatment was carried out on the solution-treated titanium alloys,and no other precipitates except α grains(αpand αs)were observed.Therefore,the yield strength of the completely heat-treated titanium alloys is considered to be mainly determined by the microstructure parameters of αpand αs.
In fact,during the quasi-static tensile deformation,the dislocations in motion are confined into numerous limited domains by obstacles,thus enhancing the strength of titanium alloys.The corresponding schematic illustration is shown in Fig.8.In general,when dislocations in motion encounter obstacles,a group of F dislocations will be formed,such as dislocation pile-up[30].In the equilibrium states,the resultant force F on each dislocation is zero.For edge dislocations,the local stress of the leading dislocation in the accumulated dislocations is σ1,as follows σ1=Fτbm,where τ and bmare the applied stress and the Burgers vector,respectively.
In addition,a repulsive force τ*bmwill be formed when the leading dislocations in the accumulated dislocations encounter the short-range stress field of τ* [5].In the equilibrium states,the local stress and repulsive force of the leading dislocations in the accumulated dislocations are equal and described as follows:

Fig.4.Microstructures of the solution-treated specimens.(a) 880 °C/1 h/AC specimen,(b)920 °C/1.5 h/AC specimen and (c) 920 °C/1.5 h/WQ specimen.
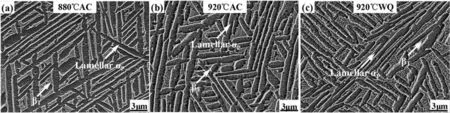
Fig.5.Microstructures of the completely heat-treated specimens.(a) 880°CAC specimen,(b)920 °CAC specimen and (c) 920°CWQ specimen.
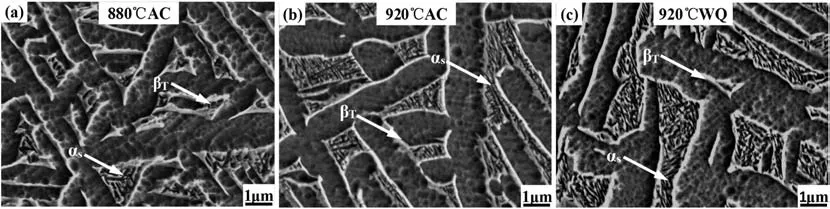
Fig.6.Magnified microstructures of the completely heat-treated specimens.(a) 880 °C AC specimen,(b)920 °C AC specimen and (c) 920 °C WQ specimen.
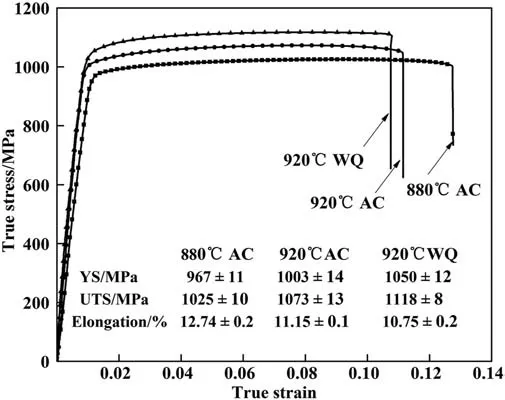
Fig.7.True stress-strain curves of the completely heat-treated specimens.

Similar equilibrium equations can be used for the following dislocations in the accumulated dislocations.Li et al.[31]solved this equation by the analytical integral method and gave the number of the dislocations in the accumulated dislocations:

Fig.8.Schematic illustration of a dislocation pile-up from the source SD to the interface.

where vmand Gmare Poisson's ratio and shear modulus of material respectively,and d/2 is the maximum length of dislocation motion in the accumulated regions(d is the distance of two interfaces).
According to equations(1)and(2),the critical stress τcof dislocation slip through the interface can be calculated as follows:
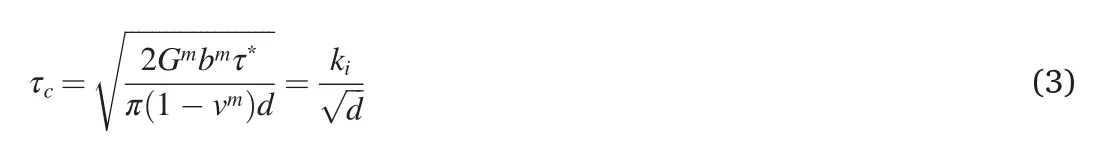
where kiis the material constant.Moreover,equation(3)is similar to the Hall-Petch equation,and τ is proportional to d-1/2.For acicular αs,the distance d between two interfaces is the size of β matrix separated by acicular αs,i.e.,the inter-particle spacing of two αs.However,for lamellar αp,it is still controversial whether d is the inter-particle spacing of two αpor the thickness of αp.In order to solve this controversy,microstructure observation was carried out on the regions near and far from the fracture line of the failure specimen,and the TEM images are shown in Fig.9.
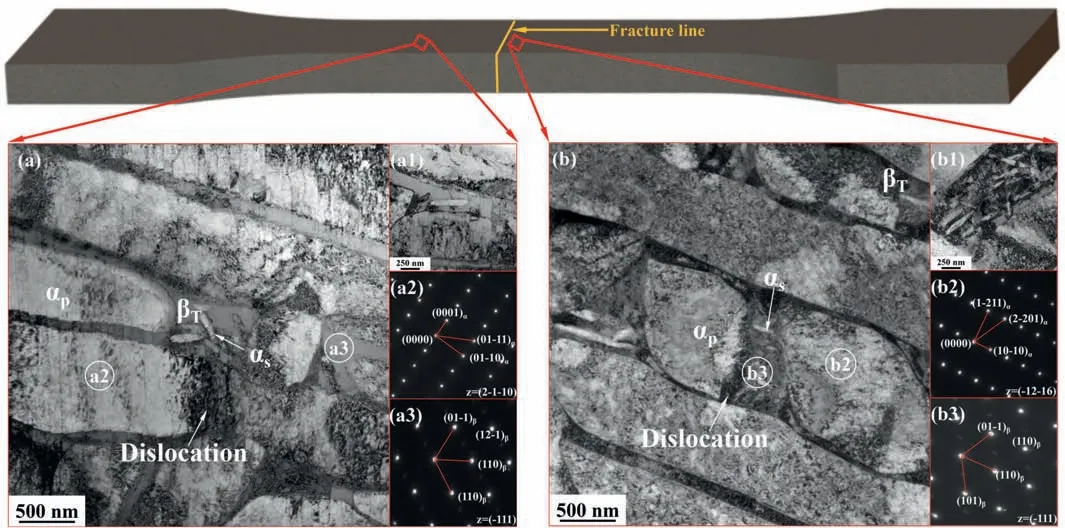
Fig.9.TEM images of the failure specimen.(a) Far from the fracture line and (b) near the fracture line.
Fig.9(a) shows the TEM morphology of the region far from the fracture line.Fig.9(a1) is the high magnification view showing the microstructure of the intersection of αpand β matrix,and Fig.9(a2)and Fig.9(a3)are the selected area diffraction patterns(SADP) of circles a2 and a3 in Fig.9(a),respectively.In the slight deformation region shown in Fig.9(a)and(a1),the accumulated dislocations at the intersection of αpand β matrix were observed,while in the β matrix separated by acicular αs,only a small amount or no dislocations nucleated.This indicates that softer αpdeformed firstly at the initial stage of deformation,which is consistent with the report by Zhu et al.[23].Fig.9(b) shows the TEM morphology of the region near the fracture line,in which Fig.9(b1)is the high magnification view showing the microstructure of the intersection of αpand β matrix,and Fig.9(b2)and Fig.9(b3)are SADP of circles b2 and b3 in Fig.9(b),respectively.In the severe deformation region shown in Fig.9(b)and(b1),a large number of dislocations were accumulated in αpand β matrix.This indicates that with the increase of deformation,αpfurther deformed and the deformation of the β matrix separated by αswas also activated.However,no dislocation was observed in acicular αs,which indicates that the harder acicular αswas not involved in the deformation.
Based on the analysis of TEM images in Fig.9,the schematic illustration of the deformation process of the fine structure containing lamellar αpand acicular αsis shown in Fig.10.At the initial stage of deformation shown in Fig.10(a),the plastic deformation mainly occurred in softer αp.With the increase of deformation,the hardened layers composed of accumulated dislocations formed at αpboundaries,which is similar to the composite-like materials consisting of interiors with low flow stress and hardened layers of grain boundaries[32,33].At this time,the hardened αpactivated the deformation of β matrix,as shown in Fig.10(b).During the subsequent deformation,the hardened αpand β matrix separated by acicular αscontinued to deform,as shown in Fig.10(c).
The above analysis confirms that the contribution of αpto the yield strength is determined by the thickness of αp(hp).Therefore,the yield strength of the fine structure can be expressed by equation(4):

where σyis the yield strength,σ0is the friction stress of single crystal material,kpand ksare the related parameters of αpand αs,hpand dsare the thickness of αpand the inter-particle spacing of αs,respectively.
Based on the experimental data of the quasi-static mechanical properties,the values of kpand ksare fitted to be 135.6 MPa μm-1/2and 32.2 MPa μm-1/2,respectively.Therefore,equation(4)can be expressed more accurately as equation(5):
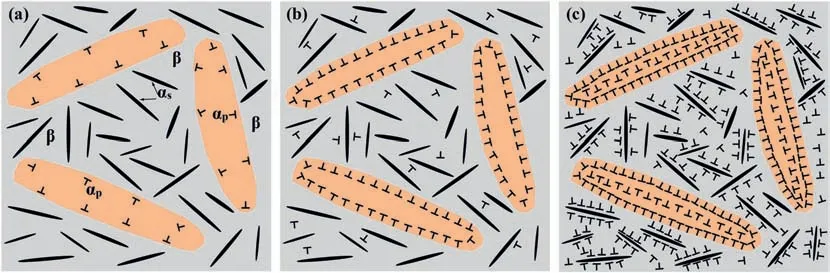
Fig.10.Schematic illustration of the deformation process of the fine structure.(a) The microstructure at the initial stage of deformation,(b) the hardened αp activating the deformation of β matrix and (c) the compatible plastic deformation in high strain.
The contribution of αpand αsto the increase of the yield strength was also calculated.The results showed that with the decrease of the thickness of αpand the inter-particle spacing of αsfrom 1.43 μm to 0.11 μm–1.15 μm and 0.072 μm respectively,the yield strength increased from 967 MPa to 1003 MPa,and the contribution of αpand αsto the increase of the yield strength was 13.1 MPa (36.4%) and 22.9 MPa(63.6%),respectively.When the thickness of αpand the inter-particle spacing of αsfurther decreased to 0.84 μm and 0.049 μm,the yield strength increased rapidly to 1050 MPa,and the contribution of αpand αsto the increase of the yield strength is 21.5 MPa (45.7%) and 25.5 Mpa(54.3%),respectively.It indicates that the contribution of nanoscale acicular αsto the increase of the yield strength is significantly higher than that of micronscale lamellar αp.However,with the thickness of αpdecreased from micronscale to nanoscale (1.43 μm–0.84 μm),the contribution proportion of αpto the increase of the yield strength substantially increased from 36.4%to 45.7%.The result illustrates that the nanoscale grains play a dominant role in the increase of the yield strength.
The gradual decrease of the thickness of αp(1.43 μm–0.84 μm) and the inter-particle spacing of αs(0.11 μm–0.049 μm) reduces the maximum length of dislocation motion,which leads to higher dislocation density under the same macro strain and effectively improves the strength of titanium alloys.However,the localized distribution of accumulated dislocations promotes the initiation of crack and accelerates the fracture process.Therefore,compared with the 880°C AC and 920°C AC specimens,the 920°C WQ specimen exhibits the highest strength but the lowest elongation.
4.Conclusions
The hot-rolled near β-Type Ti-4.5Mo-5.1Al-1.8Zr-1.1Sn-2.5Cr-2.9Zn alloy have been solution-treated under different conditions and then identically aging-treated to obtain three fine structures containing lamellar αpand acicular αs.Combining the quasi-static tensile mechanical properties with the microstructure observation of the failure specimens,the deformation mechanism of the fine structure is revealed,and the quantitative relationship between the yield strength and the microstructure parameters is further established.
(1) In the solution treatment stage,lamellar αpis regulated by increasing the solution temperature(880°C–920°C)and cooling rate (AC-WQ),and the volume fraction of β phase increases gradually.After the same aging treatment (650°C/3 h/AC),the fine structure composed of lamellar αpand acicular αshas been obtained.Moreover,the values of the thickness of αpand the interparticles spacing of αsdecreases from 1.43 μm to 110 nm to 0.84 μm and 49 nm,respectively.
(2) The TEM observation of microstructure shows that in the slight deformation region,the dislocations mainly accumulate at the intersection of αpand β matrix,however in the severe deformation region,a large quantity of dislocations in both αpand β matrix separated by αsare observed.It indicates that the thickness of αpand the inter-particle spacing of αsplay a dominant role during the deformation process.
(3) The quantitative relationship among the yield strength,the thickness of αp(hp)and the inter-particle spacing of αs(ds)in the fine structure is described by the mathematical model σy=756.4+135.6/+32.2/and the nanoscale grains make dominant contribution to the increase of the yield strength.
Declaration of competing interest
The authors declare that they have no known competing financial interests or personal relationships that could have appeared to influence the work reported in this paper.
Acknowledgments
This work was financially supported by the Natural Science Foundation of Chongqing(Grant No.cstc2020jcyj-msxmX0094).In addition,Dr.Xuehao Zheng from ZKKF(Beijing)Science and Technology Co.,Ltd is acknowledged for TEM tests and data analysis.
 Progress in Natural Science:Materials International2021年5期
- Progress in Natural Science:Materials International的其它文章
- Effect of thermo-mechanical treatment on Ti–Ta-Hf high temperature shape memory alloy
- Zr-xNb-4Sn alloys with low Young’s modulus and magnetic susceptibility for biomedical implants
- Enhanced dielectric performance of Dy -substituted YMn2O5 for high-frequency applications
- Creep behavior and dislocation mechanism of Ni3Al based single crystal alloy IC6SX at 760°C
- Mechanisms of two-stage martensitic transformation in Ti-Ni-Hf alloy powder
- Microstructure evolution and corresponding tensile properties of Ti–5Al–5Mo–5V–1Cr–1Fe alloy controlling by multi-heat treatments