
Mineralogy and geochemistry of siliciclastic Miocene Cuddalore Formation, Cauvery Basin,South India: Implications for provenance and paleoclimate
2022-01-05 07:38:48NurulAbsar
Journal of Palaeogeography 2021年4期
Nurul Absar
Department of Earth Sciences, Pondicherry University, Pondicherry 605014, India
Abstract The Cuddalore Formation of the Cauvery Basin received siliciclastic detritus from inland areas of the Southern Granulite Terrain (SGT). It represented continental-fluvial sedimentation in the eastern continental margin of South India during the Miocene. Indian Summer Monsoon was thought to be initiated in the early Miocene and intensified during the middle Miocene causing major climatic shifts in the Indian subcontinent. In the present work, detailed mineralogical and geochemical studies on the siliciclastic Cuddalore Formation have been carried out to understand the provenance and paleoclimatic conditions during the Miocene.The paleocurrent direction,textural immaturity and framework detrital modes of sandstones suggest rapid uplift of basement and sediment source from nearby Madras Block of SGT. Various diagnostic immobile trace element ratios such as Th/Sc, Co/Th, La/Sc, La/Co suggest a tonalite-trondhjemite-granodiorite-charnockite provenance, and somewhat more felsic composition of source area compared to the present upper continental crust (UCC). Rare earth element mixed model suggests that sediments were dominantly(80%) sourced from felsic charnockite, with a minor contribution (20%) from mafic granulites. Higher abundance of advanced-weathering products like kaolinite, very high (>98) chemical index of alteration (CIA)values,severe depletion of mobile elements(Ca,Na,K,Mg,Ba,Rb)in comparison to UCC,significantly higher αMg, αCa, αNa, αK, αSr and αBa values (higher than the unity), all suggest the extreme chemical weathering in source terrain and/or in the sedimentary basin. Calculations based on CIA show high average surface temperature between 29.3 °C and 29.5 °C and high mean annual precipitation ranging from 2339 mm/yr to 2467 mm/yr.The geochemical data are consistent with the paleogeographic position of the depositional basin(Cauvery Basin) and suggest the deposition of Cuddalore sediments (the Cuddalore Formation) in a nearequatorial location under a warm climate condition with abundant monsoonal precipitation.
Keywords Clastic sediment geochemistry, Provenance, Paleoclimate, Tectonic setting, Miocene, Cuddalore Formation, Cauvery Basin, South India
1.Introduction
Sedimentary basins act as the natural repository of sediments eroded from adjoining landmasses and orogenic belts. Siliciclastic sediments, deposited below the base level of erosion in the basin, are generally well preserved and can serve as proxy to the eroded and obscured past-land masses and mountain belts (e.g. Absar et al., 2009, 2016; Nie et al., 2012;Absar and Sreenivas, 2015; Chaudhuri et al., 2020a,2021). Several approaches have been suggested to determine the provenance of siliciclastic sediments:1)conventional optical petrography of detrital modes(e.g. Dickinson and Suczek, 1979; Basu, 1985, 2017;Dickinson,1988;Quasim et al.,2017;Chaudhuri et al.,2018, 2020b; Akinlotan et al., 2021); 2) study of detrital heavy mineral assemblage(e.g.Morton,1985,1991; Chaudhuri et al., 2020b; Etimita and Beka,2020); 3) whole rock geochemistry (e.g. Taylor and McLennan, 1985; Wronkiewicz and Condie, 1987,1989, 1990; McLennan et al., 1993, 1995; Cullers,2000; Cullers and Podkovyrov, 2000; Bhat and Ghosh,2001; Condie et al., 2001; Armstrong-Altrin et al.,2019; Ji et al., 2020); 4) Nd-isotope systematics in whole rock(e.g.Saha et al.,2004;Chakrabarti et al.,2007; Guo et al., 2012; Walczak and Belka, 2017;Rashid et al., 2018; Bankole et al., 2020); and, 5)U-Pb geochronology and Hf-isotope systematic study of detrital zircons (e.g. Gehrels and Stewart, 1998;Cawood et al.,2003,2012;Gehrels et al.,2008;Collins et al.,2015;Madhavaraju et al.,2019;Ramos-V′azquez and Armstrong-Altrin, 2019; Armstrong-Altrin, 2020;Ossa et al.,2020;Armstrong-Altrin et al.,2021;Borges et al., 2021). The geochemical approach is advantageous over the conventional petrographic techniques as it can be applied on fine-grained sediments or on metamorphosed sediments. Several insoluble elements with a short residence time in seawater are transferred almost quantitatively from source rocks to sediments and are not seriously affected by secondary processes like diagenesis or metamorphism (e.g.Hussain et al.,2021).These insoluble elements include an array of both compatible (e.g. Sc, Co, Cr) and incompatible (e.g. Th, Zr, REE) elements, ratios of which are useful in determining source rock composition (Taylor and McLennan, 1985; Madhavaraju and Lee, 2010; Wang et al., 2012; Madhavaraju, 2015;Madhavaraju et al., 2016, 2017; Asiedu et al., 2019;Khan et al., 2020a, 2020b). On the other hand, the relative mobility of several alkali and alkaline earth elements during weathering is used to quantify the intensity of weathering and to infer the paleoclimate(e.g.Nesbitt and Young,1982,1984;Gaillardet et al.,1999; Zhang et al., 2014; Rashid and Ganai, 2018;Ganai and Rashid,2019;Perri,2018,2020;Wang et al.,2020).Several studies have shown that the intensity of chemical weathering is related to climatic conditions,and several parameters such as average surface temperature (e.g. Yang et al., 2014; Xu et al., 2020) and mean annual precipitation (e.g. Sheldon et al., 2002;Perri, 2020) can be estimated from geochemical composition of weathering products or suspended sediments.
Southern Granulite Terrain(SGT)is an ensemble of several cratonic blocks, accreted through multiple orogenic cycles spanning from Meso-Archean to Cambrian (Santosh, 2020). Periodic uplift of SGT took place along E-W trending shear zones because of a build-up stress and the northward drifting of the Indian Plate during the Himalayan orogenic period (cf.Valdiya, 1998; Sharma and Rajamani, 2000). The Neogene sedimentary sequences of the Cauvery Basin in the eastern margin of India were thought to have received detritus from uplifted terrain boundaries of SGT (cf. Valdiya, 1998; Sharma and Rajamani, 2000;Singh and Rajamani, 2001). Therefore, geochemistry of these siliciclastic rocks would provide a valuable estimate on the composition of contemporary crust.It is now recognized that the modern South Asian Monsoon system developed or intensified during the Miocene, as a consequence of India-Eurasia collision and topographic rise of Himalayan Mountain belt(e.g.Sanyal et al., 2004, 2010; Brozovic and Burbank,2000), and also a result of the position changing of the Intertropical Convergence Zone(ITCZ)(Armstrong and Allen,2011;Allen and Armstrong,2012).Proposed ages for intensification of South Asian Monsoon mainly included the early Miocene(22-20 Ma;e.g.Guo et al.,2002),the middle Miocene(16-11 Ma;e.g.Clift et al.,2004), and the late Miocene (11-8 Ma; e.g. Molnar et al., 1993). However, peak monsoonal conditions during middle Miocene ages (Clift et al., 2004) were commonly viewed to be originated from the early Miocene (e.g. Clift et al., 2008). Clastic sedimentary rocks deposited during these periods could serve as repositories of the paleoclimatic information.Although sediments of Himalayan foreland basins such as Siwalik Basin (Sinha et al., 2007; Ranjan and Banerjee, 2009; Kundu et al., 2016) and Bengal Basin(Alam,1989;Uddin and Lundberg,1998;Hossain et al.,2010) have been studied for the provenance and climate interaction, the cratonic sediments are not studied so far for understanding the impact of monsoon system on sediment geochemistry. These cratonic sediments are otherwise more suitable archives since they can respond to the climatic system more readily because of the high residence time of their parent material in weathering profile before their incorporation into the sediment budget.
In the current investigation,detailed mineralogical and elemental geochemical studies on siliciclastic sediments of the Miocene Cuddalore Formation in the Cauvery Basin are carried out to elucidate the characteristics of their source rocks, and to better understand the weathering condition and paleoclimate.
2.Geological background
The Cauvery Basin is a pericratonic basin situated in the eastern continental margin of South Indian peninsular shield with a trend in NE-SW direction.The basin was opened as a rift basin during Late Jurassic-Early Cretaceous period (e.g. Powell et al.,1988). The sedimentary succession is comprised of huge volumes of sediments dating from the Cretaceous to the Recent age (e.g. Nagendra and Reddy, 2017). A complete Upper Cretaceous-Paleocene succession is exposed in the Ariyalur-Pondicherry depression of this basin(Singh et al.,1992).The general geological map of South India is shown in Fig.1a and the stratigraphic succession of the Cauvery Basin in the study area is presented in Table 1. The Southern Granulite Terrain(SGT) constituted the basement of the Cauvery Basin,from which sediments were likely derived (Fig. 1a).The SGT is comprised of a number of distinct crustal blocks, separated by collisional sutures/shear zones(Fig. 1a), and these blocks were formed by multiple orogenic cycles during a long period of Mesoarchean to late Neoproterozoic-Cambrian (see Santosh, 2020;Yang et al.,2021).The Northern and Madras blocks are thought to be extended from the Archean Dharwar Craton and metamorphosed to granulite facies (Dash et al., 2013), and other blocks towards the south are progressively younger (Fig. 1a; Santosh, 2020). These blocks are dominantly composed of charnockite with mafic granulite enclaves, migmatite gneiss and younger granite plutons (Table 1; Fig. 1a). Charnockites form large highland massif, whereas lowlands are occupied by migmatite gneiss and younger granite plutons(Tomson et al., 2006, 2013).
Thick Upper Cretaceous successions belonging to Valudavur and Mettuveli formations unconformably overlie the Archean basement, which in turn, are overlain by the Paleocene Karasur and Manaveli formations (Table 1). Neyveli Formation comprising black clays,shales and sandstones with lignite seams,cropped out in Neyveli lignite fields area(Singh et al.,1992) is probably equivalent to the upper Manavali Formation. Detailed palynological studies suggest an Eocene age for the basal Neyveli lignite horizon(Siddhanta, 1986; GSI 2006 and references therein).Singh et al. (1992) carried out detailed paleobotanical studies on Neyveli lignite horizon, identified 33 genera of angiospermic pollen and 5 genera of pteridophyte-spores and concluded that these were deposited in Mangrove-moist environment. The Miocene Cuddalore Formation, comprising alternate beds of sandstone,clayey sandstone,sandy clay,clay and carbonaceous clay, disconformably overlies the Paleocene Manaveli Formation in the study area(Table 1; Sundaram et al., 2001). These are chiefly made up of angular to subangular grains of quartz(38%) and feldspar (6%) with an argillaceous and/or ferruginous cementing medium (55%). The heavy minerals recovered (1%) from sandstones of the Cuddalore Formation were considered to be sourced from the Precambrian rocks exposed in the western part of the study area(Rajamanickam,1968).The Cuddalore sandstone contain large silicified trunks of fossil wood Hopeoxylon arcotense, Hopeoxylon indicum and Hopeoxylon speciosum, closely related to modern wood of Sindora (Awasthi, 1977; Priv′e-Gill et al., 1999). Based on palynosequence cenozones Pteridacidites vermiverrucatus, Malvacearumpollis bakonyensis and Myricipites singhii, an early Miocene age of the Cuddalore Formation was suggested (Mandaokar and Mukherjee, 2014). Preliminary textural (grain size) analysis and geochemical research suggested that the Cuddalore sandstone were deposited in an estuarine environment(Selvaraj and Ramasamy,1998).The petrofacies analysis (Khan et al., 2007) of Cuddalore sandstone suggested that the sediments were mainly derived from Archean granite-gneiss, charnockite and quartzite because of basement uplift in a rifted continental margin basin setting.

Fig. 1 a Generalized geological map and tectonic framework of southern Peninsular India showing Dharwar Craton, Southern Granulite Terrain(SGT),and the Mesozoic-Cenozoic cover rocks of Cauvery Basin(modified after Santosh,2020).The Northern Block and Madras Block of SGT are thought to be extended from the Archean Dharwar Craton and metamorphosed to granulite facies (Dash et al., 2013). Other southern blocks,viz.Nilgiri,Madurai and Trivandrum blocks of SGT are younger and separated by shear zones,and were accreted by multiple orogenic events spanning from Archean to Cambrian(Santosh,2020).Huge volumes of sediments varying from the Early Cretaceous to recent ages were deposited in the rifted eastern margin of India; and the stratigraphy of the Puducherry sub-basin is given in Table 1; b Representative lithostratigraphic column of the Cuddalore Formation in the studied section,showing disposition of facies assemblages(FA).Three facies assemblages, viz. FA-1 (Channel facies assemblage), FA-2 (Fan facies assemblage), and FA-3 (Lateritic assemblage) constitute the lithocolumn. Samples were drawn at approximately 1 m vertical intervals from sand and mud horizons, excluding the gravel horizons. Abbreviations: PCSZ = Palghat-Cauvery Shear Zone; CSZ = Cauvery Shear Zone; ACSZ = Achankovil Shear Zone; FA = Facies assemblage; Xbedded = Cross-bedded.
On the basis of detailed sedimentological studies on two sections from the Pondicherry sub-basin,seven sedimentary facies were identified within the Cuddalore sandstone horizon (Absar et al., 2011).These can be grouped into two different facies assemblages (FA): 1) channel facies assemblage (FA-1),and 2) fan facies assemblage of braided fluvial to alluvial fan association (FA-2) (Fig. 1b). FA-1 occupied the basal part of the measured sections and is comprised of lenticular gravel facies (Fig. 2a and b),trough cross-stratified sandstone facies (Fig. 2c),planar cross-stratified sandstone facies, and planebedded sandstone facies. These are coarse to very coarse-grained in nature and represent channel element and bar element of a gravelly braided river(e.g. Miall, 1985). Good 2D exposures enable the identification of both lateral accretion (longitudinal bars) and downstream accretion (transverse bars)elements. Channel elements have the maximum erosional relief of 0.5 m, and the lenticular gravel unit pinches out laterally within a short distance of about 5 m. Rapid lateral pinching of gravel facies suggests a smaller order and a transverse characteristic of the paleochannel that was probably debouched into the major axial trunk river. The maximum set-thickness of 1.2 m of planar-cross bedded lithofacies indicates a ~1.5 m height of the longitudinal bar bedform. The absence of deep incision and floodplain fines, overall sheet-like geometry of the lithofacies all suggest broad shallow and braided characteristics of the channel. Rounded to subrounded pebble- and cobble-size clasts, and the imbrication of platy clasts indicate traction current,whereas angular and poorly-sorted coarse sand and granule-size clasts imply very high energy stream current. The cross-bed azimuths of FA-1 (n = 34)suggest the radial paleoflow with dominant current direction towards north-east (Fig. 2a). All these features suggest the deposition in a braided fluvial regime that was probably attached to a distal part of an alluvial fan system. The FA-2 facies of alluvial fan association overlie FA-1 facies and have sheet-like geometry. FA-2 facies are comprised of planebedded matrix-supported gravel facies, massive matrix-supported coarse sandstone facies and mud facies(Fig.2d).These are interpreted to be proximal and medial alluvial fan facies. The FA-2 facies undergone pervasive lateritisation and pedogenesis after deposition.The vertical gradation of lithofacies from FA-1 to FA-2 suggests the progradation of alluvial fan over the alluvial basin and indicates the active tectonism in the hinterland. These FA-2 facies are further overlain by‘transported’laterites(FA-3)with distinct unconformity, the thickness of whichincreases in the easterly direction. These upper laterites are constituted of plane-bedded and crossbedded gravels and massive coarse sandstones, suggesting a post-Miocene tectonic episode, the timing of which is uncertain.
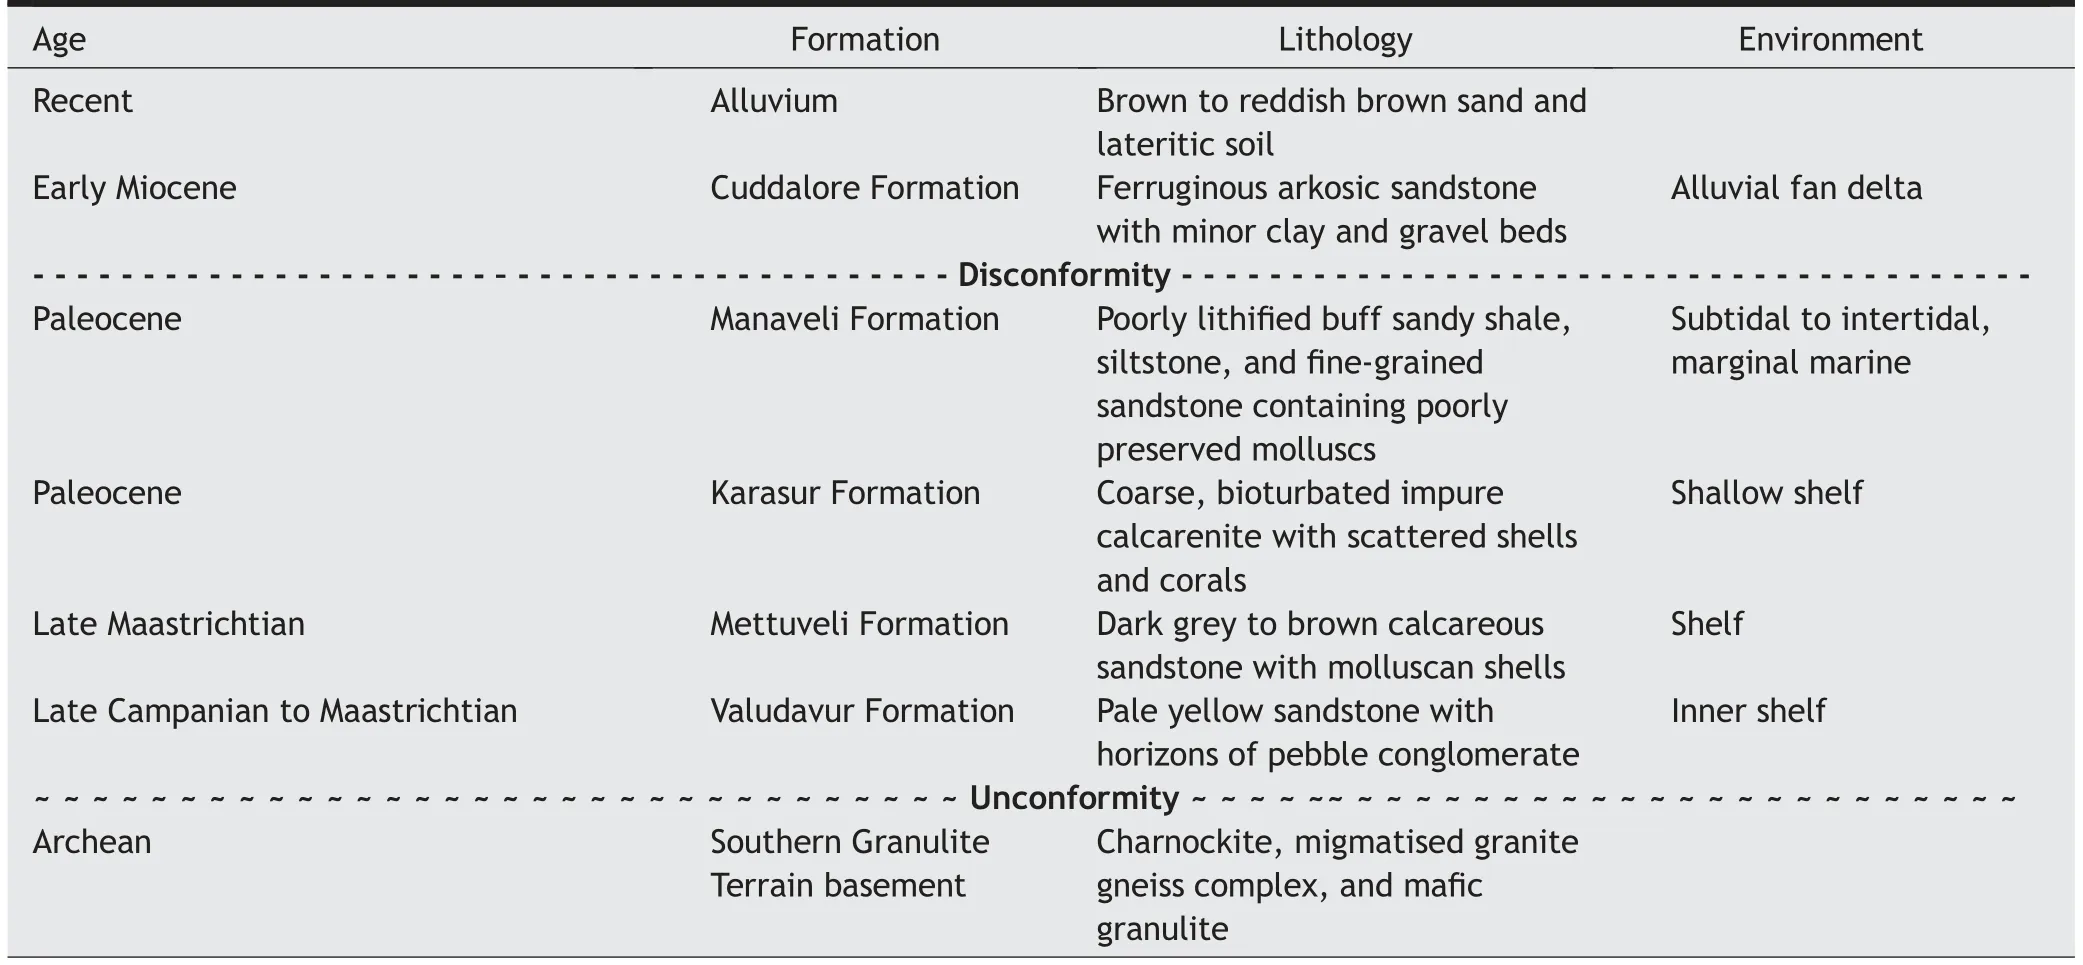
Table 1 -Generalized stratigraphic succession of Pondicherry sub-basin,Cauvery Basin,South India(compiled after Rajagopalan,1965;Sundaram et al., 2001;Malarkodi et al.,2009;and Mandaokar and Mukherjee,2014).
3.Methods
Detailed observations on sedimentary structures,texture,paleocurrent markers,and vertical and lateral facies relationship were carried out at nine measured sections with a cumulative thickness of 59 m at two localities(12.022°N,79.851°E and 11.998°N,79.845°E)in the Pondicherry sub-basin. Systematic sampling of sandstones and mudstones from all the measured sections was conducted according to the stratigraphic order.Samples were collected from freshly cut pits(for construction of check dam and building)below modern weathering surface. Sixteen representative samples(13 sandstones and 3 mudstones) were selected for further mineralogical and geochemical studies.Mineralogical and textural observations were done using a conventional petrological microscope on polished thin sections. Samples were grounded to very fine powder(>200 ASTM mesh) using agate ball mill and were used for further chemical analyses. Randomly oriented whole-rock powders and fine clay fractions of mudstones and kaolinised feldspars were analysed in XRD for the identification of mineralogical phases.The rock sample was gently disaggregated using an agate mortar and pestle for the separation of clay minerals,and fine particles (>200 mesh) were collected through dry sieving (ASTM 200). About 20 g sieved sample was added in ~500 ml deionised water in a plastic beaker and was suspended through constant stirring and ultrasonication. The beaker was left for overnight and the suspended particles were allowed to be settled gravitationally. The supernatant was then decanted and centrifuged. Obtained clay particles (<5 μm) were mounted in a glass slide (see Hardy and Tucker, 1988;Anbuselvan and Nathan, 2020 for details). Kaolinised feldspars in sandstone samples were carefully removed using a fine-tipped stainless steel pin, grounded finely using an agate mortar and mounted in glass slides.Glass slide mounts were scanned from 0°to 75°with a step size of 0.02°2θ and with a scan speed of 10 s/step,using nickel filter copper radiation in a Panalytical XpertPro X-Ray Diffractometer at the Department of Earth Sciences, Pondicherry University, India. Determination of expandable clays was done after the treatment with ethylene glycol at 60°C for 6 h. The slides of the clay fractions were further heated at a temperature of 550°C for 1 h to distinguish the chlorite and kaolinite peaks (Moore and Reynolds, 1997). The mineral phases were identified by using proprietary software Xpert Highscore. Major element concentrations were estimated by the standard wavelength dispersive X-ray fluorescence (WD-XRF) technique(Bruker S4 PIONEER) on pressed pellets at the Central Instrumentation Facility (CIF) of Pondicherry University. The XRF was calibrated with eight international silicate rock standards (USGS) with varying silica content. The accuracy of the instrument was checked by repeated analysis of USGS standard SCo-1 and estimated to be better than 2% for major oxides. Determination of trace elements and REE was carried out using inductively coupled plasma mass spectrometer(PerkinElmer Sciex ElAN DRCII) at the National Geophysical Research Institute, Hyderabad, India,following the procedure of Roy et al. (2007). The accuracy of the measurements were checked by analysing international reference standards GSR-4, AWI-1 and FER-1. The precision and accuracy of the ICP-MS analysis were both better than 5%.

Fig. 2 - Field photographs showing sedimentological features of the Miocene Cuddalore Formation. a Outcrop shows the presence of multiple gravel horizons, inset rose diagram shows a predominant north-easterly current direction; b Close-up view of a gravel layer shows features consistent with the deposition over a braided bar; c Tough cross-stratified matrix rich sandstone; d Thinly laminated floodplain mudstones cover the undulated sand bars; e and f show the presences of bright white color kaolinised feldspars in sandstones.
4.Results
4.1. Petrography and mineralogy
The Cuddalore sandstones (CS) are medium-to coarse-grained, with grain sizes ranging from 100 μm to 1000 μm(median=600 μm)(Fig.3).These are very poorly sorted, showing angular to sub-rounded grains.The fine size grains(100-200 μm)are angular in nature,while the coarse grains (600-1000 μm) are rounded(Fig. 3a and b). The majority (>90%) of the grains are quartz (Q) with subordinate amount of feldspars and lithic fragments (L). The quartz grains are mostly monocrystalline(Qm),with subordinate polycrystalline(Qp) grains. The Qm grains show undulose extinction.Qp grains show a mosaic of crystallites(n>3)oriented in certain directions (Fig. 3c). Lithic fragments (L) are dominantly schist and tabular in shape (Fig. 3d). The framework grains are loosely packed and bounded in hematite cement (Hc). The grain boundaries are often corroded by hematite cement(Fig.3a).The majority of the CS is semi-indurated,loosely packed,and contains a significant amount of matrix and framework grains floated over clay matrix. Two types of sandstones are identified, 1) arkose-subarkose with a significant amount of bright white kaolinised feldspars(Fig.2e and f) and 2) matrix rich clayey sandstone (Fig. 2c). Both types show the presence of a significant amount of clay matrix (20%-40%). Counting of framework grains in representative thin sections from the type 1 samples show Q78F19L3composition, wherein white kaolinised grains are counted as feldspars.Bulk rock powder X-ray diffraction patterns of both samples show the presence of quartz and kaolinite (Fig. 4a). No other framework silicate or clay minerals can be identified on the bulk sandstone rocks. On the contrary, the Cuddalore mudstone samples,the clay minerals and the kaolinised feldspars recovered from the Cuddalore sandstone hand specimens(cf. Fig. 2e and f), show well-defined peaks of kaolinite (Fig. 4b). X-ray diffraction patterns of the glycolated and heat-treated samples (Fig. 4b) further confirm kaolinite composition of clay and rule out the presence of other clay minerals(groups).
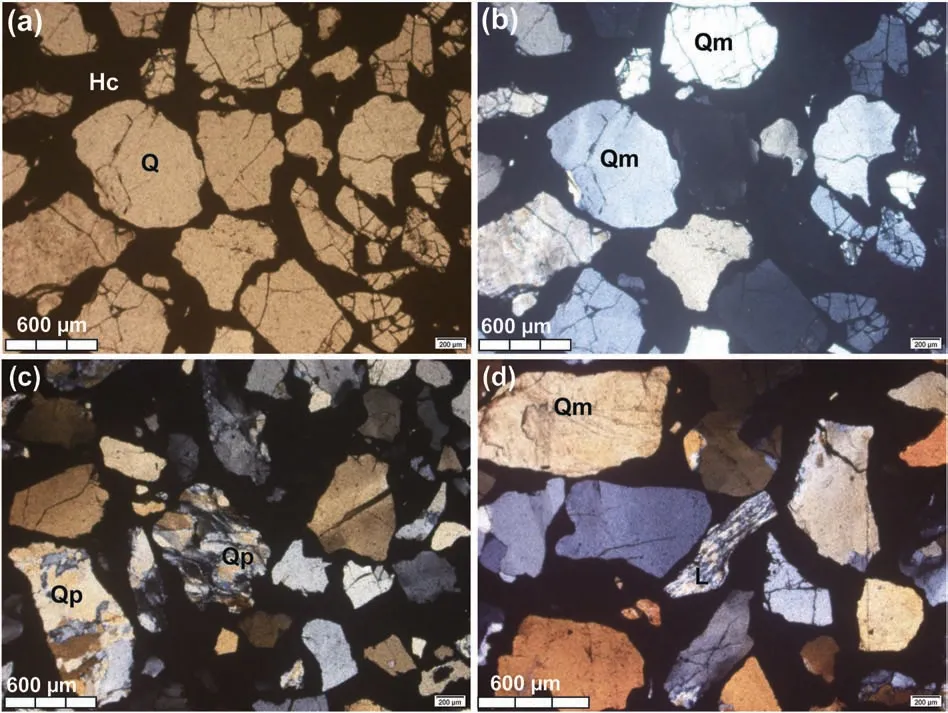
Fig.3 -Photomicrographs of Cuddalore sandstones showing a Angular to subangular grains of quartz(Q)set in hematite cement(Hc)(under plane polarised light); b Crossed Nicol view indicating monocrystalline nature of quartz (Qm); c Subangular to subrounded polycrystalline quartz(Qp)(crossed Nicol);d Tabular lithic grains(L)of schistose rocks(crossed Nicol).The bigger grains are rounded to subrounded in shape,whereas the smaller grains are angular and splintery, indicating nearness of provenance.
4.2. Geochemistry
The geochemical composition of the Cuddalore Formation sandstones (CS) and mudstones (CM) is presented in Table 2 and Table 3.CS show high and variable concentration of SiO2(73.5%-87.9%, avg. 82.2%) and moderate to high concentration of Al2O3(10.6%-22.9%,avg. 15.6%). On the other hand, CM show a very high concentration of Al2O3(~32%) and a relatively low abundance of SiO2(~62%). Besides Si and Al, concentrations of other elements are low.Fe2O3concentration in CS and CM varies between 0.7%and 4.5%.On the basis of SiO2/Al2O3and Fe2O3/K2O ratios, CS and CM can be classified as Fe-sand and Fe-shale respectively (Fig. 5,after Herron, 1988). Higher Fe2O3/K2O ratios in CM possibly arise from the selective retention of Fe3+and leaching of K+in oxidized paleo-weathering profiles,and the transfer of these records to the product sediments; whereas higher Fe2O3/K2O ratios in CS reflect the presence of hematite cements (Fig. 3a). However,most of the CS samples are classified as arkose on the basis of SiO2/Al2O3versus Na2O/K2O plot.Few CS samples plot on the Fe-shale field in Fig.5,because of the presence of a high amount of clay matrixes. However,these could be pseudo-matrix-derived from the breakdown of detrital feldspars. The Cuddalore Formation sandstones and mudstones show a smooth trend in Al2O3-SiO2space (r = −0.99, Fig. 6a), and mixture of various proportions of quartz and kaolinite can explain the compositional variation. Al2O3shows a strong correlation with TiO2(r = 0.97, Fig. 6c), indicating the weathering control (cf. Young and Nesbitt, 1998).Mutual correlations of Fe2O3with Al2O3(r = 0.83) and TiO2(r = 0.90) are high, indicating iron retention in paleo-weathering profile and oxygenated atmosphere(Absar et al., 2009).In comparison to the upper continental crust (UCC), concentrations of K2O, Na2O, CaO and MgO are low (Table 2; Fig. 7) but they show moderate to strong correlations with Al(r=0.76,0.32,0.85,and 0.76 respectively) (e.g. Fig. 6b), indicating that these elements are bound in clay-minerals and occur as the impurity within kaolinites. The trace element abundance of CS is low in comparison to the UCC,while CM shows parallel patterns to those of CS but higher concentration comparable to UCC (Fig. 7). The transition trace elements such as Sc(r=0.90),V(r=0.95),Cr(r = 0.88), Co (r = 0.84), and Ni (r = 0.6) show high correlation with Al. Similarly, various large ion lithophile elements (LILE) such as Th (r = 0.68), light rare earth elements (LREE, r = 0.61) and heavy rare earth elements(HREE,r=0.78),as well as high field strength elements (HFSE) like Y (r = 0.82) and Nb (r = 0.78) all show moderate to strong correlations with Al, suggesting that these immobile elements are hosted in clay minerals and can be utilised for deducing the provenance.On the contrary,other HFSE such as Zr and Hf do not show any correlation with Al, indicating these elements are controlled by the accessory heavy mineral zircon.However,LREE(r=−0.30)and HREE(r=−0.19)contents and indices of total REE fractionation [(La/Yb)CN, r = −0.56], LREE fractionation [(La/Sm)CN,r=−0.07],or HREE fractionation[(Gd/Yb)CN,r=−0.41]do not display significant correlations with Zr, indicating that rare earth elements (REE) are not controlled by accessory mineral zircons.Similarly,(La/Yb)CNand (La/Sm)CNdo not show correlation with Th,ruling out the monazite control on REE.Therefore,it is apparent that various immobile trace elements and REE are controlled by weathering of primary silicate minerals and can be used for provenance interpretation.

Fig. 4 - X-ray diffraction patterns of a representative bulk sandstone and b mudstone. The sandstone patterns show peaks of quartz and kaolinite,whereas mudstone is entirely composed of kaolinite.Glycolation sharpens the clay peak,which disappears on heat treatment(550 °C),confirming the kaolinite composition of clay.

Table 2 -Major elements composition(in wt.%)for the Cuddalore Formation.Computed values of different weathering indices,climatic variables such as average surface temperatures(Avg.surf.temp.)and mean annual precipitations(Mean ann.ppt.)are also included. CIA=100 ×Al2O3/(Al2O3+K2O+Na2O+CaO*).
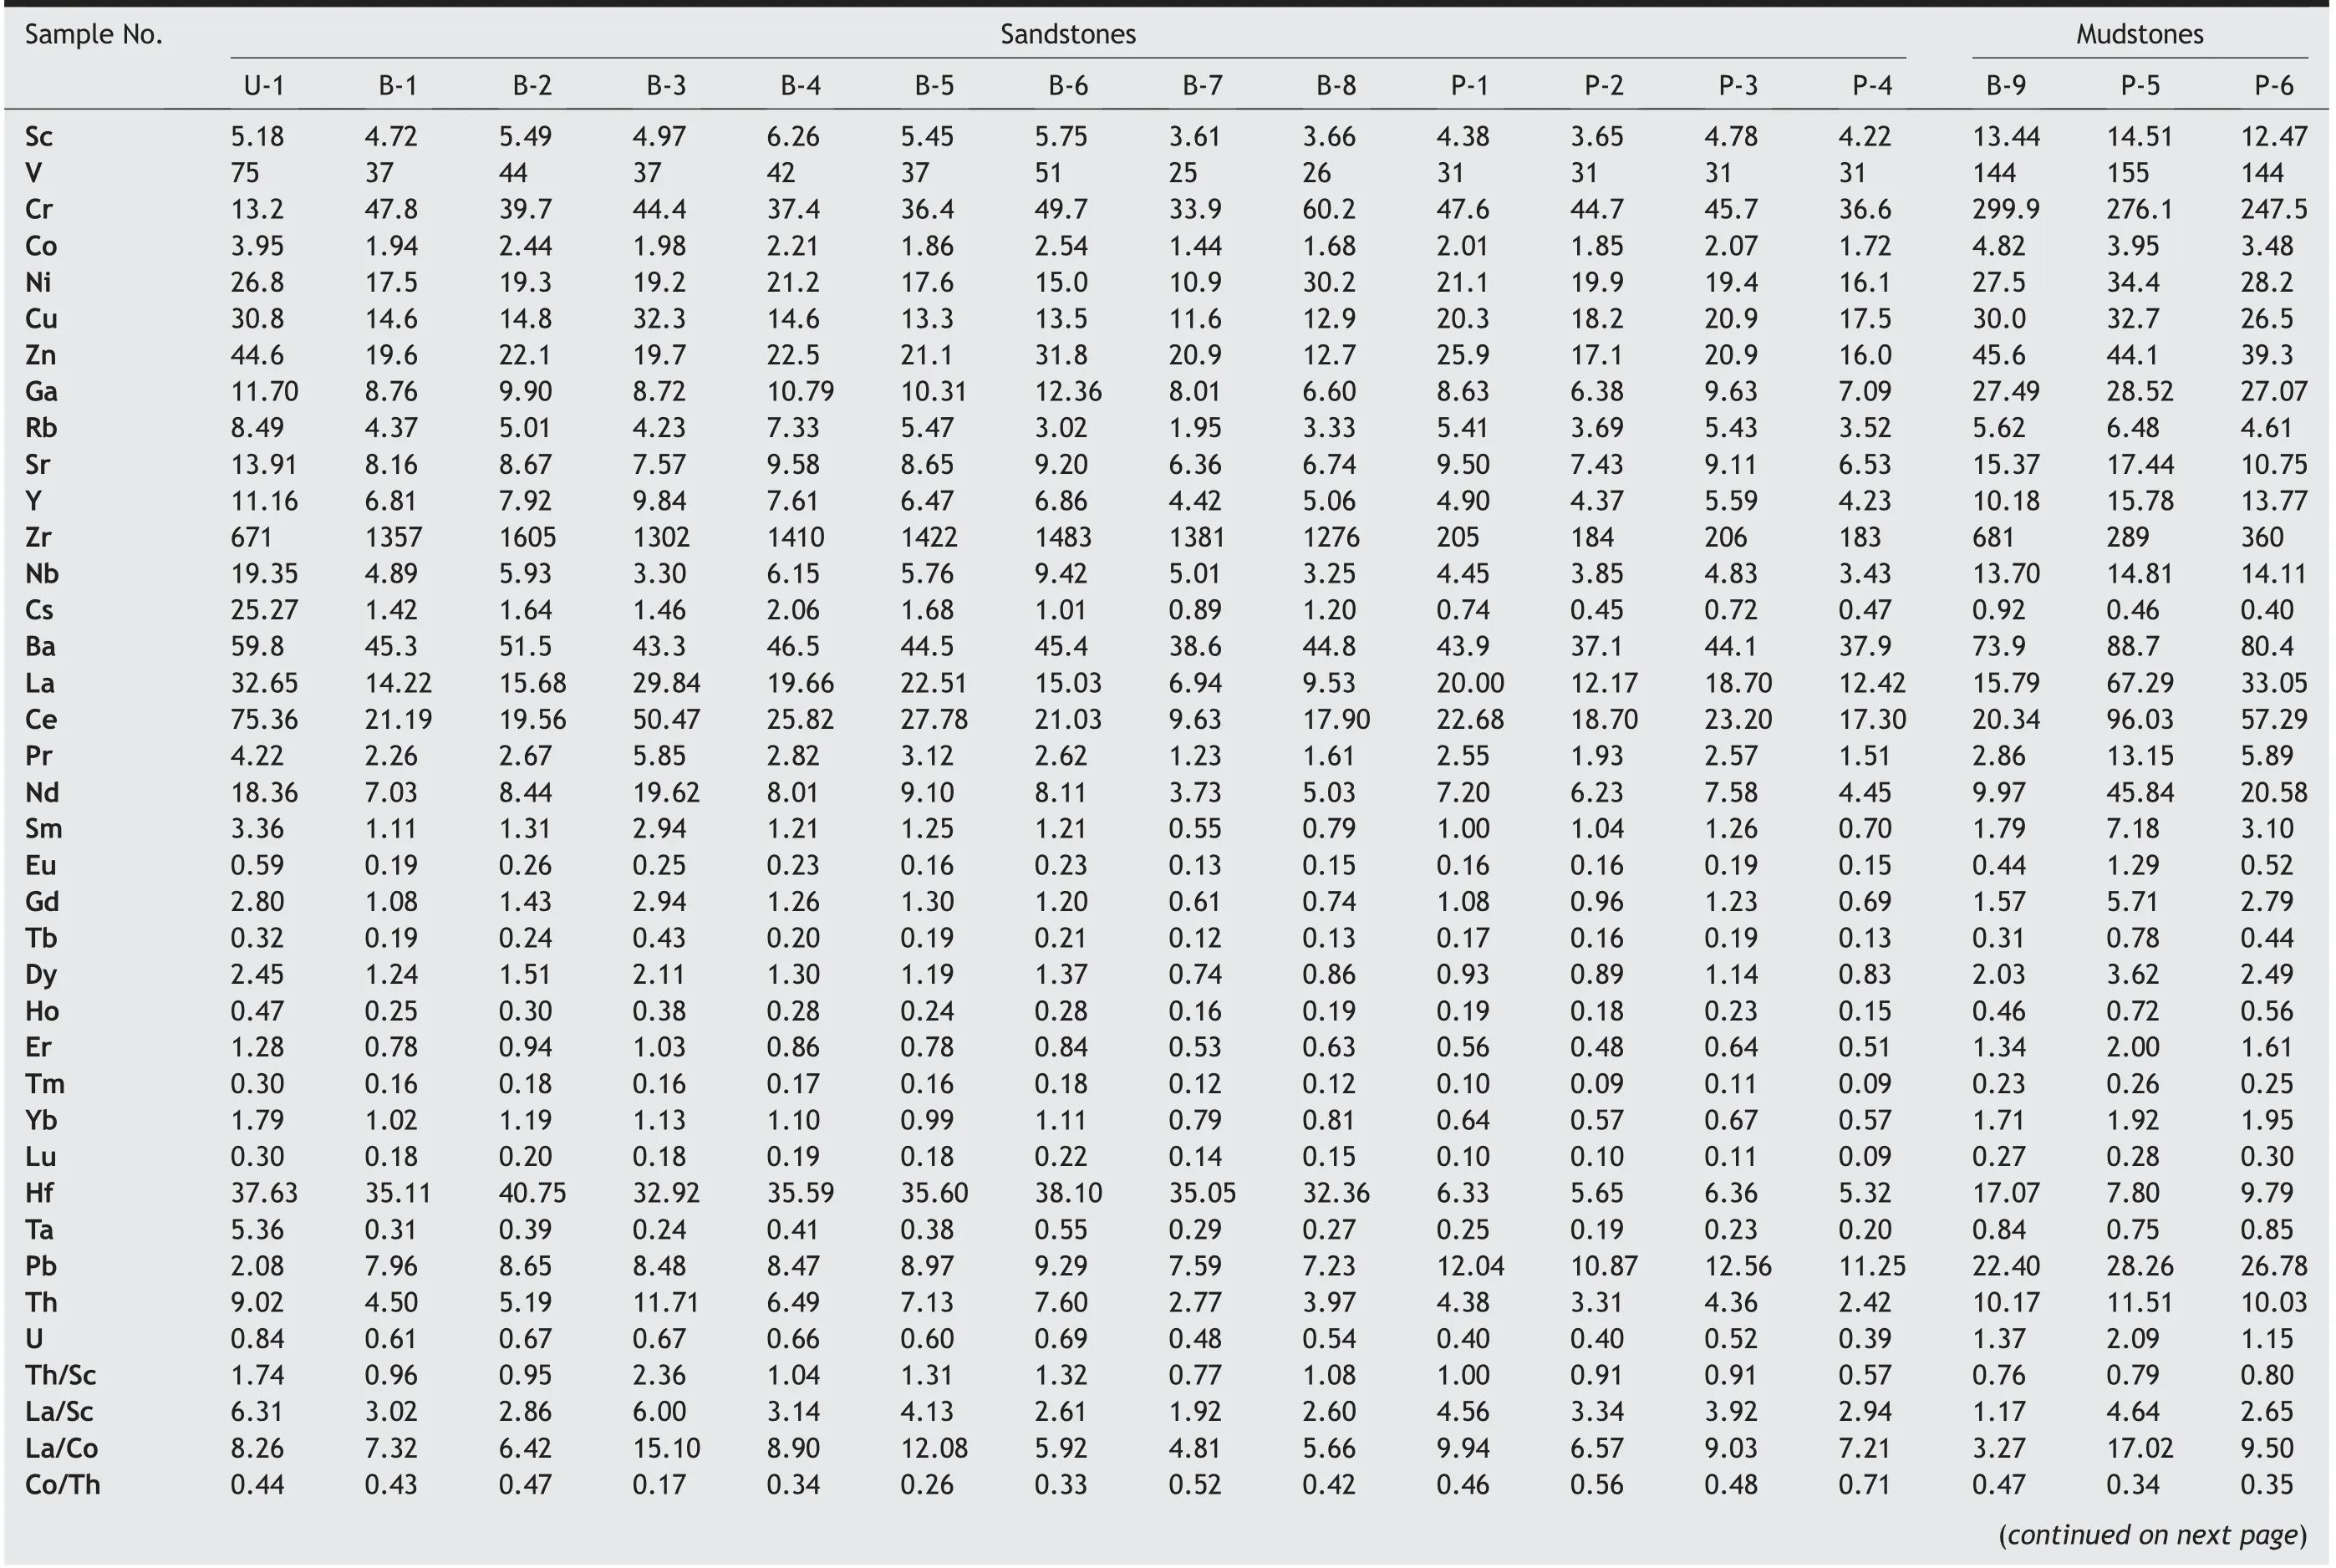
Table 3 -Trace and rare earth elementscomposition(in ppm)and some important geochemical ratios for the Cuddalore Formation.The subscript CN and UN refer to chondrite-normalized1/2 and UCC-normalizedratios, respectively.Eu/Eu*=EuN/(SmN× GdN).
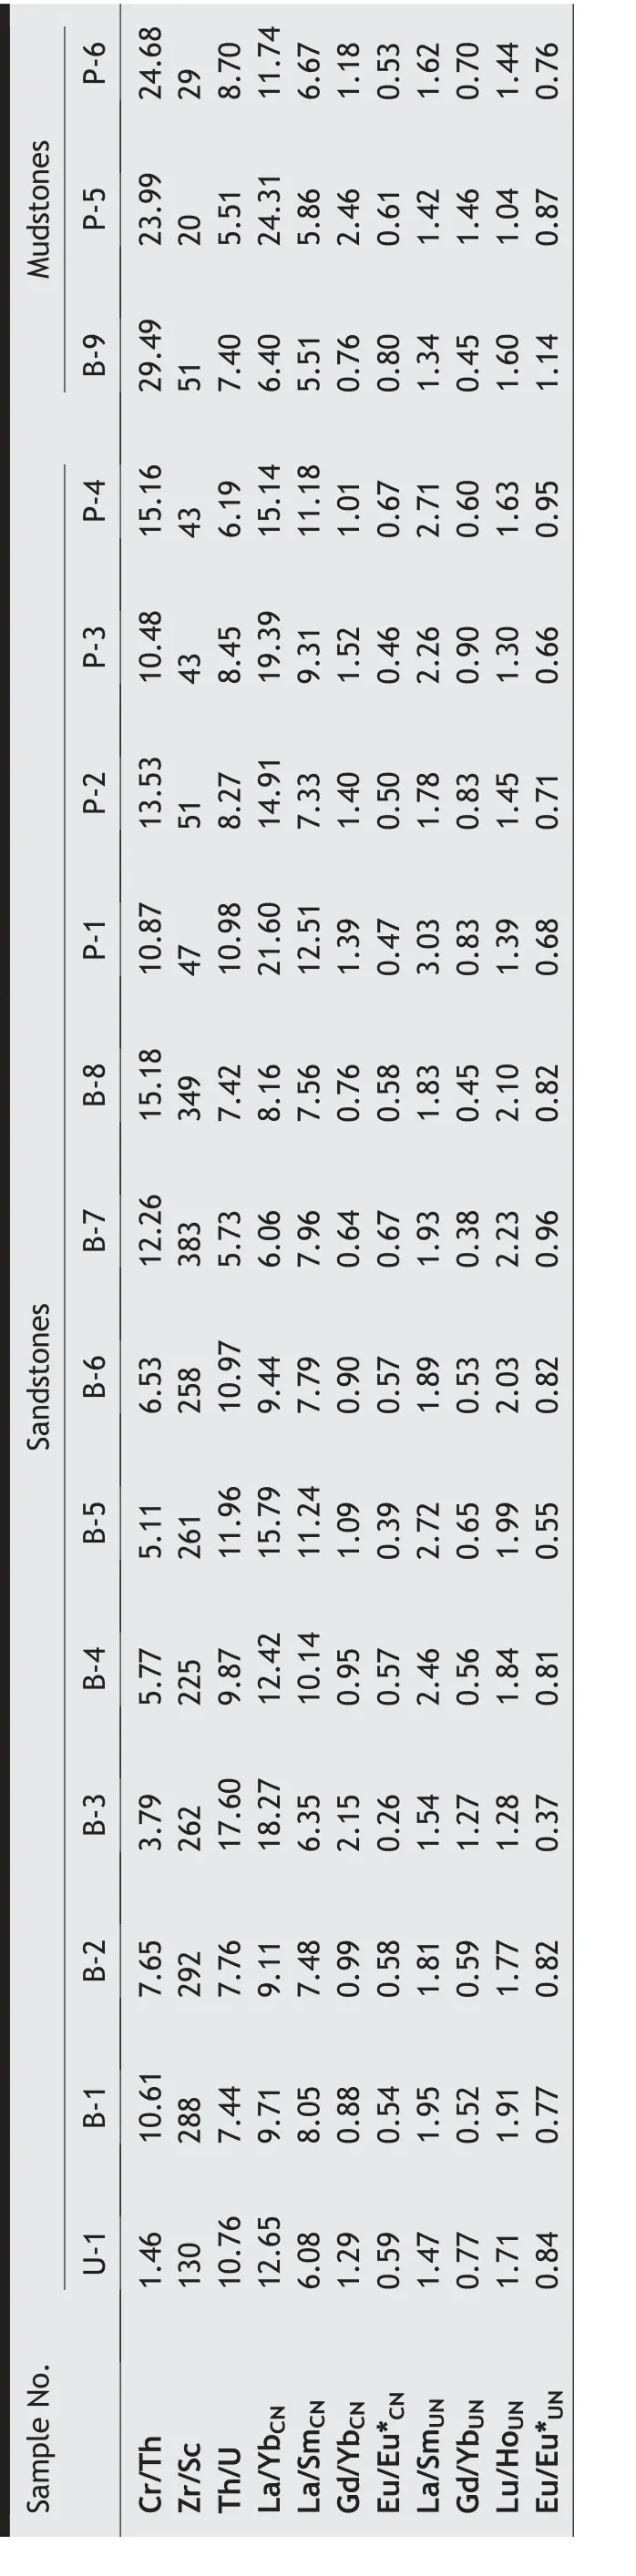
P-6 24.68 29 8.70 11.74 6.67 1.18 0.53 1.62 0.70 1.44 0.76 Mudstones P-5 23.99 20 5.51 24.31 5.86 2.46 0.61 1.42 1.46 1.04 0.87 B-9 29.49 51 7.40 6.40 5.51 0.76 0.80 1.34 0.45 1.60 1.14 P-4 15.16 43 6.19 15.14 11.18 1.01 0.67 2.71 0.60 1.63 0.95 P-3 10.48 43 8.45 19.39 9.31 1.52 0.46 2.26 0.90 1.30 0.66 P-2 13.53 51 8.27 14.91 7.33 1.40 0.50 1.78 0.83 1.45 0.71 P-1 10.87 47 10.98 21.60 12.51 1.39 0.47 3.03 0.83 1.39 0.68 B-8 15.18 349 7.42 8.16 7.56 0.76 0.58 1.83 0.45 2.10 0.82 B-7 12.26 383 5.73 6.06 7.96 0.64 0.67 1.93 0.38 2.23 0.96 Sandstones B-6 6.53 258 10.97 9.44 7.79 0.90 0.57 1.89 0.53 2.03 0.82 B-5 5.11 261 11.96 15.79 11.24 1.09 0.39 2.72 0.65 1.99 0.55 B-4 5.77 225 9.87 12.42 10.14 0.95 0.57 2.46 0.56 1.84 0.81 B-3 3.79 262 17.60 18.27 6.35 2.15 0.26 1.54 1.27 1.28 0.37 B-2 7.65 292 7.76 9.11 7.48 0.99 0.58 1.81 0.59 1.77 0.82 B-1 10.61 288 7.44 9.71 8.05 0.88 0.54 1.95 0.52 1.91 0.77 U-1 1.46 130 10.76 12.65 6.08 1.29 0.59 1.47 0.77 1.71 0.84 SampleNo.Cr/Th Zr/Sc Th/U La/YbCN La/SmCN Gd/YbCN Eu/Eu*CN La/SmUN Gd/YbUN Lu/HoUN Eu/Eu*UN

Fig.5 -Geochemical classification diagram showing Fe-sand,Feshale nature of the Cuddalore sandstones and mudstones (after Herron,1988). Some of the matrix-rich sandstones plot on the field of Fe-shale,because of high content of clay minerals.The index for sandstone(green box)and mudstone(red circle)are same in all the subsequent figures.
5.Discussion
5.1. Hydraulic sorting and sedimentary recycling
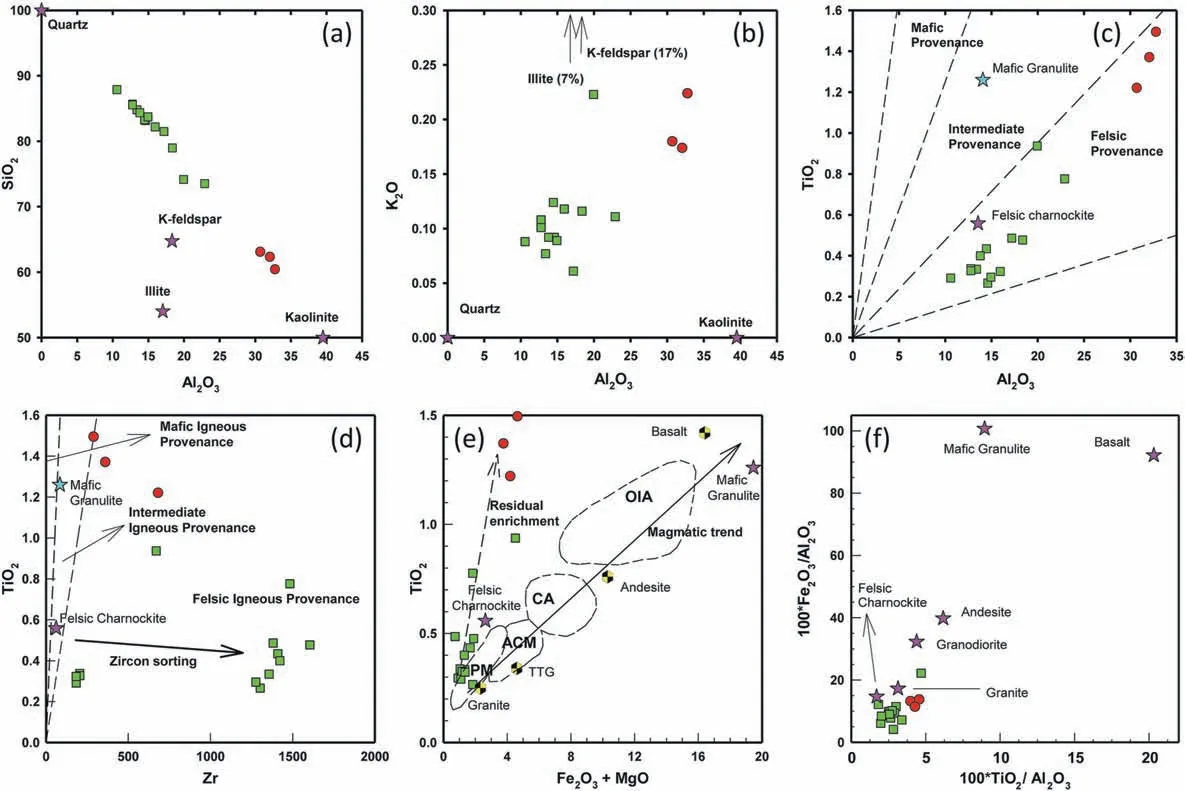
Fig. 6 - Major element based bivariate diagrams of Cuddalore sandstones (CS) and mudstones (CM). a Al-Si diagram showing a smooth trend indicates that the binary mixing of quartz and kaolinite explain the composition of CS and CM;b Al-K diagram showing a positive trend but very low concentration of K, indicates that K is hosted as impurity in kaolinite; c Al-Ti diagram showing a felsic provenance; d Zr-Ti diagram showing a felsic provenance which effects the zircon sorting; e (Fe + Mg)-Ti diagram displays significant difference from magmatic trend,indicating enrichment of Ti and depletion of Mg during weathering;f(Ti/Al)‒(Fe/Ti)diagram(after Wang et al.,2012)also shows the felsic provenance.The geochemical data of basement end-members of the SGT and common igneous rocks are from Condie(1993)and Gassama et al.(2012).Abbreviations:ACM=Active continental margin;B=Basalt;CA=Continental arc;OIA=Oceanic island arc;PM=Passive margin.
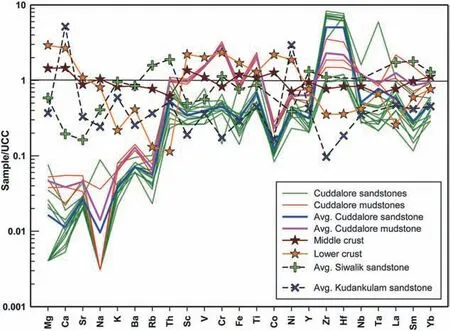
Fig.7 -Upper continental crust(UCC)-normalized multi-element diagram of the Cuddalore sandstones and mudstones.The data show the extreme depletion of Mg,Ca, Sr, Na, K, Ba and Rb in Cuddalore sediments, indicating severe weathering. Also the compositional data of the middle crust, lower crust and contemporary Siwalik sandstone(data from Kundu et al.,2016)and Kudankulam sandstone(Armstrong-Altrin et al., 2004) are plotted in the figure for comparison. The data of upper, middle and lower continental crust are from Rudnick and Gao (2003).
Cuddalore sediments are texturally immature,poorly sorted,consisting of angular grains(Fig.3).The detrital mineral assemblage of CS, with the predominance of angular monocrystalline quartz grains, suggests the first cycle origin of the sediments and a rapid uplift of basement comprising plutonic and high-grade metamorphic rocks. The variability of SiO2/Al2O3ratios in sediments effectively monitors the grain size partitioning (e.g. Galy et al., 2007) as clay-siltdominated suspended load is dominated by Al-rich phyllosilicate minerals and the bedload is dominated by Si-rich tectosilicate minerals. SiO2/Al2O3ratios of CS samples vary widely (3.21-8.31), while the ratios of CM samples show restricted variation(1.84-2.06),indicating compositional partitioning because of sorting. The smooth trend defined by CS and CM samples in Al2O3-SiO2compositional space (Fig. 6a) is indicative of the sorting effect. As already indicated,the majority of the immobile transition elements,LILE and HFSE show positive correlations with Al and their abundances are higher in CM than in CS, indicating grain size control and quartz dilution effect on the composition. Zr concentration in some CS samples is very high(~1400 ppm)and displays marked departure from magmatic Zr/Ti (Fig. 6c) and Zr/Sc (Fig. 8f)trends,indicating the sorting and fast settling of dense zircons in the bedload.The peculiar Zr‒Hf spike in the UCC-normalized multi-element diagram (Fig. 7) also indicates the zircon sorting.But,as already indicated,REEabundanceandREEfractionation patterns of CS and CM are unaffected by zircon sorting. It is pertinent to mention that elemental ratios involving other elements are independent of sorting and grain size effect. Therefore, we can utilize them to place constraints on provenance and weathering conditions.
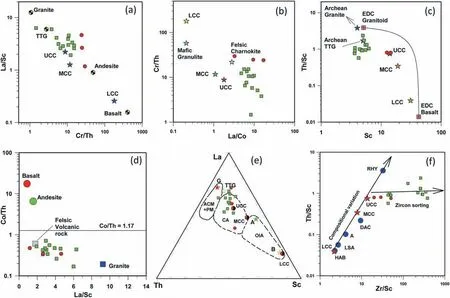
Fig. 8 - Trace element-based provenance discrimination diagram for the Cuddalore sandstones and mudstones. The a (Cr/Th)‒(La/Sc), b(La/Co)‒(Cr/Th), c Sc‒(Th/Sc), and d (La/Sc)‒(Co/Th) diagrams show predominantly felsic provenance, similar to the Archean tonalite--trondhjemite-granodiorite gneiss (TTG) and the felsic charnokite. The immobile trace elements show somewhat more felsic and evolved composition compared to the UCC.e La-Th‒Sc diagram shows the continental arc tectonic setting(after Bhatia and Crook,1986);and,f(Zr/Sc)‒(Th/Sc) diagram shows that the Zr/Sc ratios are consistent with the zircon sorting. Source of geochemical data for: the basement endmembers of SGT is from Gassama et al.(2012);the Eastern Dharwar Craton(EDC)granite and basalts is from Dey et al.(2014);the common igneous rocks is from Condie(1993);and,the lower(LCC),middle(MCC) and upper continental crust(UCC)is from Rudnick and Gao(2003).Abbreviations:A=Andesite;ACM=Active continental margin;B=Basalt;CA=Continental arc;DAC=Dacite;G=Granite;HAB=High alkali basalt;LSA=Low silica andesite;OIA=Oceanic island arc;PM=Passive margin;RHY=Rhyolite;TTG=Tonalite-trondhjemite-granodiorite gneiss.
5.2. Provenance
Cuddalore sandstones are very coarse-grained(with an average size of ~500 μm), texturally immature, and show abundant angular grains. These are chiefly composed of monocrystalline quartz, with subordinate amounts of polycrystalline quartz, lithic schistose fragments and fresh/kaolinised feldspar grains (Fig. 3). The sedimentological attributes, such as the presence of sheet gravels (Fig. 2a and b), indicate deposition in the distal part of an alluvial fan(Absar et al., 2011). The overall sedimentological,textural and mineralogical features of CS are consistent with the rapid upliftment of plutonic/metamorphic basement terrain, the short transport and deposition near the source. Cross-bed azimuths measured in this study show a radial paleocurrent pattern,with a dominant mode towards the northeast(Fig. 2a), suggesting that the sediment source is from the southwest of the depositional basin and transports in north-easterly directions. The outcrop pattern of the Cenozoic cover sediment (Fig. 1) also indicates deposition in the eastern continental margin of peninsular South India. All these features are consistent with the sediment derivate from inland areas of SGT, through the fluvial transport, deposited in the NE-SW trending alluvial basin during the Eocene-Miocene time. The nature of the provenance can be further constrained from the geochemical composition of the CS and CM.
Geochemical composition of siliciclastic sedimentary rocks is mainly controlled by the nature of the source rocks, however secondary processes like weathering, sorting during transport and diagenesis can alter the primary composition (McLennan et al.,1990, 1993; Cullers, 2000; Armstrong-Altrin et al.,2004; Zhang et al., 2014; Baldermann et al., 2020;Chougong et al., 2021). Several insoluble elements with very low seawater residence time remain immobile during sedimentary processes, then are transferred almost quantitatively from the source to the sink, and can be used to infer the provenance of siliciclastic sedimentary rocks (Taylor and McLennan,1985). The concentration of immobile elements of Al, Ti and Zr is controlled by magmatic fractionation and their ratios in siliciclastic sedimentary rocks can be used to trace the provenance.The Al2O3/TiO2ratios of igneous rocks increase with the magmatic fractionation,from mafic to felsic rocks,with typical ratios of mafic rocks, intermediate rocks and felsic rocks range between 3-8, 8-21 and 21-70, respectively(Hayashi et al.,1997).The Al2O3/TiO2ratios of CS and CM vary between 21.28 and 54.85 with an average of 35.7, envelop the signatures of felsic charnockites of SGT, and indicate a dominant felsic provenance(Fig.6c).Similarly,the TiO2/Zr ratios of CS and CM also attest a felsic provenance, but the majority CS data show anomalous Zr concentration indicating zircon sorting (Fig. 6d). Bhatia (1983) showed that TiO2and Fe2O3+MgO concentrations of the first-cycle siliciclastic turbidites follow the magmatic fractionation trend,which depends on the tectonic setting(Fig.6e).The majority of the CS samples is plotted near the felsic charnockite field in this diagram (Fig. 6e), but the array of CS and CM defines a different trend compared to magmatic fractionation, indicating removal of Mg and residual enrichment of Ti during weathering. Fe is immobile in oxidized condition,occur as Fe3+and move as particulate matters;in such conditions,both Fe/Al and Ti/Al ratios of the daughter siliciclastics mimic the igneous trend and can be used to decipher provenance. In the (Ti/Al)‒(Fe/Ti) diagram(after Wang et al.,2012),CS and CM samples fall in near felsic charnockite and granite(Fig.6f)but plot away from mafic and intermediate rocks, indicating that the source was mainly composed of felsic plutonic rocks with little or no contributions from mafic granulite or basaltic rocks.
Distributions of various least-mobile trace elements such as REE,Th,Zr,Sc,Co,Cr are useful in deducing the composition of the provenance (e.g. Taylor and McLennan, 1985; Wronkiewicz and Condie, 1990;McLennan et al., 1993; Cullers, 1994, 2000; Absar et al., 2009; Absar and Sreenivas, 2015; Large et al.,2018; Bankole et al., 2020). The relative concentration and ratios of both the incompatible(e.g.REE,Th,Zr)and the compatible(e.g.Sc,Cr,Co)element groups are useful in discriminating felsic and mafic source rocks (e.g. Bhatia and Crook, 1986; Feng and Kerrich,1990; Manikyamba and Kerrich, 2006; Mondal et al.,2012; Absar and Sreenivas, 2015; Armstrong-Altrin et al.,2015;Madhavaraju et al.,2020a,2020b).
The composition of the CS and CM samples is plotted in various provenance discrimination diagrams involving ratios of these incompatible and compatible element pairs(Fig.8).Different probable source rocks of the catchment area (data from Gassama et al., 2012), and different igneous end member rocks (data from Condie, 1993), as well as the composition of the upper, middle and lower continental crusts(data from Rudnick and Gao,2003)are plotted in the diagrams for comparison. In the (Cr/Th)‒(La/Sc)diagram(Fig.8a),most of the CS and CM samples show more felsic composition relative to the UCC, indicating a mixed tonalite-trondhjemite--granodiorite gneiss (TTG) and granite source. A similar situation is observed in the (La/Co)‒(Cr/Th)diagram (Fig. 8b), where the majority of CS and CM samples define more felsic composition than the UCC,as well as the felsic charnockites of Madras Block.The Sc‒Th systematics is considered to be a strong discriminant of provenance (e.g. Bhat and Ghosh,2001; Manikyamba and Kerrich, 2006; Manikyamba et al., 2008; Absar et al., 2009). In the Sc‒(Th/Sc)diagram (Fig. 8c), CM shows composition similar to the UCC, whereas CS shows the Archean TTG provenance. It is noteworthy that the CS and CM samples are plotted away from the mixing line of felsic and mafic end-members of the Eastern Dharwar Craton(EDC), precluding their involvement as source. The(La/Sc)‒(Co/Th) binary diagram (Fig. 8d) as well as the La-Th‒Sc ternary diagram (Fig. 8e), showing higher Th/Sc, La/Sc, Co/Th ratios of the Cuddalore sediments than those of the UCC, suggest the felsic composition of sources rocks. As already discussed,Zr/Sc ratios of the CS samples are anomalously high and indicate zircon sorting (Fig. 8f). The results clearly suggest that the composition of the exposed catchment area of Cuddalore fluvial basin was similar or somewhat more felsic in comparison to the UCC during the Miocene.
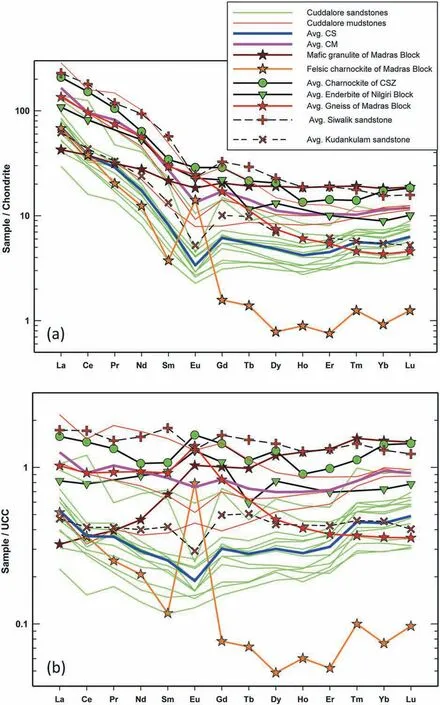
Fig. 9 a Chondrite-normalized and b UCC-normalized rare earth element diagrams for the Cuddalore sandstones and mudstones. Probable source rocks are also shown for reference. Cuddalore sediments show fractionated LREE pattern, flat HREE pattern and strong negative Eu anomaly similar in chondrite-normalized diagram. Both chondrite- and UCC-normalized diagrams show parallelism of Cuddalore sediments with felsic charnockites of Madras Block, suggesting sediment contribution from such source. Data sources: Felsic charnockite and mafic granulite of Madras Block,SGT(Gassama et al.,2012);Migmatite gneiss of Madras Block(Azhar-Ul-Haq et al.,2021);Charnockite of Cauvery Shear Zone(CSZ)(Tomson et al.,2006);Enderbite of Nigiri Block(Tomson et al.,2013);Siwalik sandstone(Kundu et al.,2016);Kudankulam sandstone(Armstrong-Altrin et al.,2004).Normalizing values for the chondrite and the UCC are after McDonough and Sun(1995)and Rudnick and Gao (2003) respectively.

Fig. 10 - Results of REE mixed model show that REE patterns of the Cuddalore sediments can be explained by the mixing of 80%felsic charnockite and 20%mafic granulite of Madras Block,SGT.The discrepancy in absolute abundances of REE and Eu-anomaly is because of residual enrichment and preferential loss of the europium in comparison to other REEs during extreme weathering.
The exact nature and composition of the source rocks can be further studied by the rare earth element(REE) composition of the Cuddalore sediments (Table 3). The CS and CM samples show parallel chondritenormalized patterns with high total REE fractionation(average La/YbCNof 13.44), high LREE fractionation(average La/SmCNof 8.19)and low HREE fractionation(average Gd/YbCNof 1.21), and show prominent negative europium anomalies with Eu/Eu* ranging from 0.26 to 0.80 (average 0.55) (Fig. 9a). Data of various probable source rock end-members from the SGT are also plotted for reference. The felsic charnockites, mafic granulite enclaves and migmatitic gneiss from the Madras Block cropping out in the northwest Cuddalore Basin show markedly different REE patterns. The felsic charnockite and migmatitic gneiss show high total REE and HREE fractionation in comparison to the Cuddalore sediments, whereas the mafic granulite shows much flatter REE patterns(Fig.9a).This indicates that these individual basement end-members cannot yield sediment with similar REE patterns as CS or CM. However, a variable mixture of felsic and mafic end-members can explain the REE patterns, which is explored further. The CS and CM samples display parallel patterns to the pattern of the charnockite from the Cauvery shear zone of Madurai Block and that of the enderbite of Nilgiri Block, indicating sediment shed-off from such source rock. The REE patterns of the CS and CM samples are also similar to the Miocene Kudankulam sandstone of South India,which has been interpreted to be derived from the gneiss, charnockite, and granite of the Kerala Khondalite Belt (Armstrong-Altrin et al., 2004). Cuddalore sediments also show REE patterns similar to the Mio-Pliocene Siwalik Group, Himalayan foreland basin(Fig. 9a), which were mostly derived from felsic crystalline rocks of Higher Himalaya (e.g. Sinha et al.,2007; Ranjan and Banerjee, 2009; Kundu et al.,2016). The similarity of REE patterns of CS and CM samples with these rocks indicates the derivation of sediments is from the felsic upper continental crust.More detailed comparison of likely provenances can be made in UCC-normalized REE diagram(Fig.9b).In the UCC-normalized diagram(Fig.9b),CS and CM samples typically display concave upward REE patterns, with high LREE fractionation (average La/SmUN= 1.98),HREE enrichment (average Lu/HoUN= 1.68) and high negative Eu anomaly (average Eu/Eu*UN= 0.78). As indicated earlier that HREE enrichment is not controlled by the sorting of heavy minerals like zircon.The felsic charnokites of the Cauvery Shear Zone(CSZ)and the Madras Block show similar HREE enrichment with average Lu/HoUNratios of 1.57 and 1.61,respectively, indicating the source control. It is suggested that a small amount of garnet present in these source rocks controls the HREE pattern and subsequently transfers into the weathered sediments. On the other hand,the migmatitic gneiss of Madras Block shows a contrasting HREE-depleted pattern compared to the patterns of the CS and CM(Fig.9),ruling out its involvement as potential source rocks.On the basis of the paleocurrent directions (Fig. 2a) and the mineralogical and textural immaturity of CS(Figs.2e and f,3), it is suggested that the Cuddalore sediments were derived from nearby Madras Block situated in the southwest of the paleo-depositional basin. Madras Block is comprised of three dominant rock types,migmatitic gneisses mostly occupying low lying areas,and felsic charnockites with mafic granulite enclaves forming topographically elevated areas. From the above discussions, it is evident that sediment contribution from migmatitic gneisses can be ruled out.Therefore, we consider the felsic charnockites and mafic granulite enclaves as the provenance endmembers and use their REE compositions for modelling and assuming the conservative behaviour of REE.The REE mixed model shows 80%contribution of felsic charnockites and 20% contribution of mafic granulites to the sediment budget of the Cuddalore Basin(Fig.10).Both LREE fractionation(La/SmUN)and HREE enrichment(Lu/HoUN)parameters of the mixed model show an excellent match with the Cuddalore sediments. However, absolute abundances of REE vary because of quartz dilution in sands and residual enrichment in weathered clay materials. The CS and CM samples show contrasting negative Eu anomaly compared to the positive Eu anomaly of the modeling result. The CSZ charnockites also show similar LREE and HREE patterns but different MREE pattern compared to the CS and CM samples. It is suggested that the europium element probably was mobilized during high-intensity chemical weathering (e.g. Gao and Wedepohl, 1995), explaining the negative Eu anomaly in CS and CM.However,negative Eu anomaly can also arise from the contribution of various intrusive granitoids, which were emplaced during multiple orogenic phases during Neoproterozoic and Pan-African time within the SGT (Fig. 1; e.g. Santosh,2020). More detailed studies involving Nd-isotopic composition of bulk sediments, or U-Pb ages and Hfisotope systematics of detrital zircons are required to test such a hypothesis.On the basis of present data,we interpret that the Cuddalore sediments were derived from the felsic charnockites and mafic granulites of Madras Block in the Southern Granulite Terrain.
5.3. Paleoweathering condition and climate
Chemical weathering of continental rocks is controlled by climate and tectonics(Ruddiman,1997).Acid hydrolysis of primary silicate minerals during chemical weathering consumes CO2and increases the alkalinity,and the subsequent carbonate precipitation provides a long-term sink of atmospheric CO2and therefore can modulate the climate (e.g. Walker et al., 1981; Kump et al., 2000). Chemical weathering is influenced by atmospheric pCO2, surface temperature, and precipitation level. In addition to these,composition and exposure age of silicate rocks,slope angle, porosity of weathering profile/soil,types of vegetation (related to root acid and heterotrophic respiration of microorganism) also can control the weathering(e.g.Sheldon and Tabor,2009;Perri,2020;Wang et al., 2020; and references therein). Rate of silicate mineral decomposition and water‒rock reaction increases with rising temperature and intensification of hydrological cycle, resulting in more effectively flushing out of the weathering products and delivery of nutrients to the ocean (Chebykin et al.,2002; Le Hir et al., 2009).

Fig. 11 - A-CN-K (Al2O3-(CaO* +Na2O)-K2O; molecular proportion) diagram (after Nesbitt and Young, 1982) of the Cuddalore sediments shows extreme weathering in the source terrain and/or in the depositional basin.Probable source rocks and idealized minerals are shown for comparison (data sources are same as Fig. 9).
The mineralogical and chemical composition of the final weathering product depends on the intensity of chemical weathering - clay minerals like smectite and/or illite are produced at lower weathering intensity,whereas kaolinite and gibbsite are produced at higher intensity (e.g. Nesbitt and Young, 1982;Wilson,1999).Highly soluble cations such as Ca2+,Na+and K+are preferentially removed through hydrological circulation, whereas relatively insoluble cations such as Al3+and Ti4+remain fixed in the weathering profile and concentrate in the soil residue (Nesbitt et al., 1980). The relative mobility of these element groups depends on the weathering intensity and,therefore, can offer quantification of weathering intensity. In situ paleosols can reflect the weathering intensity at a particular site but their preservation potential is low and is restricted in continental setting.In contrast,transported sediments are well preserved as siliciclastic rocks, which are widely available and can represent the weathering condition of a larger area(e.g.Wang et al.,2020).The kaolinite is the only clay mineral present in the CM and CS and other clay minerals like smectite or illite are absent, suggesting extreme chemical weathering. The UCC-normalized multi-element diagram of the CM and CS (Fig. 7)shows extreme depletion of Ca, Mg, Na, K, Ba, Sr and Rb(<0.1×UCC)relative to insoluble elements like Ti,Th and Nb, indicating severe weathering (Nesbitt et al., 1980; Wronkiewicz and Condie, 1987). Fe concentration of the CM and CS is similar to that of the UCC and no marked depletion is noted in the diagram(Fig.7).Besides,Fe shows mutual correlations with Al and Ti.These features show insolubility and retention of iron in paleo-weathering profile, which indicates oxidative weathering (Absar et al., 2009).
Various indices are proposed in the literature to quantify weathering intensity.Nesbitt and Young(1982)proposed quantification of chemical index of alteration[CIA=100×Al2O3/(Al2O3+K2O+Na2O+CaO*)]on the basis of relative mobility of Ca,Na and K with respect to immobile Al during the weathering of feldspars,where all these elements are in molecular proportion, and CaO* represents calcium in silicate fraction. CIA is the most widely used weathering index, and is very useful for determining the weathering intensity of feldsparbearing felsic rocks. CIA index of both CM (98.2-98.6)and CS (97.0-98.9) are very high and shown in an A-CN-K ternary diagram(Fig.11),in which CIA variation is displayed on the vertical axis (e.g. Nesbitt and Young, 1984; Fedo et al., 1995). As discussed in the earlier section that the felsic charnockite was the dominant source for CM and CS.Fresh felsic charnockite from the Southern Granulite Terrain(SGT)is plotted in the diagram and shows a CIA value of ~50 similar to feldspars;and the mafic granulite shows a CIA value of~40. Primary minerals (e.g. feldspars) have lower CIA values(~50),and the weathering of these minerals results in the formation of phyllosilicate clay minerals.During initial weathering only Ca and Na are removed from the parent rock, and the composition of weathering products evolve along the predicted weathering path(trend A in Fig.11,parallel to A-CN join)and form intermediate weathering products such as illite and/or smectite depending on the source rock composition,showing moderate CIA values between 75 and 85. During more intense weathering,K is also removed,and the composition of weathering products evolves along the trend B, producing more Al-rich clay minerals such as kaolinite and gibbsite with CIA values approaching to~100(e.g.Nesbitt and Young,1984;Fedo et al.,1995).CM and CS samples show high CIA values above 98(Fig. 11) and kaolinite is the sole clay mineral phase(Fig. 4), indicating extreme weathering under warm and humid conditions. These values are marginally higher than CIA of clay factions of present-day weathering profiles developed on charnockites and gneisses of Southern Granulite Terrain (90-97.8; Sharma and Rajamani,2000, 2001), indicating a higher intensity of weathering during the Miocene.
Gaillardet et al. (1999) computed weathering indices of several mobile elements by comparing their concentration with an immobile element of similar magmatic compatibility in the sediment, and its enrichment/depletion relative to the UCC (after Rudnick and Gao, 2003). The weathering (mobility)indices, denoted as α, are calculated as following:αMg= [Al/Mg]sed/[Al/Mg]ucc; αCa= [Ti/Ca]sed/[Ti/Ca]ucc; αNa= [Sm/Na]sed/[Sm/Na]ucc; αK= [Th/K]sed/[Th/K]ucc; αSr= [Nd/Sr]sed/[Nd/Sr]ucc; αBa= [Th/Ba]sed/[Th/Ba]ucc. The absolute numerical value of α indicates the intensity of chemical weathering-the α value equals to 1 when there is no net chemical weathering; and α values greater than 1 indicate the depletion with respect to UCC. The αMg, αCa, αNa, αK,αSr, and αBavalues of the Cuddalore sediments are given in Table 2. These values are significantly high(αMg=41-277,αCa=40-118,αNa=11-499,αK=5-34,αSr= 7-31, and αBa= 4-10), indicating severe weathering. Al these indices show mutual positive covariation but are not correlated with Al/Si ratios,indicating that these reflect true weathering conditions and not an artefact of sorting. Th/U ratios of CS and CM are very high,ranging from 5.5 to 17.6 with an average of 9, indicating a high degree of weathering(McLennan et al., 1993). In summary, different weathering indices show mutually correlatable results and indicate extreme weathering conditions during deposition of the Cuddalore Formation.
Sedimentological facies association and textural immaturity of CS indicate the derivation from a rapidly uplifted local source, CIA of such source siliciclastics should be low, similar to fresh source rocks. However,the CS show very high CIA values (98-99.3) compared to CIA values of felsic charnockites of SGT (40-50).Post-depositional rock-water interaction within the permeable sand horizons in the depositional basin may explain such high CIA and the kaolinisation of feldspars in CS. Such post-depositional but contemporary weathering within the basin is recognized in large river basins, such as the Ganga Basin (e.g. Singh, 2009;Lupker et al., 2012). On the contrary, CM represents fine-grained flood-plain deposits with very low permeability, precluding post-depositional alteration.Very high CIA values (98.2-98.6) of the CM samples,therefore possibly represent true weathering condition of the catchment area of Cuddalore alluvial basin.In either case, high CIA values of CS and CM indicate severe weathering in catchment area or within depositional basin under warm and humid conditions. It is interesting to note that CIA values of the Cuddalore sediments are much higher compared to the contemporary Himalayan foreland basin sediments belonging to the Siwalik Group(CIA =57-81;Sinha et al.,2007;Ranjan and Banerjee,2009;Kundu et al.,2016).These low to moderate CIA values reflect the dominant physical weathering of catchment area,i.e.,the area near Main Central Thrust (MCT) and Main Boundary Thrust (MBT) of Himalayan mountain belt, and reflect the deposition in a tectonically-active rapidly subsiding foreland basin (e.g. Brozovic and Burbank, 2000).On the other hand, the tectonically-inactive ‘passivemargin’ Cuddalore Basin suffered dual weathering -high physical weathering along uplifted shear zones/terrain boundaries of SGT (e.g. Valdiya, 1998),generating coarse arkosic sandstones, and, extreme chemical weathering in rest of the catchment area producing kaolinitic mudstones. Indeed, several bauxite deposits, a residual weathering product developed over charnokitic bedrocks are recognized in Northern and Nilgiri blocks of SGT, and are thought to be formed during Tertiary time(e.g.Subramanian and Murthy, 1976; Khan, 1984; Govindraju, 1987).
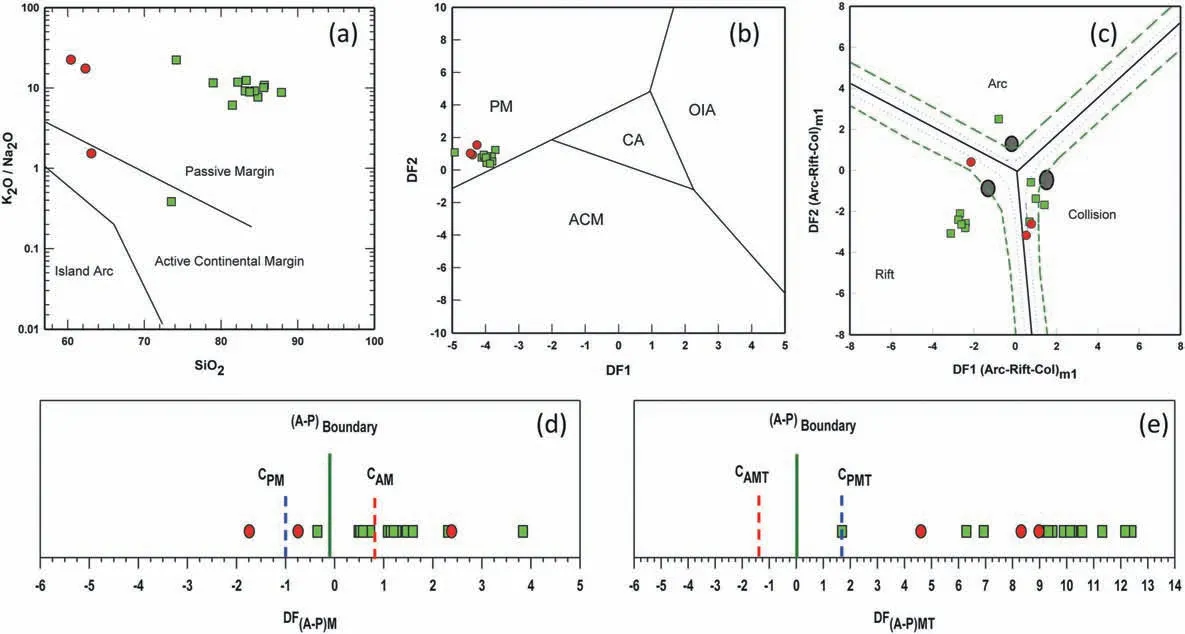
Fig. 12 - Tectonic setting discrimination diagrams based on the Cuddalore sandstones and mudstones. a SiO2 versus K2O/Na2O tectonic discriminant diagram (after Roser and Korsch, 1986) and b Discriminant function (DF) diagram (discriminant functions and fields are after Bhatia,1983)both show a passive margin tectonic setting for the depositional basin;c Multidimensional discriminant function diagram(highsilica clastic sediments; after Verma and Armstrong-Altrin, 2013) shows only 50% success rate, and only 9 out of 16 samples show true rift setting,rest of the samples erroneously show collision or arc setting;d One-axis discriminant function(DF(A‒P)M)diagram based on 10 major elements (after Verma and Armstrong-Altrin, 2016) shows an active margin tectonic setting; e One-axis discriminant function (DF(A‒P)MT)diagram based on 10 major elements and 6 trace elements(after Verma and Armstrong-Altrin,2016)shows the true passive margin setting for the Cuddalore Basin. The thick green line indicates the boundary between active and passive margin, the dotted blue line indicates the centroid position of passive margin field, and the dotted red line indicates the centroid position of active margin field.
Chemical weathering is chiefly controlled by ambient temperatures and precipitation levels(Perri,2020; Wang et al., 2020; and references therein).Rising temperature increases the rate of silicate‒weathering reaction and intensified hydrological cycle results in higher water‒rock interaction. Moreover, during vigorous hydrological cycling, the weathering products are flushed out, the chemical equilibrium is disturbed and therefore further weathering is promoted. Based on these, several authors attempted to calculate paleo-temperature and paleo-precipitation levels by studying the weathering intensity of paleosols (e.g. Sheldon and Tabor, 2009 and references therein) and the suspended river sediments (e.g. Yang et al., 2014; Perri, 2020; and references therein). On the basis of geochemical study of suspended sediments in modern large river basins, Li and Yang (2010) showed the relationship existing between land surface temperature, latitude and the obtained CIA values. Further, Yang et al.(2014) showed that CIA values vary linearly with the land surface temperature and/or the latitude at a global scale,and the land surface temperature can be calculated based on CIA values as following: T(°C) = 0.56 × CIA−25.7. This relationship is further verified by a recent study by Perri (2020). Sedimentary basin is the ultimate sink for suspended river particulates/weathered materials and therefore the composition of siliciclastic sediments should preserve the paleo-environmental information, especially on semi-indurated Neogene sediments. Accordingly,paleo-land surface temperatures range between 28.6°C and 29.7°C can be estimated during the deposition of Cuddalore sediments in the Miocene period. As already discussed, the temperatures estimated from CS samples may suffer the postdepositional alteration, so this study argues that the temperaturesestimatedfromCMsamples(29.3-29.5°C) reflect true ambient surface temperature. Similarly, Sheldon et al. (2002) proposed the relationship between the mean annual precipitation(MAP) and CIA values: MAP = 221 × e0.0197(CIA−K). Subsequently, Perri (2020) modified the equation with new CIA data from tropical and low latitude granitoid weathering profiles as: MAP = 169 × e0.0271CIA.Considering that particularly the CM represent the true weathering of charnockite, the modified equation of Perri (2020) yields high MAP values between 2339 mm/yr and 2467 mm/yr. Presently, the Cuddalore Basin is situated between 10°N and 12°N and the average annual temperature is about 27°C.Since the Indian Plate moved towards north at a rate of 2-4 cm/yr during Tertiary period (e.g. Copley et al.,2010), it is implied that the Cuddalore depositional basin was located near to the equator during the Miocene, and the estimated paleo-temperature(~29°C) and high MAP (2339-2467 mm/yr) agree well with such paleogeographic position. It is pertinent to note that on the basis of carbon and oxygen isotope composition of soil carbonate nodules from Siwalik Group, Sanyal et al. (2004, 2010) suggested intensification of Indian Summer Monsoon (ISM) at 11 Ma and 6 Ma. Brozovic and Burbank (2000) also suggested a significant topographic rise of the MBT during 11.5-10 Ma on the basis of detailed sedimentology and magnetic stratigraphy of Siwalik sediments, which also indicate early intensification of ISM. Therefore, the high MAP (2339-2467 mm/yr) in South India estimated here during the Miocene is consistent with these studies. Such high weathering,high rainfall, and warm surface temperatures are recorded in present-day Malaysia and Puerto Rico(e.g. Perri, 2020). Based on the palynofloral assemblage of Cuddalore sediments, Mandaokar and Mukherjee (2014) suggested a humid, tropical climate with plenty of rainfall during deposition. In summary,we suggest that the deposition of Cuddalore sediments took place in near-equatorial locations under warm climate and abundant monsoonal precipitation.
5.4. Tectonic setting
The Cauvery Basin opened as a rift basin in the eastern passive margin of India during Late Jurassic-Early Cretaceous (~160 Ma ago) because of the fragmentation of Eastern Gondwana (e.g. Powell et al., 1988; Chand et al., 2001; Nagendra and Reddy, 2017; and references therein) and the progressive rifting followed till the end of Turonian(Watkinson et al., 2007). Post-rift thermal subsidence continued until Maastrichtian resulting in the accumulation of thick sequences of carbonate and clastic rocks. The basin was tilted towards east-southeast because of widespread emplacement of Deccan basaltsduringlateMaastrichtian-Paleocene(67.4-65.3 Ma) caused by reunion mantle plume.This tectonic episode caused fall in sea level and migration of basin depocenters towards east. Coastal progradation and deltaic sedimentation continued during the Eocene-Miocene period in the eastern passive margin of Cauvery Basin. The Cuddalore Basin represented the land-ward part of this passive margin and recorded the alluvial sedimentation during the Miocene. Therefore, from this discussion, it is apparent that the sedimentation in Cuddalore Basin took place in a passive-margin tectonic setting.
The geochemical composition of terrigenous sedimentary rocks is used extensively to distinguish the tectonic setting of ancient sedimentary basins (e.g.Absar et al., 2016; Verma et al., 2016; Wani and Mondal, 2016). Both major- (e.g. Bhatia, 1983;Roser and Korsch, 1986) and trace-element (e.g.Bhatia and Crook, 1986) based tectonic setting discrimination diagrams are proposed in the literature. However, some authors (e.g. Armstrong-Altrin and Verma, 2005; Ryan and Williams, 2007; Saha et al., 2010) found that the success rate of these bivariate and ternary diagrams for correcting tectonic discrimination is rather low and unacceptable.Building on this, Verma and Armstrong-Altrin (2013)carried out detailed multivariate statistical analysis on vast geochemical database of Neogene-Quaternary siliciclastic sediments from known tectonic settings, and proposed discriminant diagrams with a much higher success rate. Based on the linear discriminant analysis of the logtransformed ratios of ten major elements with SiO2as the common denominator, three tectonic settings(rift, arc, and collisional setting) for sedimentary basins were proposed (Verma and Armstrong-Altrin,2013). Verma and Armstrong-Altrin (2016) further proposed an improved discrimination for active and passive margin based on multinormal technique for discordancy analyses of ten major oxides and six trace elements. However, Basu et al. (2016) suggested that inferring tectonic setting from the composition of siliciclastics is equivocal, based on a controlled study of granite-regolith-sandstone in a cratonic block. It is well established that the deposition of Cuddalore sediments took place in an alluvial basin attached to the east coast passive margin of South India. Here we use the composition of CS and CM to investigate the efficacy of various tectonic-setting discrimination diagrams and to correctly predict the tectonic setting of their depositional basin.
Cuddalore sediments show high K2O/Na2O ratios and majority of the samples fall in passive-margin field in the SiO2versus K2O/Na2O tectonic discriminant diagram of Roser and Korsch(1986)(Fig.12a).Similarly,Cuddalore sediments in the multi-parametric major-elementbased discriminant function diagram of Bhatia (1983)also suggest a passive-margin tectonic setting(Fig. 12b). Both of these simple major-element-based tectonic discrimination diagrams correctly identify the tectonic setting. Bhatia (1983) showed that the concentration of Ti and Fe+Mg is a strong discriminant for the depositional tectonic setting and can distinguish oceanic island arc (OIA), continental arc (CA), active continental margin(ACM)and passive margin(PM)tectonic setting. In this (Fe + Mg)-Ti diagram (Fig. 6e),Cuddalore sediments show markedly different compositional array from the magmatic array because of residual enrichment during weathering, precluding the correct identification of tectonic setting. The traceelement-based La-Th‒Sc discriminant diagram of Bhatia and Crook(1986)also wrongly identifies tectonic setting and shows a continental arc setting for Cuddalore sediments (Fig. 8e). Statistically robust multidimensional tectonic discriminant diagram of Verma and Armstrong-Altrin(2013)yields only 50%success rate, and only a half of the samples can correctly identify the rift tectonic setting(Fig.12c).The majorelement-based discrimination diagram of Verma and Armstrong-Altrin(2016)shows an active margin setting(Fig. 12d). The combined major- and trace-elementbased discrimination diagram of Verma and Armstrong-Altrin (2016) correctly identifies a passive margin tectonic setting for the deposition(Fig.12e),and therefore is recommended for deducing the tectonic setting of paleo-depositional basins.
6.Conclusions
1) The textural attributes such as very poor sorting,the high angularity of framework grains, and presence of kaolinised feldspars of the Miocene Cuddalore sandstones, in conjunction with the paleocurrent data, indicate a rapid uplift of basement and the sediment derivation from nearby Madras Block of Southern Granulite Terrain (SGT).
2) Ratios of various immobile major and trace elements such as Al/Ti,Th/Sc,La/Sc,La/Co,Co/Th indicate that the composition of source rocks was dominated by felsic rocks, similar to the Archean TTG and charnockite. The geochemical results clearly show that the composition of sediments in the exposed catchment area of Cuddalore fluvial basin during Miocene was similar or somewhat more felsic compared to the present-day upper continental crust(UCC).The source rock composition as inferred from trace element ratios of the Miocene siliciclastic sediments is inconsistent with the assignment of middle or lower continental crustal nature of Southern Granulite Terrain, which is commonly interpreted on the basis of metamorphic grades.
3) Rare earth element modeling suggests a dominant charnockite source for the sediments with 80%contribution from felsic charnockites and 20%contribution from mafic granulites of the Madras Block of SGT.
4) Pure kaolinite nature of the clay minerals,extreme depletion of the mobile elements (Ca, Na, K, Mg,Ba, Sr and Rb), very high CIA values (98-99.3 with an average of 98.5), and high αMg, αCa, αNa, αK, αSrand αBavalues of the Cuddalore sediments all suggest the extreme chemical weathering of the source terrain and/or within the sedimentary basin under warm and humid conditions.
5) Based on the composition of weathering products,high annual average surface temperature(29.3-29.5°C)and high mean annual precipitation(2339-2467 mm/yr) are computed for the catchment area during the Miocene.These results agree with the paleogeographic position of the Cuddalore Basin and suggest that its sedimentation took place in a near-equatorial location under warm climate and abundant monsoonal precipitation.
Abbreviations
AAndesite.
ACMActive continental margin.
A-CN-K Al2O3-(CaO*+Na2O)-K2O.
ACSZ Achankovil Shear Zone.
BBasalt.
CAContinental arc.
CIAChemical index of alteration.
CMCuddalore mudstones.
CSCuddalore sandstones.
CSZCauvery Shear Zone.
DACDacite.
EDCEastern Dharwar Craton.
FAFacies Assemblage.
GGranite.
HABHigh alkali basalt.
HFSE High field strength elements.
HREE Heavy rare earth elements.
ICVIndex of compositional variability.
ISMIndian Summer Monsoon.
LCCLower continental crust.
LILELarge ion lithophile elements.
LREE Light rare earth elements.
LSALow silica andesite.
MAPMean annual precipitation.
MBTMain Boundary Thrust.
MCCMiddle continental crust.
MCTMain Central Thrust.
OIAOceanic island arc.
PCSZ Palghat-Cauvery Shear Zone.
PMPassive margin.
REERare earth elements.
RHYRhyolite.
SGTSouthern Granulite Terrain.
TTGTonalite-trondhjemite-granodiorite gneiss.
UCCUpper continental crust.
Funding
This study was carried out with internal resources from the Pondicherry University, and did not receive specific funding from any funding body.
Availability of data and materials
All the data discussed in this paper is included in the three tables.
Authors' contributions
N. Absar conceived the problem, designed the methodology, prepared the final manuscript and approved the final paper.
Competing interests
The author declares that he has no competing interests or personal relationships that could have appeared to influence the work reported in this paper.
Acknowledgements
The author thanks Mr.S.Arunlal and Miss S.Neethu for their assistance in field work and sample preparation. The author also thanks the authorities of the Pondicherry University for extending analytical facilities at XRF Laboratory, Central Instrumentation Facility and XRD Laboratory in the Department of Earth Sciences, Pondicherry University. I sincerely thank Dr.M. Rammohan and Dr. M. Satyanarayanan of the National Geophysical Research Institute, Hyderabad for facilitating trace element analyses at ICP-MS Laboratory. I sincerely thank the editor and three anonymous reviewers for their very useful comments and suggestions that helped in improving the manuscript.
 Journal of Palaeogeography2021年4期
- Journal of Palaeogeography的其它文章
- Sedimentary environment and model for lacustrine organic matter enrichment:lacustrine shale of the Early Jurassic Da'anzhai Formation, central Sichuan Basin, China
- Devonian reef development and strata-bound ore deposits in South China
- Hyperpycnal littoral deltas: A case of study from the Lower Cretaceous Agrio Formation in the Neuqu′en Basin, Argentina
- Sedimentological and microfossil records of modern typhoons in a coastal sandy lagoon off southern China coast
- Evidence for fault activity during accumulation of the Furongian Chaomidian Formation(Shandong Province, China)
- Ichnofabric analysis of bathyal chalks: the Miocene Inglis Formation of the Andaman and Nicobar Islands, India