
Impact of brine on physical properties of saline soils
2021-12-29 03:15:16YuZhangJieLiuAnHuaXuJianKunLiuZhaoHuiYangJianHongFang
Yu Zhang ,Jie Liu ,AnHua Xu ,JianKun Liu ,ZhaoHui Yang ,JianHong Fang
1.School of Traffic and Transportation,Lanzhou Jiaotong University,Lanzhou,Gansu 730070,China
2.Qinghai Communications Technical College,Xining,Qinghai810003,China
3.School of Civil Engineering,Sun Yat-sen University,Zhuhai,Guangdong 519082,China
4.College of Engineering,University of Alaska Anchorage,Anchorage 99508,USA
5.Qinghai Research Institute of Transportation,Xining,Qinghai810001,China
ABSTRACT Engineering activities in the salt lake region continue to increase where fresh water resources are scarce.This paper inves‐tigates the physical properties of saline soils during mixing with brine.Fine-grained saline soils with salt content varying from 2.6%to 78.5%were collected along Qarhan-Golmud Highway(QGH)and Sebei-Qarhan Highway(SQH)on the Qinghai-Tibet Plateau to conduct laboratory physical properties tests.Liquid plastic limit tests were conducted.Results show that liquid plastic limit parameters will decrease with an increase of salt content ranging from 2.6%to 78.5%,and the relationship between them is linear.After considering the content ratio of chloride and sulfate,results show that liquid plastic limit parameters will decrease with an increase of the ratio of chloride to sulfate ranging from 0.7%to 7.0%;liquid plastic limit parameters enter a stable period at the ratio of chloride to sulfate ranging from 7.0%to 37.4%;liquid plastic limit parameters enter a decline period at the ratio of chloride to sulfate ranging from 37.4%to 77.2%.After brine and fresh water are separately mixed into saline soil,the optimal moisture content of the soil samples after the brine action is lower than the saline soil under the action of fresh water,and the maximum dry density of the soil sample is higher than that under the action of fresh water.At the same time,these changing laws show a certain correlation with the chloride ion content and the ratio of chloride to sulfate in saline soils.The results are of significance for engineering activities in salt lake regions with extensive saline soil distribution.
Keywords:saline soil;brine;physical properties;the ratio of chloride to sulfate
1 Introduction
The compaction degree of saline soil is the main influencing factor for the subsidence of saline soil subgrade(Bao and Zhang,2016).The compactness of saline soil refers to the compactness of soil that meets engineering requirements by a manual or mechanical method under a certain optimum(Wen et al.,2015;Zhang et al.,2015).When treated in a saline soil foun‐dation,reasonable compaction is not only a prerequi‐site for good treatment,but also effectively prevents or reduces the subsidence of the foundation(Zhao et al.,2014;Wang et al.,2015;Liu and Zhao,2016;Feng et al.,2017;Yue et al.,2017;Yang et al.,2019;Zhang et al.,2019;Deng,2020).
Xi(2016)mixed NaCl solution of different concen‐trations with soil samples to simulate the saline soil with different salt content encountered in the actual project.The mechanism of the effect of salt content on the physical and mechanical properties of saline soil was systematically analyzed from the aspect of micro‐physics and chemistry;Li et al.(2017)conducted physical parameter tests on low liquid limit clay,and discussed the main factors affecting compaction de‐gree.Combined with experimental data,the method of improving compaction degree was given;Hu et al.(2018)explored factors affecting the compaction of subgrade fillers with the water content as the main factor,as the water content increases,the strength of the soil decreases;Zhang et al.(2015)obtained the maximum dry density of fine-grained soil with differ‐ent water content through compaction test,and pro‐posed the reference standard for compaction evalua‐tion;Zhang et al.(2018)studied the effects of differ‐ent concentrations of NaCl solution on the physical properties of soil samples,and noted that as the con‐centration increased,the liquid limit of soil decreased;Yang et al.(2016)used the water content rate as a sin‐gle factor variable and noted that the boundary water content is not only affected by the salt content,but al‐so by the interaction of factors such as compaction and overlying load;Ding and Chen(2018)analyzed the basic properties and water-salt migration charac‐teristics of shallow soils in different seasons in the study area through laboratory physical and chemical tests;Li et al.(2016)and Liang et al.(2009)studied the relationship between salt content and liquid-plas‐tic limit,optimal moisture content and maximum dry density in chloride saline soil,and obtained the effect of salt content of saline soil on the physical parame‐ters of saline soil.Chen and A(2019)selected two kinds of saline soil samples with different salinity,measured their salinity,physical characteristics and mechanical parameters,and analyzed the stability of subgrade slope by using Slide software.It is of great significance to study the physical properties and compacting characteristics of salinized soil in view of subgrade deformation for high salt con‐tent salinized soil and common problems such as looseness and water permeation in engineering.Some scholars have studied physical indices and compac‐tion characteristics of low-salinity saline soil when adding fresh water.Here,the salt content range of sa‐line soil subgrade filling is narrow,while the salinity range of the saline soil is relatively large in salt lake regions,ranging from 2%to 80%,and brine is used in the compaction of subgrade filling in the salt lake ar‐ea.Based on the present situation,it is necessary to study the effect of brine on the physical properties of saline soil.
2 Engineering background
2.1 Project introduction
On May 15,2017,Qinghai Province began to build a section of the National Highway 215 Line(North)Se-Cha Highway connecting some of the im‐portant passages in Gansu,Qinghai and Sichuan.That is,from north of Golmud City to Qarhan in Qinghai Province,with geographical coordinates between 90°06′E to 99°42′E and 35°01′N to 39°20′N.The starting point of the line is at K90+000 at the Majishan Port on the G215 line.The end point is at K603+000 on the G215 line of Qarhan,Golmud City,Haixi.The to‐tal length of the route is 71.674 km.Figure 1 shows the site of salt particles observed in saline soil area of Qarhan.

Figure 1 Salt crystals
The area where the highway is located is at Dongling Lake and Dabsund Lake area.The subgrade filling pressure incorporates local salt lake brine,with analysis resultsof the brine presented in Table 1.
2.2 Climate conditions
The monthly average temperature and ground tem‐perature of the Haixi area from 2010 to 2020 are pre‐sented in Figure 2.It can be seen from Figure 2 that the monthly average temperature is highest in July,reaching 23°C and lowest in December.The average monthly temperature in June,July and August is above 15°C.The lowest temperature in December is as low as−9.2°C and the daily average temperature is below 0°C.The temperature difference between highest and lowest reaches 32.2°C,and the tempera‐ture changes in all seasons.The overall variation is consistent with the sinusoidal curve,and the tempera‐ture difference between winter and summer is large.As the depth increases,the difference between the ground and underground temperature increases.

Table 1 Brine analysis results
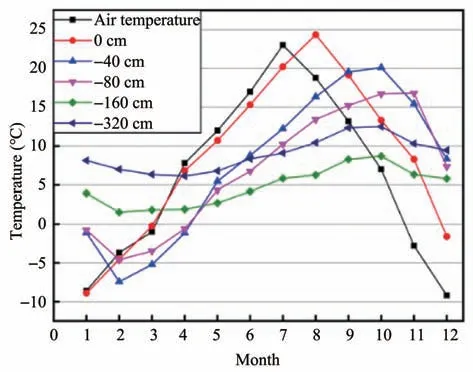
Figure 2 Monthly average temperature and ground temperature from 2010 to 2020
Figure 3 is a graph of monthly average rainfall and evaporation data for the Hercynian region from 2010 to 2020.It can be seen from Figure 3 that precip‐itation is much lower than evaporation,and rainfall does not change much.In contrast,evaporation is up to 370 mm from May to August,and as low as 75 mm from December to January.The annual average evapo‐ration is about 230 mm,and the annual average rainfall is about 7 mm.

Figure 3 Monthly average rainfall and evaporation from 2010 to 2020
3 Physical parameters of high salinity saline soils
3.1 Soil samples selection
Ten soil samples were selected along the highway to determine the salt content.The results are present‐ed in Table 2,according to the"Test Methods of Soils for Highway Engineering"(JTG 3430-2020,2020),St is defined as saline soil.

Table 2 Salt content of saline soil samples
3.2 Particle test
According to relevant provisions of the"Test Methods of Soils for Highway Engineering"(JTG 3430-2020,2020),the ten soil samples were subjected to a particle test.The experimental results are present‐ed in Figure 4.It can be found from the grain size curves that the ten soil samples are mainly divided in‐to two categories:The first type is due to the high salt content where the salt exists in the state of salt rock,so the particle passing rate is low,resulting in uneven gradation.The second type is due to the low salt con‐tent where the soil sample contains more fine grain soils,so the particle passing rate is high,and the gradation distribution is uniform.
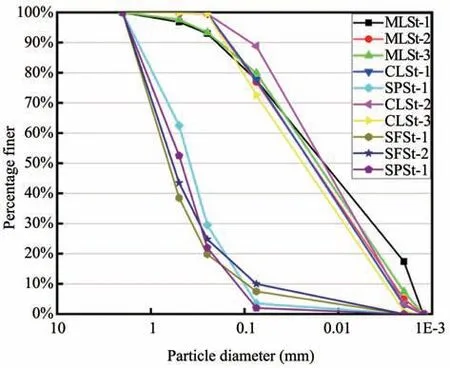
Figure 4 Soil sample test
3.3 Liquid plastic limit test
According to relevant provisions of the"Test Methods of Soils for Highway Engineering"(JTG 3430-2020,2020),the liquid plastic limit was deter‐mined for the ten soil samples.The experimental re‐sults are presented in Table 3.The change relation‐ships among the liquid limit,plastic limit,plasticity index,and the salt content are presented in Figure 5.
The variation laws of salt content vs.liquid limit(ωL),plastic limit(ωP),and plasticity index(IP)were fit to regression Equation(1):

It can be seen from Figure 5 that the liquid plastic limit parameters have a linear relationship with the salt content.As the salt content increases,the liquid plastic limit parameter decreases.
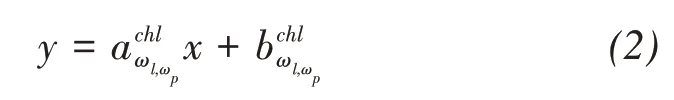
The content of chloride ions vs.liquid limit(ωL),plastic limit(ωP),and plasticity index(IP)were fit to regression Equation(2):

Figure 5 Salt content vs.liquid limit(ωL),plastic limit(ωP),and plasticity index(I P)For the convenience of defining the parameters in the formula,the superscript and subscript of the parameters are the abscissa and ordinate names respectively.
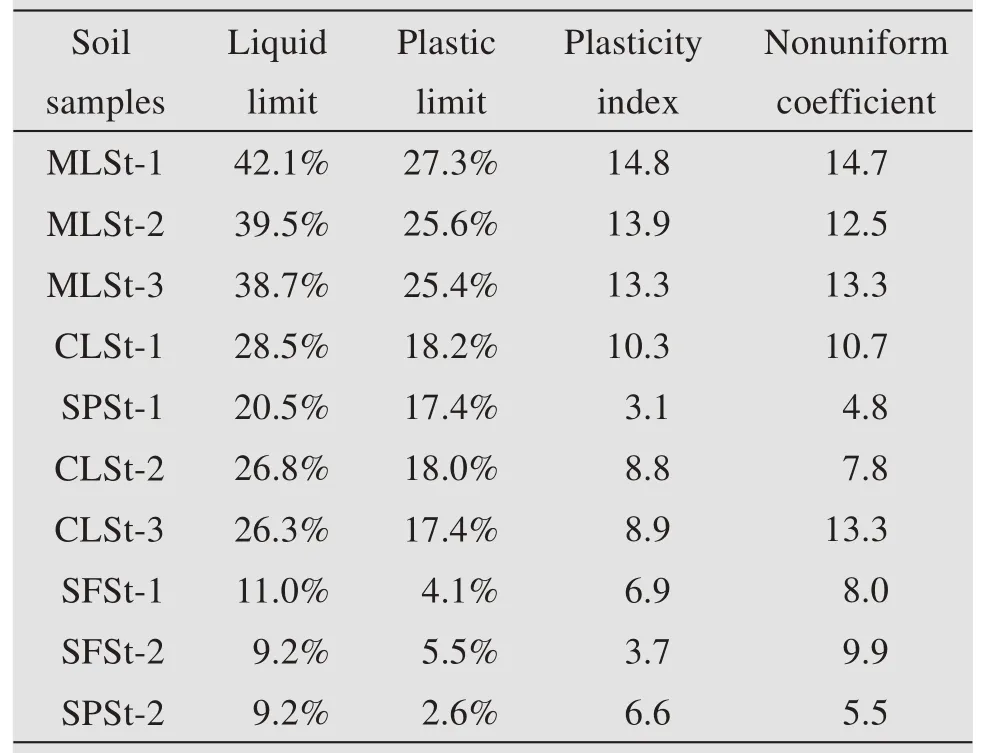
Table 3 Liquid plastic limit measurement results

Table 4 Parameters list
As can be seen from Figure 6,the liquid plastic limit and plastic index of soil decrease gradually with an increase of chloride ion content.The three parame‐ters show a linear relationship with chloride ion con‐tent,in which the liquid limit decreases the most,the plastic limit decreases the next,and the plastic index decreases the least.It can be concluded that the con‐tent of chloride ion in soil affects the limit parameters of liquid plasticity of soil.
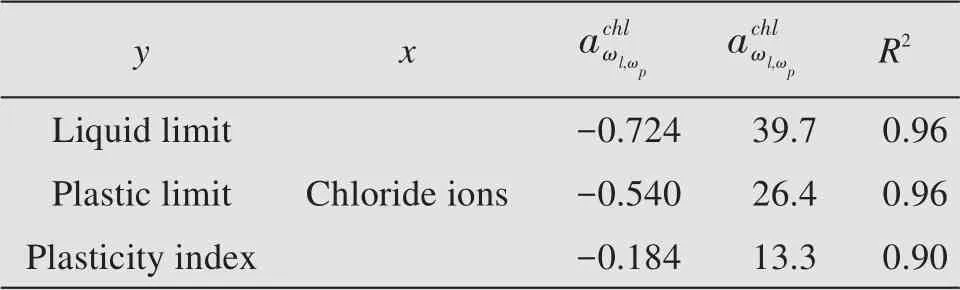
Table 5 Parameters list
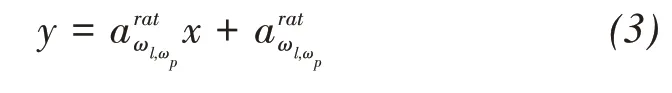
The ratio of chloride to sulfate vs.liquid limit(ωL),plastic limit(ωP),and plasticity index(IP)were also fit to regression Equation(3):
It can be seen from Figure 7 that liquid plastic lim‐it parameters will decrease with an increase of the ra‐tio of chloride to sulfate ranging from 0.74% to 7.03%;liquid plastic limit parameters enter a stable period at the ratio of chloride to sulfate ranging from 7.03%to 37.35%;liquid plastic limit parameters enter a decline period at the ratio of chloride to sulfate ranging from 37.35%to 77.15%.
The instrument used in this experiment is the LG-100D digital display soil liquid plastic limit tester.Ac‐cording to results of the particle test and the liquid plastic limit test,the ten soils types were judged by the"Test Methods of Soils for Highway Engineering"(JTG 3430-2020,2020):MLSt is low liquid limit silt;CLSt is low liquid limit clay;SPSt is poorly graded sand;SFSt is fine grained sand.

Figure 6 The content of chloride ions vs.liquid limit(ωL),plastic limit(ωP),and plasticity index(I P)
4 Compaction characteristics analysis
4.1 Brine configuration
In order to save water resources and project cost,it is very important to use brine for highway construc‐tion projects in salt lake areas where water resources are extremely scarce.According to the salt content of the salt lake brine measured above,32%NaCl solu‐tion is simulated for use in subgrade fillers.

Table 6 Parameters list
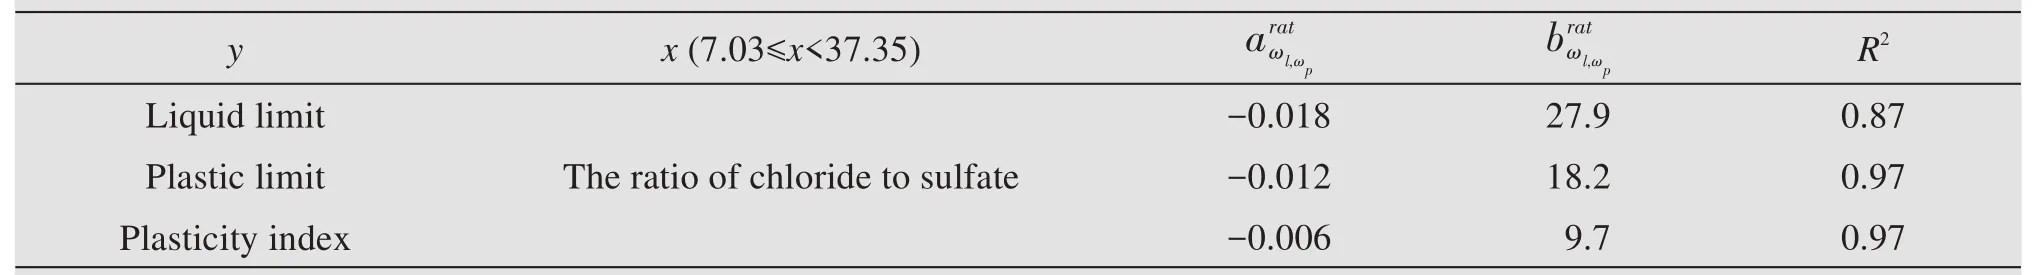
Table 7 Parameters list
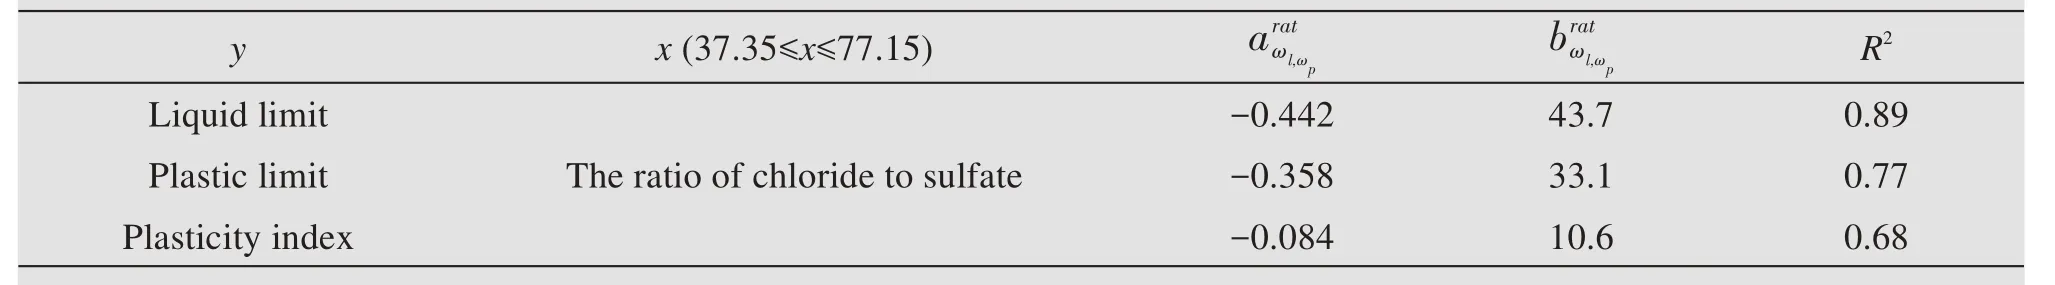
Table 8 Parameters list

Figure 7 The ratio of chloride to sulfate vs.liquid limit(ωL),plastic limit(ωP),and plasticity index(I P)
4.2 Optimal moisture content under brine and water
Samples were prepared in accordance with the relevant provisions of the Highway Geotechnical Test Regulations.Five different moisture contents were set at intervals of 2%water content,and brine was added according to the quality of the required water,fol‐lowed by heavy-duty compaction test.The optimal moisture content and maximum dry density are presented in Table 9.
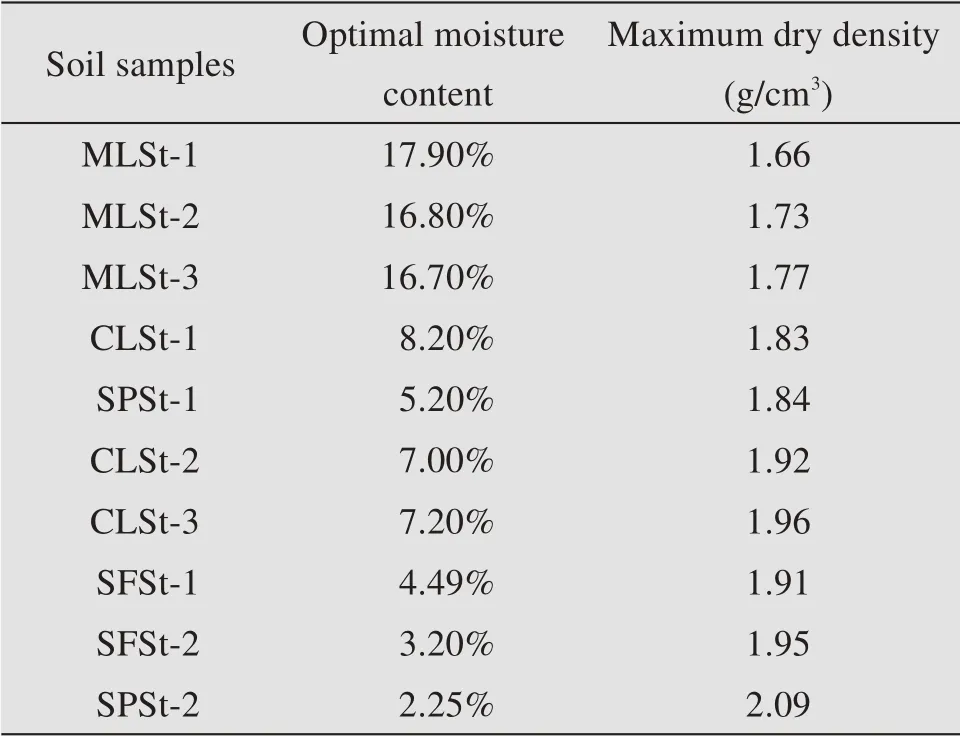
Table 9 Optimal moisture content and maximum dry density under brine
The optimal moisture content vs.the salt content of saline soil were also fit to regression Equation(4):


Table 10 Parameters list
It can be seen from Figure 8 that under the two test conditions of fresh water and brine,the optimal moisture content of the soil samples after the brine ac‐tion is lower than the saline soil under the action of fresh water.When the salt content increases,the opti‐mal moisture content decreases.Salt particles in sa‐line soils cannot be dissolved by nearly saturated brines,while most of the salt particles in saline soils are easily dissolved by added fresh water,and weak‐ening the soil skeleton.Therefore,the optimal mois‐ture content under the condition of adding brine is lower than under adding fresh water.
When the optimal moisture content is deter‐mined by brine,the content of chloride ion in soil changes with the addition of brine.Figure 9 shows the relationship curve between optimal moisture con‐tent and the content of chloride ion while Figure 10 shows the relationship curve between optimal mois‐ture content and the content ratio of chloride ion to sulfate ion.
The optimal moisture content vs.the content of chloride ionswere also fit to regression Equation(5):
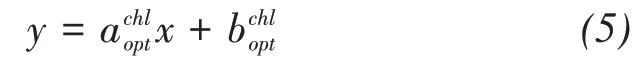
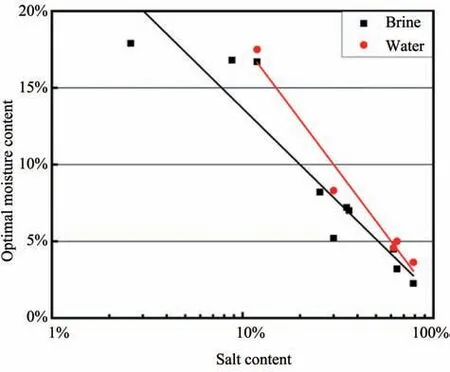
Figure 8 Relationship between salt content and optimal moisture content of soil samplesNote:The abscissa is log base 10.

Figure 9 Relationship between the content of chloride ions and optimal moisture content of soil samples
Figure 9 shows that when the chloride content is in the range of 3.22%to 18.83%,the optimal moisture content decreases sharply with an increase of chloride content.When the chloride content is in the range of 18.83%to 47.16%,the optimal moisture content de‐creases slowly with an increase of chloride content.The decrease of optimal moisture content is attributed to an increase of chloride ion concentration.
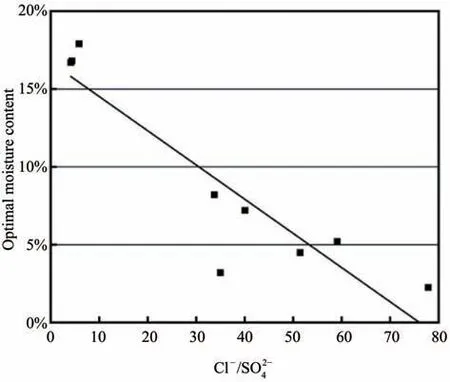
Figure 10 Relationship between the ratio of chloride to sulfate and optimal moisture content of soil samples
The optimal moisture content vs.the ratio of chlo‐ride to sulfate were fit to regression Equation(6):

As can be seen from Figure 10,the optimal mois‐ture content also has a linear relationship with the ratio of chlorine to sulfur.With an increase of chlorosulfur ratio,the optimal moisture content decreases.Under the condition of adding brine,chloride ion in the soil body increases rapidly and sulfate ion is dilut‐ed.Chloride ion has a major effect on the optimal moisture content.

Table 11 Parameters list

Table 12 Parameters list
4.3 Maximum dry density under brine and water
Samples were prepared in accordance with rele‐vant provisions of the Highway Geotechnical Test Procedures.Five different moisture contents were set at intervals of 2%moisture content,and fresh water was added according to the required water quality,fol‐lowed by heavy compaction test.The optimal mois‐ture content and maximum dry density are presented in Table 13.
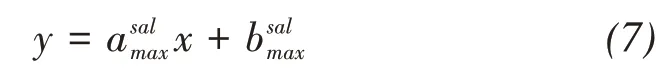
The maximum dry density vs.the salt content of saline soil were also fit to regression Equation(7):
According to Figure 11,when salt is added to the sample,and the salt content varies from 2.59%to 36.10%,the maximum dry density increases with an increase of salt content;when the salt content is in the range of 36.10%−64.41%,the maximum dry density enters the stable period;and when the salt content var‐ies from 64.41%to 78.50%,the maximum dry density continued to increase with an increase of salt content.The maximum dry density of the salt water is higher than the maximum dry density under the effect of fresh water.Although undissolved salts in the soil con‐tinue to act as skeletons after the addition of nearly saturated brine,most salts are dissolved and the skele‐ton effect weakens when fresh water is added.There‐fore,the maximum dry density under brine condition is higher than under fresh water.
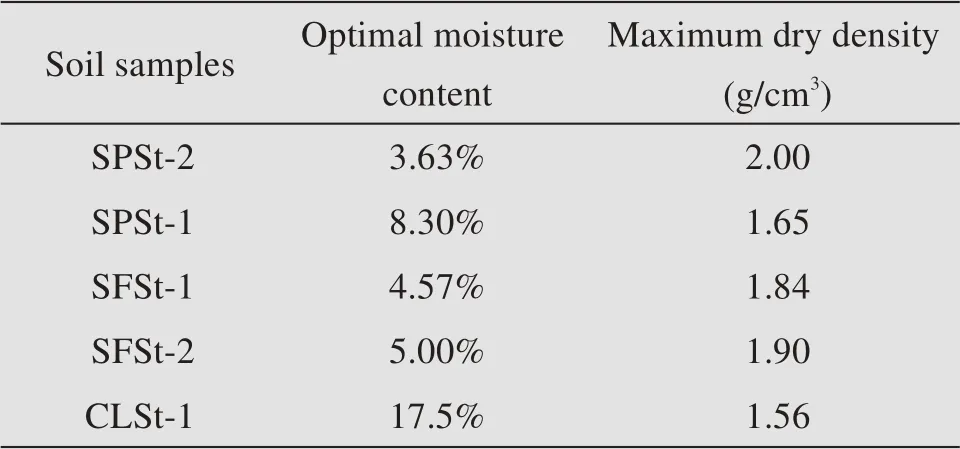
Table 13 Optimal moisture content and maximum dry density under freshwater
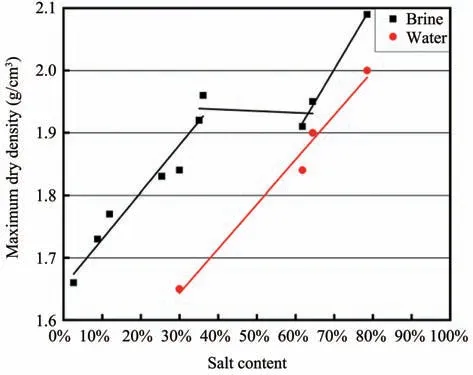
Figure 11 Relationship between salt content and maximum dry density of saline soil
Figure 12 shows the relationship curve between the maximum dry density and the content of chloride ion.Figure 13 shows the relationship curve between the maximum dry density and the content ratio of chloride ion to sulfate ion.
The maximum dry density vs.the content of chlo‐ride ions were also fit to regression Equation(8):

Figure 12 shows that with an increase of chloride ion content,the change of maximum dry density is al‐so divided into three stages,when the chloride ion content change from 3.22%to 18.83%,the maximum dry density increases with the chloride ion content;chloride ion content ranges from 18.83%to 39.16%,the maximum dry density is stable;the chloride ion content range from 39.16%to 47.16%,the maximum dry density continues to increase.
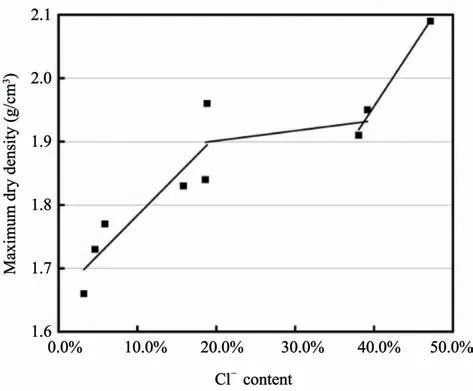
Figure 12 Relationship between the content of chloride ions and maximum dry density of saline soil
The maximum dry density vs.the ratio of chloride to sulfate were also fit to regression Equation(9):

The variation rule of the maximum dry density in Figure 13 is consistent with that in Figure 12.The rea‐son is that soil samples contain a large number of chloride ions,which play a major role in influencing the maximum dry density of the soil sample.
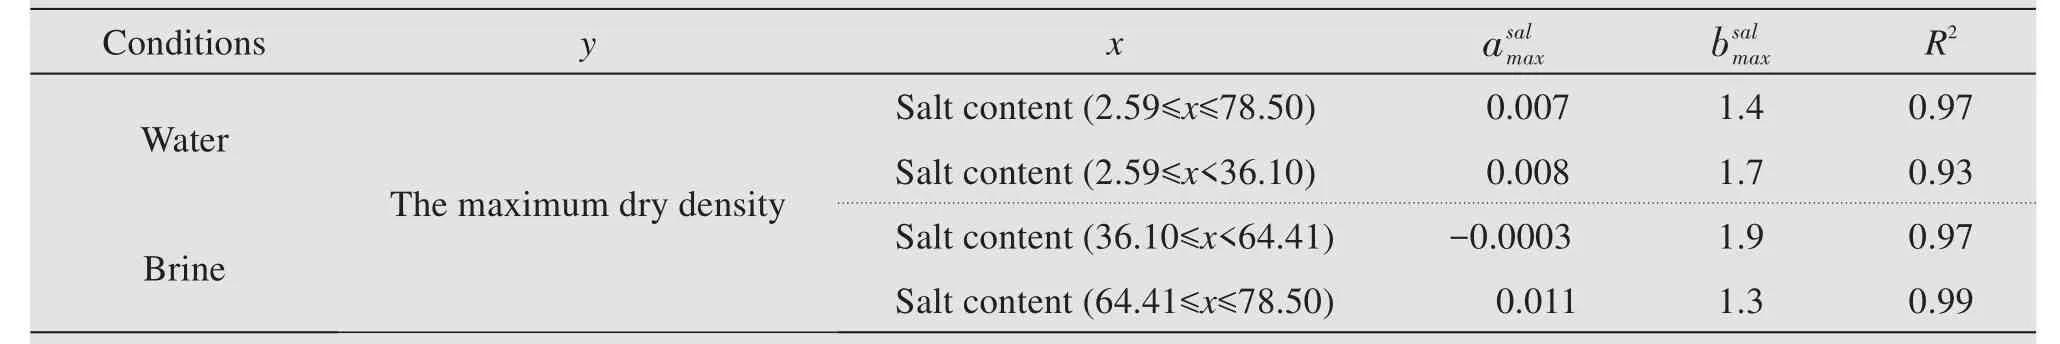
Table 14 Parameters list
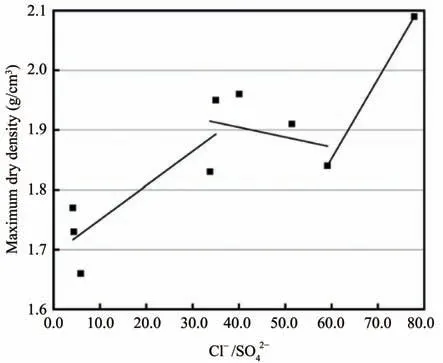
Figure 13 Relationship between the ratio of chloride to sulfate and maximum dry density of saline soil
4.4 Compaction model of saline soils
According to the aforementioned experimen‐tal data,the relationship between salinity of the saline soil,the brine concentration and the maxi‐mum dry density of the saline soil can be ob‐tained.This relationship is in accordance with Equation(10):

5 Conclusions
Through particle analysis,liquid-plastic limit de‐termination and compaction test of the ten soil sam‐ples taken,basic physical parameters were obtained,and the following conclusions were drawn:
(1)With an increase of salt content,the liquid plastic limit and plasticity index of soil decrease slow‐ly,the optimal moisture content of soil decreases,and the maximum dry density increases.
(2)Compared with brine,the optimal moisture content of the sample under fresh water has different degrees of increase,while the maximum dry density is lower than that of the sample prepared with brine.With an increase of chloride ion content,the optimal moisture content decreased and the maximum dry density increased.
(3)The fitting equations of salinity,brine concen‐tration and maximum dry density of saline soil were obtained,revealing the relationship between the three.
(4)The liquid plastic limit parameters have a lin‐ear relationship with the salt content and the content of chloride ions.As the ratio of chlorine to sulfate in‐creases,three stages are defined,which are descend‐ing,stable,and descending.The optimal moisture con‐tent has a linear relationship with salt content and the ratio of chlorine to sulfate.With an increase of the content of chloride ions and the ratio of chlorine to sulfate,the maximum dry density can be divided into three stages,rising,stable,and rising.
Acknowledgments:
This research was jointly supported by grants from the National Natural Science Foundation of China(No.41501062),the Longyuan Youth Innovation and Entrepreneurship Talent(Team)Project of Gansu Province and Natural Science Foundation of Gansu Province(No.20JR10RA227).
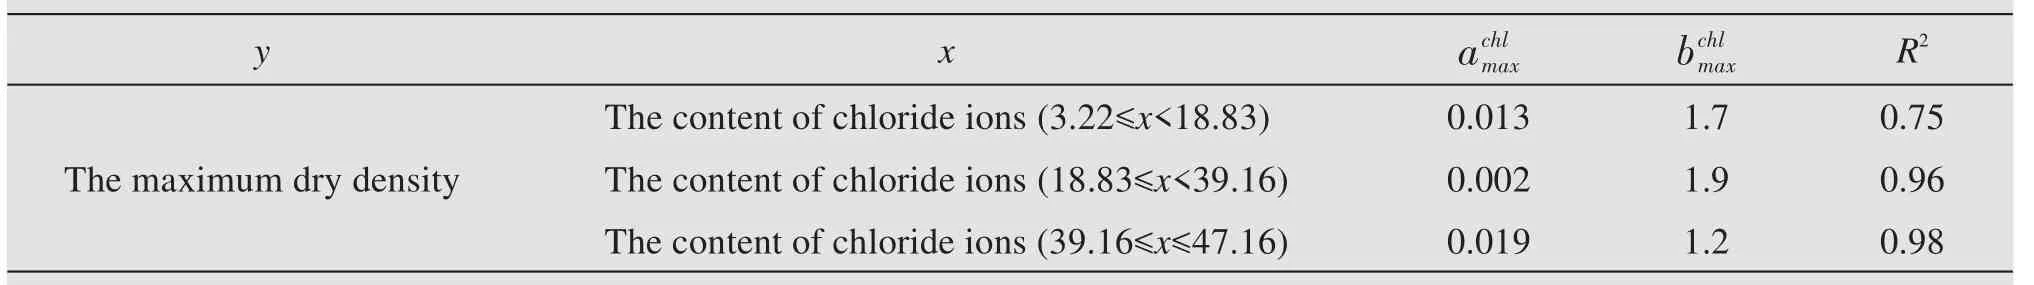
Table 15 Parameters list
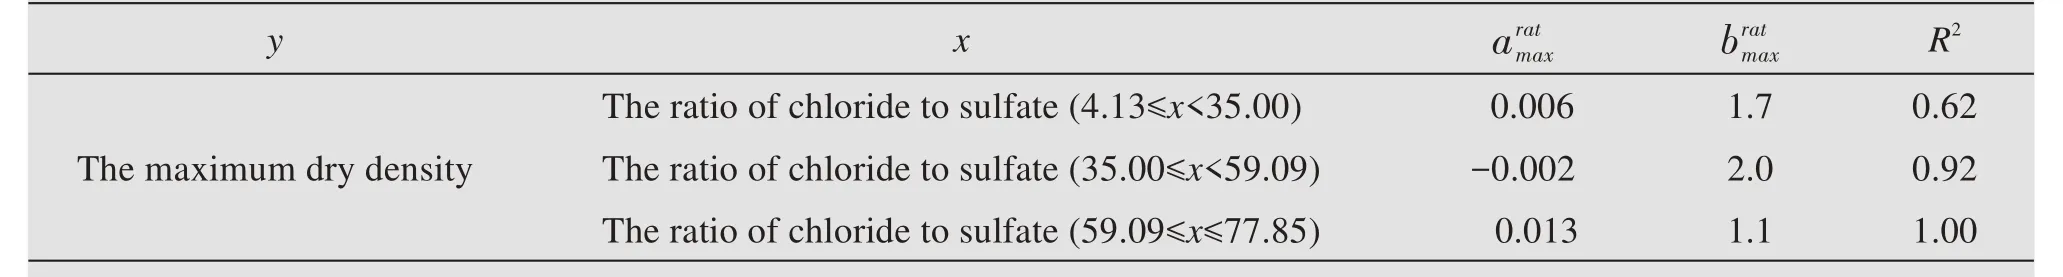
Table 16 Parameters list

Table 17 Parameters list
 Sciences in Cold and Arid Regions2021年5期
- Sciences in Cold and Arid Regions的其它文章
- Study on mechanical properties of soil-rock mixture of various compactness subjected to freeze-thaw cycles
- Strength characteristics and energy dissipation evolution of thawing silty clay during cyclic triaxial loading
- Study on thermal-state variation of high-grade highway embankment under different pavement conditions
- Field monitoring of differential frost heave in widened highway subgrade
- Numerical simulation of electroosmosis in unsaturated compacted clay
- Study on tensile damage characteristicsof sandstone under freeze-thaw cycles