
Field monitoring of differential frost heave in widened highway subgrade
2021-12-29 03:15:06XuFengLuFengZhangKangWeiTangDeChengFeng
XuFeng Lu,Feng Zhang,KangWei Tang,DeCheng Feng
School of Transportation Science and Engineering,Harbin Institute of Technology,Heilongjiang 150090,Harbin,China
ABSTRACT In cold regions,the widened subgrade could produce uneven frost heave that is detrimental to the pavement.This study in‐vestigates the differential frost heave characteristics in a widened subgrade.The field monitoring system mainly consists of temperature,moisture,and displacement sensors and distributed optical fiber cables for strain measurement.The moni‐toring results show that the cooling period in the subgrade is longer than the warming period.Water content in the sub‐grade changes significantly within 0−2 m below the subgrade surface but stabilizes within 2−5 m.The maximum frost heave occurs from February to March.In comparison,the existing subgrade has a longer freezing period and larger heave value,caused by the higher density and water content inside.Water in the existing subgrade migrates into the new one af‐ter widening,leading to frost heave reduction in the existing subgrade.Simultaneously,the traffic loads result in the con‐solidation of the new subgrade,thus reducing the heave value in the second year.In the third year,the water supply from the existing subgrade facilitates the frost heave in the new subgrade.The tensile strain distributions obtained by the distrib‐uted optical fiber cables show that the maximum differential frost heave occurs at the joint between the existing and new subgrades.The differential frost heave gradually stabilizes after three years.Finally,an improved frost heave prediction model is developed based on the segregation potential concept and monitoring results.
Keywords:widened subgrade;differential frost heave;field monitoring;distributed optical fiber strain sensing;seasonally frozen region
1 Introduction
Many highways need to be widened to meet the demand of rapidly increasing traffic volume in Chi‐na.With 75.8%of the land area located in cold re‐gions,a majority of the highways also experience problems related to freeze-thaw,such as frost heave in the subgrade(Zhang et al.,2001).During the cold season,water in the subgrade gradually freezes,ac‐companied by a phase transition and moisture migra‐tion.In particular,the water supply from the unfro‐zen zone accelerates the frost heave in the subgrade(Taber,1930;Zhang et al.,2018).Therefore,sub‐grades with a high water content or sufficient water supply will likely suffer from large deformation due to frost heave,which causes pavement cracks,waves,and other diseases.
Soil frost heave is a complex multi-physical field coupling process(Harlan,1973).Wang et al.(2011)established a one-dimensional coupled hydro-thermal model for seasonally frozen soils based on porous me‐dium heat balance principle and viscous fluid flow theory.In frost heave sensitivity evaluations,Sheng et al.(2013)considered the effects of load,temperature,and soil properties.Zhao et al.(2014)confirmed that water migration in the freezing process significantly influenced soil's thermal properties and temperature field.Notably,Zheng and Kanie(2015)introduced an anisotropic coefficient into a hydro-thermal-stress coupling frost heave model and expanded Takashi's equation for two-dimensional frost heave evaluation.Ming and Li(2015)found that as the temperature gradient increased,the amount of frost heave in the saturated soil increased first,then decreased.Zhang et al.(2015)revealed that the freezing process in soil could produce a negative pore water pressure,signifi‐cantly influencing water migration and ice segrega‐tion.Sun et al.(2016)suggested that moisture and temperature have more significant influences on the heave characteristic of saline soils than salt content and compaction degree.Geng et al.(2017)investi‐gated the effects of overburden stress and cold-end temperature on soil frost heave.Zhang et al.(2017)proposed to use the temperature gradient and freez‐ing front advancing rate as macroscopic indexes for evaluating soil frost heave.Ji et al.(2019)concluded that a temperature gradient is necessary for water mi‐gration and soil frost heave,while vertical restraint could inhibit the water accumulation at the freezing front.
Frost heave in the subgrade is uneven under complex multi-field coupling effects.Liu et al.(2017)investigated the frost heave characteristics of an airport pavement and found that the shoulder had more significant frost heave than the base course.Wu et al.(2018)monitored the frost heave in the subgrade of the Lanzhou-Xinjiang highspeed railway and found that the maximum frost heave occurred at depths of 0.5−1.5 m.The monitor‐ing results along the Harbin-Dalian high-speed rail‐way(Niu et al.,2020)revealed that the maximum frost heave occurred at depths of 0.0−0.5 m with water accumulation at 0.6−1.2 m deep,consistent with the results reported by Miao et al.(2020).Ad‐ditionally,Luo et al.(2019)proposed that the severe horizontal and vertical deformations in the subgrade shoulder could induce longitudinal cracks in the pavement.
This study aims to investigate the differential frost heave characteristics in the widened subgrade.Previ‐ously,researchers mainly focused on the multi-field coupling frost heave characteristics and mechanisms in the existing subgrade.Several studies were based on the field data(Rajaei and Baladi,2015;Orakoglu et al.,2016;Fattoev et al.,2021),which could effec‐tively reflect actual working conditions(Groenevelt and Grant,2013).However,different geometrical and physical properties in the existing and newly widened subgrades could lead to more complex differential frost heave characteristics.This study established a field monitoring system in the widened subgrade of the Changchun-Jilin highway widening project.The temperature,moisture,and deformation variations in the widened subgrade were monitored and analyzed.The results are of value for the design and operation of the Changchun-Jilin highway widening project and other subgrade widening projects in seasonally frozen regions.
2 Site conditions and monitoring methods
2.1 Site selection and arrangement of monitoring elements
The Changchun-Jilin highway was completed and opened to traffic in 1997.The initial construc‐tion has an overall subgrade width of 34.5 m,with space for two more lanes reserved at the median strip.Some sections along the Changchun−Jilin highway have shallow groundwater tables and are prone to frost heave.A low filling section with a shallow groundwater table was selected to estab‐lish a field monitoring system,as depicted in Figure 1.Temperature and moisture sensors were installed in the subgrade to record temper ature and humidity changes,as shown in Figure 2.
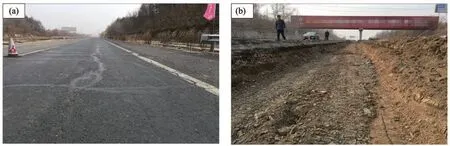
Figure 1 View of the distressed pavement and excavation of the monitoring section
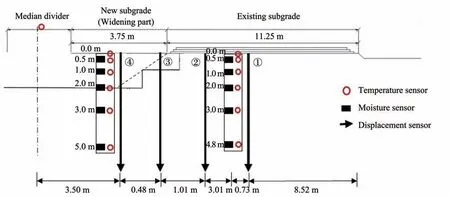
Figure 2 Arrangement of temperature,moisture,and displacement sensors
Besides,displacement sensors①through④and distributed optical fiber cables for strain monitoring were installed in the subgrade to monitor differential deformation due to frost heave,as illustrated in Figure 3.Note that the depths in Figure 2 and descriptions hereafter are measured from the subgrade surface.
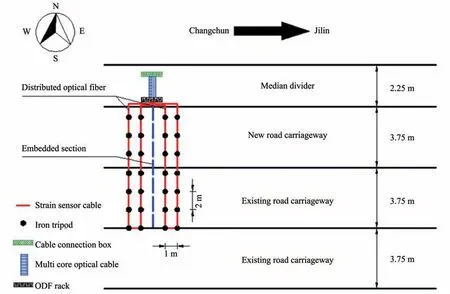
Figure 3 Arrangement of distributed optical fiber cables
2.2 Selection of monitoring sensors
The monitoring system consisted of various types of sensors.Specifically,the 36-B temperature sensors(Changsha Jinma Measurement and Control Technolo‐gy Co.,LTD.,China),the TDR-3 soil moisture sen‐sors(Jinzhou Sunshine Meteorological Science and Technology Co.,LTD,China),and the JMDL-4720A displacement sensors(Changsha Jinma Measurement and Control Technology Co.,LTD.,China)were se‐lected to monitor the ground temperature,moisture,and vertical displacement of the subgrade,respective‐ly.Table 1 summarizes the technical parameters of the sensors adopted in the monitoring system.
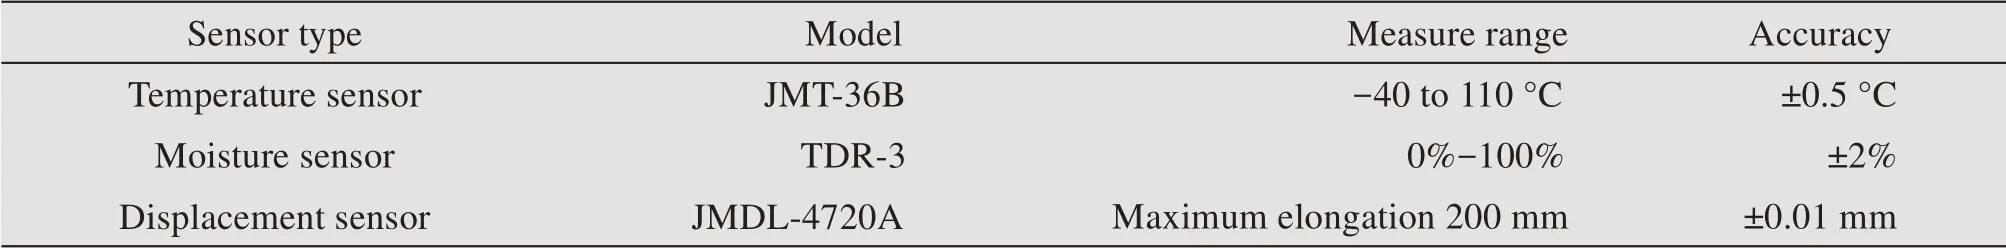
Table 1 Technical parameters of the sensors in the monitoring system
Based on the Brillouin Optical Time-domain Anal‐ysis(BOTDA),the optical fiber strain sensing system could achieve continuously distributed,high-resolu‐tion,and high-precision strain monitoring across a long-distance(Dong,2021).In the BOTDA,the pump pulse light and probe light are injected into the two ends of a sensing fiber cable.When the frequency difference between the two waves was a Brillouin fre‐quency shift,the stimulated Brillouin scattering would occur.According to the linear relationship be‐tween strain and Brillouin frequency shift,the strain distribution along the sensing fiber cable can be ob‐tained by measuring the Brillouin frequency shift.Fig‐ure 4 shows the working principle of the BOTDA.
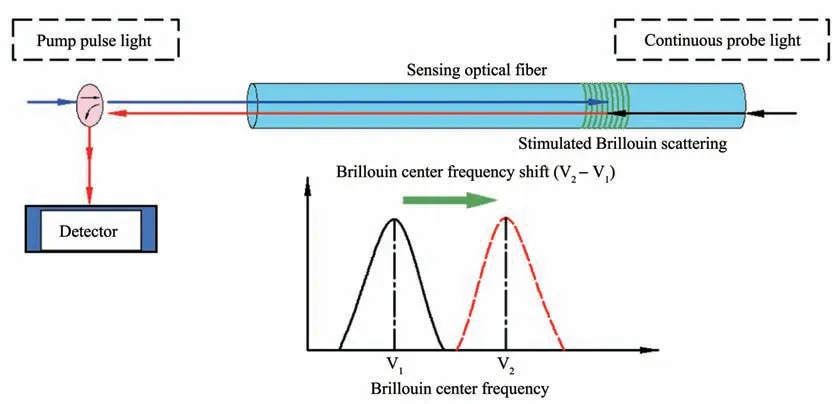
Figure 4 Working principle of BOTDA
In this study,the armored RP-S-05-MR optical fi‐ber cables were adopted in the monitoring system.The fiber cable contains multiple high-strength steel strands to improve its tensile and compressive strengths and survivability during installation.And the RP-1000 demodulator with a high spatial resolu‐tion was used to collect the Brillouin time-domain signals.
3 Monitoring results
3.1 Temperature
Figure 5 shows the air temperature change at the monitored section.The subzero air temperature oc‐curred in early December and lasted until late March,corresponding to a freezing period of approximately four months.The highest temperature occurred from July to August and the lowest temperature from Janu‐ary to February.A sine function was used to fit and describe the periodic changes in air temperature,with its parameters shown in Figure 5.
Figure 6 depicts the temperature variationsat differ‐ent depths in the existing subgrade.As the monitoring depth increases,the temperature fluctuates periodically with a decreasing magnitude.The temperature ampli‐tude drops from 25°Cat 0.5 m deep to 4.4°C at 4.8 m deep.Meanwhile,the peak temperature occurs with an increasing delay as the depth increases,reflecting the longer time required for the energy to transfer from the air to the subgrade.There is a significant dif‐ference between the cooling and warming periods in the subgrade,with the cooling period slower and,therefore,longer than the warming period.At a depth of 0.5 m,the cooling period lasts about seven months,and the warming period five months.Through the 0°C reference line,the frozen depth in the existing subgrade is found to be around 0.5 m.
Figure 7 compares temperature variations be‐tween the new and existing subgrades at different depths.At the surface,the existing subgrade has slower warming than the new one.
The prince prostrated105 himself in thanks to heaven and Jamila, and said: O delicious person! O Chinese Venus! how shall I excuse myself for giving you so much trouble? With what words can I thank you? Then she called for a clothes-wallet and chose out a royal dress of honour
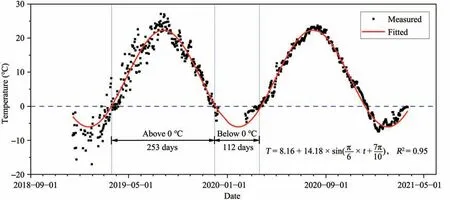
Figure 5 Air temperature change at the monitoring section
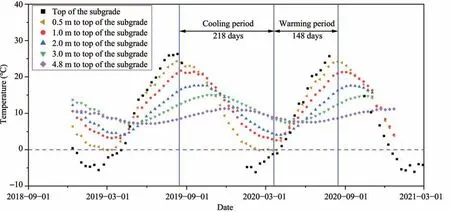
Figure 6 Temperature changes at different depths in the existing subgrade
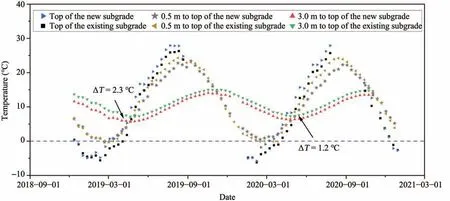
Figure 7 Comparison of temperature variations between the new and existing subgrades
At 0.5 m deep,however,the existing subgrade has slower cooling but faster warming than the new subgrade,leading to a higher positive temperature peak and lower subzero temperature valley in the ex‐isting subgrade.
According to the 0℃reference line,the frozen depth in the new subgrade is slightly shallower than in the existing one,i.e.,0.5 m.At 3 m deep,the temperature variations in the new and existing subgrades resemble sine functions,but the temperature in the existing sub‐grade is higher than that of the new one.The temperature difference at 3 m deep in the new and existing subgrades gradually diminishes with increasing freeze-thaw cycles.The difference value is about 2.3℃in the first year and progressively stabilizesat 1.2℃in thesecond year.
3.2 Moisture
The TDR-3 moisture sensor outputs different volt‐age signal values under varying soil water content.Subgrade soil samples were collected from the moni‐toring section to obtain the moisture contents in the laboratory for sensor calibration.Figure 8 shows the experiment and calibration results and the calibrated relationship between the output voltage and volumet‐ric moisture content,which can be used to convert the voltage output value directly into the volumetric water content in the subgrade soil.
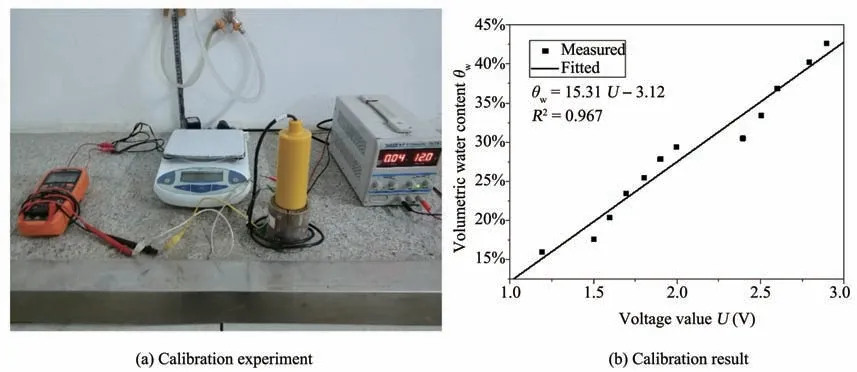
Figure 8 Calibration of TDR-3 moisture sensor
Figure 9 illustrates the variation of volumetric wa‐ter content with depth in the new and existing sub‐grades during the first freeze-thaw period.The volu‐metric water content in the subgrade within 2 m deep decreases continuously from late November to late February of the next year.The volumetric water content reaches its lowest from February to March.The subgrade temperature,as shown in Figure 4,also reaches its lowest at the same period,and the changes in the moisture and temperature fields are roughly the same.The water content in the subgrade varies drasti‐cally at 0−2 m deep and gradually diminishes with an increasing depth;the water content at 5 m deep is al‐most unaffected by the ambient environment.
Comparing the new and existing subgrade,the water content and variation range in the existing sub‐grade are larger than those in the new subgrade.The physical properties of the existing subgrade facilitate a better water supply condition,resulting in higher water contents in the existing subgrade.Further,higher water content means a larger specific heat ca‐pacity and slower cooling in the existing subgrade.Also,the higher water content led to a significant fluctuation and drastic latent heat release in the exist‐ing subgrade.
3.3 Frost heave
Figure 10 shows the vertical deformations at vari‐ous locations on the subgrade surface during different freeze-thaw periods after subgrade widening.During the first freeze-thaw period,the frost heave increases during the freezing period and decreases during the thawing period.The frost heave on the new subgrade significantly lessens in the second year,slightly in‐creases,and gradually stabilizes in the third year.The maximum frost heave values among the new subgrade monitoring points in the first three freeze-thaw cycles are 11.61 mm,6.06 mm,and 7.89 mm,respectively.In comparison,the maximum values among the exist‐ing subgrade monitoring points in the first three freeze-thaw cycles are 19.12 mm,16.37 mm,and 10.55 mm,respectively;the latter are significantly larger than those observed on the new subgrade but al‐so demonstrate a decreasing trend.Besides,the maxi‐mum frost heave on the new and existing subgrades do not coincide.The existing subgrade starts to heave earlier and experiences a more extended heave devel‐opment stage than the new subgrade.The differential frost heave between the new and existing subgrades is obvious.Taking the monitoring results at points②and③as an example,the maximum differential frost heave between them during the first three freeze-thaw cycles are 13.84 mm,14.58 mm,3.33 mm,respective‐ly.The differential frost heave rises slightly in the sec‐ond year,then shrinks significantly in the third year.
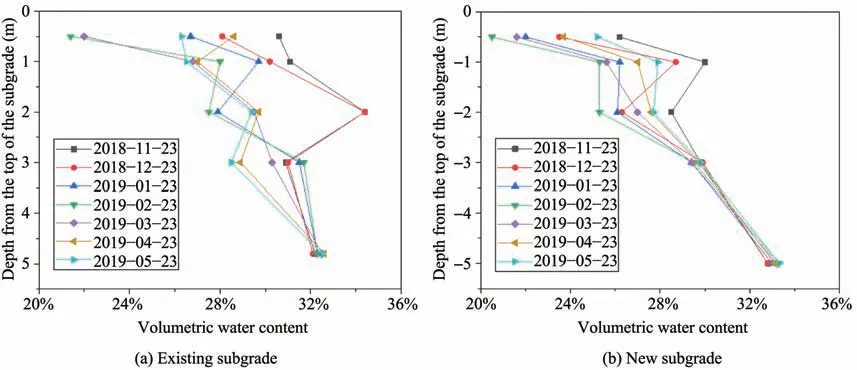
Figure 9 Variation of volumetric water content with depths in the new and existing subgrades
Figure 11 depicts the variations of tensile strain along the cross-section of the widened subgrade.There are only slight variations in the tensile strain values along the entire cross-section on October 15,2018,when the freezing season did not start.Howev‐er,one can see significant changes in the tensile strain values along the cross-section on March 15,2019,when both the seasonal frost and the differential frost heave between the new and existing subgrades reach their maxima.The maximum differential heave oc‐curs near the joint between the new and existing sub‐grades,the most likely pavement cracking location.
4 Discussions
According to the above monitoring results,the dif‐ferences in the temperature,moisture,and deforma‐tion fields between the existing and new subgrades are evident.The existing subgrade had been bearing self-weight and traffic loads for several years,and the consolidation deformation had reached a stable level.At the same time,after many freeze-thaw cy‐cles,the water content in the existing subgrade rose above the optimal water content during the initial construction(Liu et al.,2019;Teltayev et al.,2020).The freeze-thaw cycles could also increase the perme‐ability of the existing subgrade(Hirose and Ito,2017).Thus,the higher water content and permeabili‐ty lead to a more significant frost heave in the exist‐ing subgrade.Besides,the water in the existing sub‐grade could gradually migrate to the new subgrade,re‐sulting in decreased frost heave in the existing sub‐gradeduring the second and third yearsafter widening.
Figure 12 shows the development of frozen depth and frost heave during the first freezing period.The frost heave of points①and④were selected to repre‐sent the existing and new subgrades,respectively.The frost heave rises with the frozen depth during freez‐ing.The development could be divided into two stag‐es,including in situ heave and in situ-segregation heave.During the in situ heave stage,the frost heave mainly results from the phase transition of pore water in the soil,leading to slower heave development.Dur‐ing the in situ-segregation heave,both pore water and migrated water promoted the development of frost heaving.For both subgrades,while the frozen depth development trends are similar,the frost heave devel‐opment trends are quite different.The existing sub‐grade demonstrates a less perceptible in situ heave process but a more prominent in situ-segregation heave process than the new subgrade.The differences also indicate that migrated water is the primary source of both the existing and new subgrades.
Konrad and Morgenstern(1980)proposed the seg‐regation potential(SP)concept and suggested that the frost heave could be calculated by integrating Equa‐tion(1)over time.It should be noted that Equation(1)appliesto both saturated and unsaturated soils.
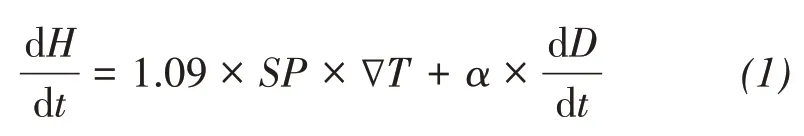
where,H is the frost heave deformation of the sub‐grade(mm);t is the freezing time(day);SP is the seg‐regation potential(mm2/d·°C);∇T is the temperature gradient(°C/mm);αis the in-situ heave ratio(%);D is the frozen depth(mm).
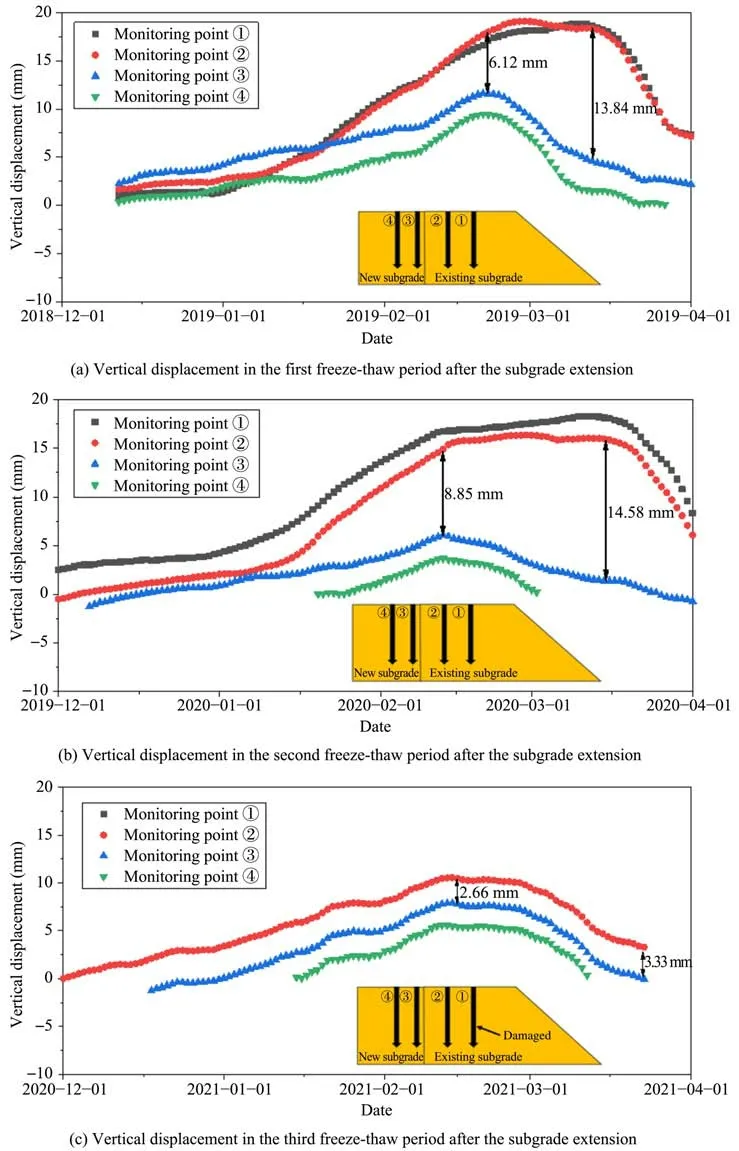
Figure 10 Vertical deformation on the subgrade surface during first three freeze-thaw periods after widening

Figure 11 Variations in the tensile strain obtained from the distributed optical fiber cables
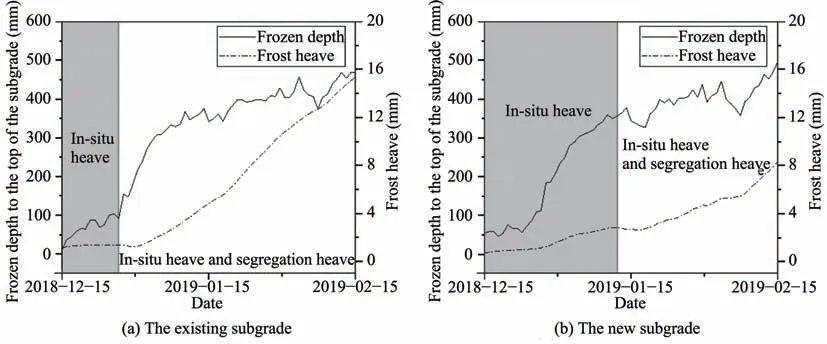
Figure 12 Development of frozen depth and frost heave during the first freezing period
The SP can be evaluated based on the observed frost heave and frozen depth using Equation(1).Fig‐ure 13 shows the SP changes with the freezing front's distance to the groundwater table(referred to as Dw).It should be noted that the groundwater table was 1 m below the ground surface.There is little water migra‐tion from the groundwater when the freezing front is far above the groundwater table(Miller,1972).The SP values of both the existing and the new subgrades are zero at the in situ heave stage,indicating almost no segregation heave.During the in situ-segregation heave stage,the SP value rises with the decrease in Dw,and eventually stabilizes when the freezing front is close enough to the groundwater table.The existing subgrade has larger SP values but a shorter in situ heave stage than the new subgrade,indicating that the SPis the main driving force of soil frost heaving un‐der an open system.
The SP value of the subgrade could also be eval‐uated by Equation(2),which categorizes the varia‐tion of SP with Dwinto three groups.The parameter values fitted based on the first year's observed frost heave values by the least-square method for the ex‐isting and new subgrades are listed in Table 2.The parameters were used to predict the frost heave dur‐ing the freezing period in the second year.The com‐parison of the observed and predicted frost heave values in Figure 14 shows that the model consisting of Equations(1)and(2)can effectively predict the frost heave of the existing subgrade and new subgrade.

where,SP1is the steady segregation potential value(mm2/(d·°C));D1,D2are the dividing distances of Dw(mm);SP0is the reference segregation potential(SP0=1 mm2/(d·°C));D0is the reference distance(D0=1 mm);A,B are parameters affecting SP,which can be obtained by experiments or moni‐toring results.
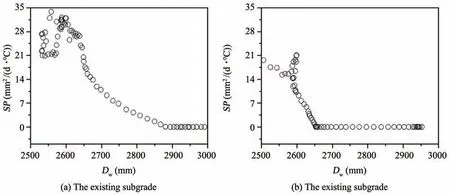
Figure 13 Variation of the SP values with the freezing front's distance to the groundwater table

Table 2 Fitted parameter values for the existing and new subgrades
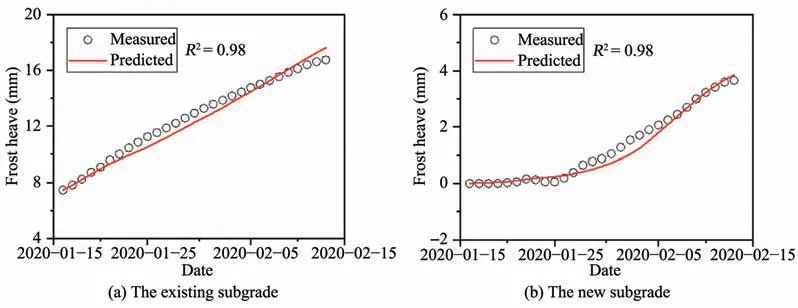
Figure 14 Comparison between measured and predicted results
5 Conclusions
This study investigates the differential frost heave characteristics of the widened subgrade in seasonally frozen regions.The maximum uneven frost heave position across the widened subgrade and the frost heave development trends within the new and existing subgrades in the first three years following widening are analyzed.The conclusions obtained are as follows:
(1)The existing subgrade has higher water con‐tent and dry density,leading to a slower cooling rate,faster heating rate,and more significant frost heave.Water migration from the existing subgrade into the new one helps reduce the frost heave in the existing subgrade,which stabilizes in the third year after widening.
(2)The frost heave in the new subgrade is sup‐pressed by the traffic loads in the second year but in‐creases due to the water supply from the existing sub‐grade and deep soil strata in the third year.
(3)The maximum frost heave and differential frost heave occur at the joint between the new and ex‐isting subgrades.Nonetheless,the differential frost heave in both the existing and new subgrades gradual‐ly diminishes after three years.
(4)An improved frost heave prediction model is developed based on the segregation potential concept and monitoring results.The model divides the sub‐grade heave process into two stages,including the in situ heave and in situ-segregation heave.
Acknowledgments:
The research was supported by the National Natural Science Foundation of China (Nos.42171128;41971076),the National Key Research and Develop‐ment Program of China(No.2018YFC1505306),and the Key Research and Development Program of Hei‐longjiang Province(No.GA21A501).
 Sciences in Cold and Arid Regions2021年5期
- Sciences in Cold and Arid Regions的其它文章
- Study on mechanical properties of soil-rock mixture of various compactness subjected to freeze-thaw cycles
- Strength characteristics and energy dissipation evolution of thawing silty clay during cyclic triaxial loading
- Impact of brine on physical properties of saline soils
- Study on thermal-state variation of high-grade highway embankment under different pavement conditions
- Numerical simulation of electroosmosis in unsaturated compacted clay
- Study on tensile damage characteristicsof sandstone under freeze-thaw cycles