Effect of future climate change on the water footprint of major crops in southern Tajikistan
Muhammadjon Kobuliev,Tie Liu,Zainalobudin Kobuliev,Xi Chen,Aminjon Gulakhmadov,,Anming Bao,e
aState Key Laboratory of Desert and Oasis,Xinjiang Institute of Ecology and Geography,Chinese Academy of Sciences,Urumqi,830011,China
bUniversity of Chinese Academy of Sciences,Beijing,100049,China
cInstitute of Water Problems,Hydropower and Ecology of the Academy of Sciences of the Republic of Tajikistan,Dushanbe,734042,Tajikistan
dResearch Center for Ecology and Environment of Central Asia,Chinese Academy of Sciences,Urumqi,830011,China
eChina-Pakistan Joint Research Center on Earth Sciences,CAS-HEC,Islamabad,45320,Pakistan
ABSTRACT
Danghara,a major food production area in southern Tajikistan,is currently suffering from the impact of rapid climate change and intensive human activities.Assessing the future impact of climate change on crop water requirements(CWRs)for the current growing period and defining the optimal sowing date to reduce future crop water demand are essential for local/regional water and food planning.Therefore,this study attempted to analyze possible future climate change effects on the water requirements of major crops using the statistical downscaling method in the Danghara District to simulate the future temperature and precipitation for two future periods(2021–2050 and 2051–2080),under three representative concentration pathways(RCP2.6,RCP4.5,and RCP8.5)according to the CanESM2 global climate model.The water footprint(WFP)of major crops was calculated as a measure of their CWRs.The increased projection of precipitation and temperature probably caused an increase in the main crop’s WFP for the current growing period,which was mainly due to the green water(GW)component in the long term and a decrease in the blue water(BW)component during the second future period,except for cotton,where all components were predicted to remain stable.Under three scenarios for the two future periods,a 10 d early sowing time was defined as an optimal sowing date,in which the WFPs of potato and winter wheat decreased from 5.7% to 4.8% and 3.4% to 2.2%,respectively.Although the WFP of cotton demonstrated a stable increase,according to the optimal sowing date,a decrease in irrigation demand or BW was expected.The results of our study might be useful for developing a new strategy related to irrigation systems and could help to find a balance between water and food for environmental water demands and human use.
ARTICLEINFO
Keywords:
Optimal sowing date
Representative concentration pathway
Crop water requirement
Statistical downscaling method
Green water
Blue water
Southern Tajikistan
1.Introduction
Climate change can have potential impacts on flora and fauna,especially in semi-arid regions.The Intergovernmental Panel(IPCC)on Climate Change Fifth Assessment Report(AR 5)predicted significant changes in the average global temperature and precipitation.The annual temperature increased by 0.85°C over the last 132 a(1880–2012)and will continue to increase with distinct spatial variations(IPCC,2014).In many regions,changes in precipitation vary in terms of frequency and intensity(Min et al.,2008,2011),potentially leading to drought(Dai,2011,2013).Alterations in the climate are expected, which could have a strong socio-environmental impact in Central Asia(Lutz et al.,2014;Christmann and Aw-Hassan,2015;Closset et al.,2015).According to the World Bank Report(2009),Tajikistan is one of the countries most vulnerable to the effects of climate change.Over the past decades,special attention has been paid to the impact of climate changeon food security,agriculture,and economy in Central Asia(Savitskiy et al.,2008;Olsson et al.,2010).Researchers have paid increasing attention to the concept of water and food security.Several integrated methodological approaches have been developed to solve problems with water and food scarcity at different levels and under different conditions(Hellegers et al.,2008;Rasul,2014).Understanding and identifying the relationship between these core resources and improving their use efficiency is crucial for global well-being(Jalilov et al.,2016).
The economy of Central Asia is mainly related to agriculture and agro-industry(Henley and Assaf,1996;Pomfret and Anderson,2001)and is highly susceptible to hydro-meteorological changes and water availability(Collins,2009;Bernauer and Siegfried,2012).Water resources have a dramatic influence on food security in Tajikistan,especially for the Sughd Province,Khatlon Province,Viloyati Mukhtori Kuhistoni Badakhshon,and the Rayons of Republican Subordination,which have special status in the process of the country’s sustainable economic strategy until 2030(Institute of Public Policy and Administration,2016).Danghara in the Khatlon Province is the most arable district and the main rural area of the country,where cotton and cereal crops are the major agricultural products.Cereals,including wheat,corn,sorghum,and rice,are considered the main crops,as they are the staple food for most people.Potato is a valuable food and is also largely consumed by the country’s population(International Potato Center,2016).As a result of the volume of industrial(Odinaev et al.,2018)and agricultural production,the positive or negative impact of climate change in this region will have an influence on food security throughout the wider region and even the country.
Sound water management tactics can be a crucial to future agriculture management,especially in light of climate change(Stewart and Lal,2018).Thus,the assessment of regional crop demand for water resources can provide a basis for the enhanced use of water resources in agricultural production:water footprint(WFP)provides an effective tool for this purpose(Cao et al.,2017).WFP can be divided into blue,green,and gray water components.Blue water(BW)and green water(GW)refer to the components(i.e.,irrigation water and effective precipitation)which used for crop consumption(Egan,2011).Scientists quantified and analyzed the crop WFP on various zonal scales(Cao et al.,2015),including agricultural land(Castellanos et al.,2016),irrigation areas(Johnson et al.,2015),administrative regions(Zhao et al.,2015),river basins(Dumont et al.,2013),nations(Bulsink et al.,2010),and even all over the world(Hoekstra and Mekonnen,2012).As a result of the typical living conditions of the population,agricultural production,and water resources,the crop WFP in Tajikistan has been reported,and these reports may provide a general view of the country’s agricultural and industrial water use that covers a large spatial scale(Chapagain and Hoekstra,2004).
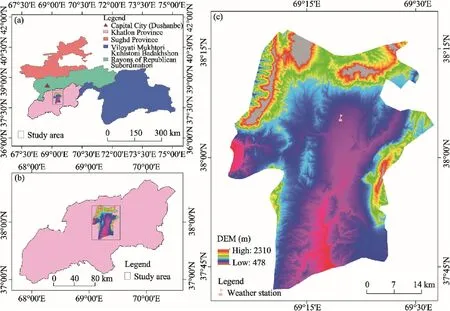
Fig.1.Locations of the four administrative divisions within Tajikistan(a),the Danghara District within Khatlon Province(b),and terrain elevation of the Danghara District and weather station location(c).
Although there are several studies on climate change and water resources in Central Asia(Lioubimtseva et al.,2005;Lioubimtseva and Henebry,2009;Aldaya and Hoekstra,2010;Kobuliev et al.,2020),they cannot fully describe the regional demand on water resources.Only a few studies are devoted to the southern part of Tajikistan,and those studies do not cover the potential impacts of climate change on green and blue WFPs under various representative concentration pathways(RCPs).
This study focused on the potential impact of climate change on the water requirements of major crops in the semi-arid area of the Danghara District of the Khatlon Province in southern Tajikistan is an effort to understand the knowledge of climate and hydrometeorological information about the area and the WFPs of the main crops to fill the current research gap.In this study,we used the statistical downscaling method(SDSM)(Wilby and Dawson,2007)and the WFP methodology(Hoekstra et al.,2011)with the aims to(i)find out the characteristics of future maximum temperature(MaxT),minimum temperature(MinT),and precipitation in the study area;(ii)determine the WFP of the main crops;(iii)estimate the effect of climate change on the WFP of the existing growing periods of the main crops during the future periods of 2021–2050 and 2051–2080;and(iv)define the optimum sowing times/dates for reducing the future crop water demand of the major crops in light of coming(2021–2050)and later(2051–2080)climatic challenges by applying an adaptation method.
2.Materials and methods
2.1.Study area
This study was conducted in the Danghara District(Fig.1),which is located in a mainly flat area with higher elevation in the central part of the Khatlon Province,Republic of Tajikistan.The elevation of the Danghara District ranges from about 478 to 2310 m a.s.l.The climate of the area is classified as dry subtropical(Kyzyl Sui agro-climatic region).Winter is mild and short.Mean January temperature varies between-3°C and 6°C.Summer is hot,dry,and long;July temperature varies from 22°C to 38°C.The frost-free period lasts more than seven months(210–220 d).Precipitation falls mainly at the end of winter and in the entire period of spring,which is warm and wet. Mean annual precipitation is 580 mm. The area is advanced in agriculture and ranks first as the most seeded area in the country.This is the major reason for choosing this district to investigate the impact of climate change on the water requirements of the main crops.
2.2.Data collection
Annual yield,total seeded area,and productivity of potato,cotton,and winter wheat(2004–2016;Fig.2)were obtained from the national statistics(Tajikistan Statistics Bureau,2010,2017).Crop coefficients(Smith and Kivumbi,2002)and planting and harvesting dates for the different crops were obtained from FAO(Aziz et al.,2008).The meteorological data of temperature and precipitation for 1975–2016 were provided by the National Hydrometeorology Agency (NHA) (http://meteo.tj). The CanESM2 general circulation model was used and obtained from the Canadian climate data and scenarios website(http://climate-scenarios.canada.ca). The CanESM2 projections between 2006 and 2100 were obtained for three RCPs,namely,RCP2.6,RCP4.5,and RCP8.5,which are defined under future projections of greenhouse gas emissions,and possible ranges of radiative forcing values of 2.6,4.5,and 8.5 W/m2,as well as CO2concentrations of 420,540,and 940 mg/L(in the year 2100),respectively(van Vuuren et al.,2011).Planting and harvesting dates and average yield(2004–2016)of major crops are presented in Table 1.

Table 1Planting and harvesting dates and average yield(2004–2016)of potato,cotton,and winter wheat.
2.3.Statistical downscaling of climate projections
SDSM,as a combination of the stochastic approach and multiple linear regression,is a widely used model to downscale temperature and rainfall projections,from the general circulation model to the regional level.Freely available and comparatively easy to use,the software performs several functions,such as quality control,predictor screening for model calibration,weather generation,and scenario generation(Wilby and Dawson,2013;Parvaze et al.,2016).

Fig.2.Annual yield(a),total seeded area(b),and productivity(c)of potato,cotton,and winter wheat in the baseline period(2004–2016).
2.3.1.Screening of predictors for statistical downscaling
Choosing the predictors consists of selecting atmospheric parameters using the multiple linear regression model,based on P-value,scatter plots,histograms,partial correlation,and correlation matrix.In this study,a correlation matrix was preferred between predictands and CanESM2 predictors.The selected parameters for MaxT,MinT,and amount of precipitation,and the description of predictors for the weather station can be found in Table 2(Wilby et al.,2002).
2.3.2.General circulation model correction
There are two ways to optimize the SDSM,using either dual simplex method or ordinary least square.Although ordinary least square was faster(Tahir et al.,2018),dual simplex method was used referring to the requirements of the SDSM manual(Wilby and Dawson,2007).A regression equation was applied in the weather station,and both the conditional and unconditional sub-models were used.The root mean square error(RMSE),Durbin Watson(DW),and correlation coefficient(R2)were used to check the accuracy of the simulated and observed data of the model during the calibration as well as validation periods(Table 3).The model calibrated for the period 1975–1995 was used as the baseline condition to simulate the daily MaxT,MinT,and precipitation for the period 1996–2005 with the help of the National Centers for environmental prediction reanalysis and CanESM2 predictors.In order to improve the simulations,we used the maximum available ensembles to derive the average,which was then used for the validation of 1996–2005 with observed data.During calibration and validation,the model was found to overestimate the precipitation,but the temperature was better simulated(Fig.3).The RMSE,R2,and DW of MaxT,MinT,and precipitation data are presented in Table 3.

Table 2List of chosen predictor variables.

Table 3Statistical evaluation of statistical downscaling method(SDSM)performance with calibration(1975–1995)and validation(1996–2005).

Table 4Mann-Kendall test results for temperature and precipitation for the periods 2021–2050 and 2051–2080.
2.4.Model for crop water requirements(CWRs)
CWRs are the key component for calculating the WFP.The CROPWAT model as a decision support tool was highly recommended by Hoekstra et al.(2009)to simulate the CWRs,under irrigated and rainfed conditions.For the daily reference evapotranspiration and solar radiation,the Penman-Monteith equation(in CROPWAT)was utilized(Allen et al.,1998).We used the CROPWAT model according to the crop phenology and crop coefficients to calculated the total CWRs,effective rainfall(by USDA S.C.method),and irrigation requirements in the district(Allen et al.,1998).The calculations were performed using actual(from NHA)and projected(CanEsm2)climate data from the Danghara weather station.
2.5.Green water(GW)and blue water(BW)estimations
The GW and BW(which are the components of the WFP)of cotton,potato,and winter wheat production were calculated using the methodology described by Hoekstra et al.(2011).Thus,the GW(m3/t)of the crop was calculated as the ratio of the green water use(GWU,m3/hm2)to the crop yield(t/hm2),where the total GWU was obtained by summing up green water evapotranspiration(ETogreen)over the growing period. We calculated the GWU according to the CROPWAT model outputs, as the minimum of crop evapotranspiration(ETc)and effective rainfall(ER)with a time step of 10 d.
The BW of each crop was considered to be equal to the ratio of the volume of irrigation water consumed/requirement to the crop yield.The irrigation water consumed/requirement was taken to be equal to the irrigation requirement as estimated with the CROPWAT model.When the effective rainfall is greater than the CWR,the irrigation requirement is equal to zero.The total evapotranspiration of irrigation water was obtained by summing up the blue water evapotranspiration(EToblue)over the growing period.CWRs were always assumed to be fully satisfied(Morgounov et al.,2005).In addition,the total WFP was estimated by summing the GW and BWcomponents(Eq.(1)).

Fig.3.Calibration(a–c)and validation(d–f)differences in observed(Obs)and simulated(Sim)monthly mean maximum temperature(MaxT),minimum temperature(MinT),and precipitation.

where Y is the crop yield(t/hm2);IWR is the irrigation water consumed/requirement(hm2);IR is the irrigation requirement(mm).
3.Results and discussion
3.1.Statistical downscaling model
Our results were based on all three scenarios,i.e.,RCP2.6,RCP4.5,and RCP8.5,under the Coupled Model Intercomparison Project 5(CMIP5)-CanESM2,which was modeled to find out the future MaxT,MinT,and precipitation of two future periods(2021–2050 and 2051–2080).Although a number of researchers have taken the period 1976–2005 as a baseline(Wilby and Dawson,2007),in this study,we opted to select the whole dataset provided by the NHA as a baseline.Thus,the projection of future values of MaxT,MinT,and precipitation depended on a comparison of these time intervals,i.e.,1975–2016 compared with 2021–2050 and 2051–2080,respectively.
The Mann-Kendall nonparametric statistical trend test(Pohlert,2016)was applied to investigate monotonic trends in the annual time series of two future periods.The long-term trends of MaxT,MinT,and precipitation in the two future periods are shown in Table 4.

Fig.4.Long-term(2021–2080)annual variation of the MaxT(a–c),MinT(d–f),and precipitation(g–i)under the RCP2.6,RCP4.5,and RCP8.5 compared with the baseline period.mu1,mean fixed trend of the period 2021–2050;mu2,mean fixed trend of the period 2051–2080.
3.1.1.Temperature variables
For both the future periods 2021–2050(first future period)and 2051–2080(second future period),the annual MaxT and MinT demonstrated a rising trend for all three scenarios.Annual MaxT increased by 0.35°C,0.40°C,and 0.61°C in the Danghara District in the first future period in accordance with RCP2.6,RCP4.5,and RCP8.5,respectively.Similar to the MaxT,the projection showed an upward trend in the MinT.Annual average increases of MinT were projected to be 0.23°C,0.27°C,and 0.39°C under the RCP2.6,RCP4.5,and RCP8.5,respectively.Similarly,for the second future period,the annual MaxT increased by 0.51°C,0.70°C,and 1.26°C,and the annual MinT increased by 0.34°C,0.46°C,and 0.93°C under the RCP2.6,RCP4.5,and RCP8.5,respectively.It must be noted that,although the general trend of all future projections was upward,this trend decreased slightly for both MaxT and MinT in the second future period under the RCP2.6.Furthermore,in the first future period,annual average MaxT and MinT decreased year by year under all three RCPs(Fig.4).These agree with the AR5 of IPCC(2014),which predicted that the approximate future air temperature in accordance with RCP2.6 will increase by the middle of this century,and then slightly decrease,while the air temperature will slowly but continuously increase in accordance with RCP4.5.Under the RCP4.5 and RCP8.5,there will be a continuous but relatively rapid increase in air temperature towards the end of the century.
The projected MaxT and MinT of the two future periods,under various scenarios,were split into seasons for further analysis of future changes.The season with the largest increase in MaxT and MinT was autumn(September to November);the season with the lowest increase was spring(March to May).The remainder of the seasons,i.e.,summer(June to August)and winter(December to February),remained relatively stable in terms of MaxT and MinT as compared with the autumn.The same seasonal trends of MaxT and MinT were observed in both time intervals,i.e.,2021–2050 and 2051–2080,under the RCP2.6,RCP4.5,and RCP8.5(Fig.5).Similar results were obtained by Ouhamdouch and Bahir(2017)who studied climate change in the semi-arid regions of the Essaouira Basin in Morocco.
3.1.2.Precipitation
Under all three RCP scenarios,for the first and second future periods,the precipitation demonstrated slight fluctuations year by year,but overall,it was predicted that total precipitation in the region will increase during the first and second future periods compared with the baseline.The change in precipitation was predicted to be a bit different under the RCP2.6and RCP4.5,compared with the RCP8.5,in which a significant increase in precipitation was predicted through the period 2021–2050;after which,a slight decrease was predicted in the period 2051–2080.The approximately estimated change was 8.42%,7.96%,and 10.78% to the middle century(2021–2050),and 10.89%,10.77%,and 8.92% for the second future period,under the RCP2.6,RCP4.5,and RCP8.5,respectively,in the Danghara District(Fig.4).We analyzed the future changes of MaxT,MinT,and precipitation in a seasonal scale.According to the first and second future periods,precipitation exhibited an increasing trend in autumn and spring seasons.Furthermore,the season that received the lowest precipitation was summer(June to August)for both study periods.The remainder of the seasons,autumn(September to November),winter(December to February),and spring(March to May)were estimated to receive more precipitation for the 2021–2050 and 2051–2080 periods,as compared with summer(Fig.5).The MaxT,MinT,and precipitation trends in the Danghara for both the future periods 2021–2050 and 2051–2080 are shown in Table 5.
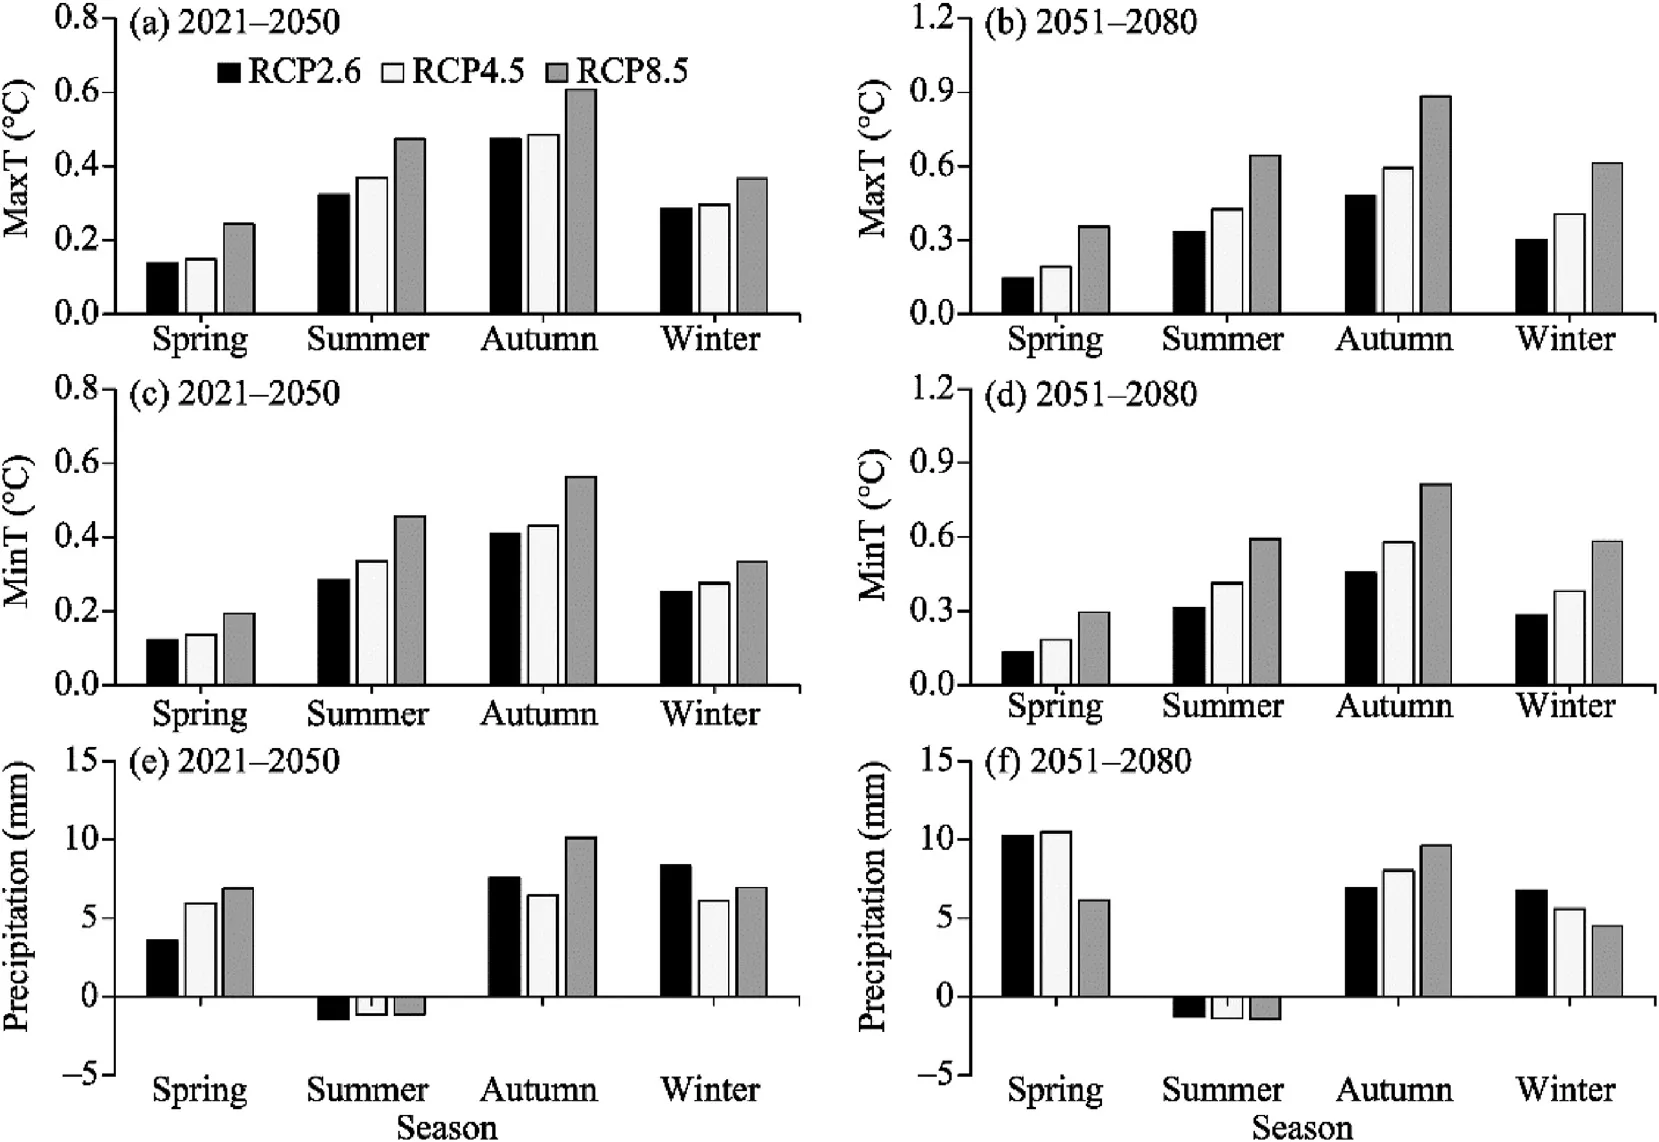
Fig.5.Difference of seasonal changes in MaxT(a,b),MinT(c,d),and precipitation(e,f)under the RCP2.6,RCP4.5,and RCP8.5 for the study periods 2021–2050 and 2051–2080 compared with the baseline period.The positive values represent the increase of precipitation,while the negative values indicate the decrease of precipitation.
A consistent increase in precipitation may be caused by faster atmospheric circulation in the region,while in the period 2051–2080,the precipitation(RCP8.5)was expected to reduce,which means the water scarcity in the future might hinder agricultural production in the region.Similar results were obtained by Yang et al.(2017)when studying climate change in the Tianshan Mountains and northern Kunlun Mountains.
3.2.Water footprint(WFP)of primary crops
The WFP values of winter wheat,cotton,and potato were simulated with CROPWAT,and the results were evaluated by comparing with previous studies on the WFP of similar crops in Tajikistan(Aldaya and Hoekstra,2010),Danghara District(Chapagain and Hoekstra,2004),and similar semi-arid regions(Thaler et al.,2017)and other countries(Cabello et al.,2016)in the world.For demonstration purposes,we presented the assessed yield and WFP components of potato,cotton,and winter wheat in different regions of the globe.A detailed description is shown in Table 6.The difference between values confirmed the point raised by Herath(2013)about the need for more precise measurements and calculations of the WFP prior to its use as an effective tool to manage sustainability locally.

Table 5MaxT,MinT,and precipitation increase in the Danghara for the six future decades compared with the baseline period.

Table 6Comparison of the yield and water footprint(WFP)components of major crops in different countries during the different period.
The WFP of cotton in the Danghara was larger and the WFP of winter wheat was smaller than those reported by Aldaya and Hoekstra(2010).The differences were 163 and 1727 m3/t for cotton and winter wheat,respectively.This is mainly related to the higher values of the GW and lower values of the BW of cotton,and the higher values of both GW and BW of winter wheat.The reason for this inequality is the difference in rainfall in the Danghara,which on average exceeded the average annual rainfall at Bokhtar station(formerly Kurgantube),which was used in the study of Aldaya and Hoekstra(2010).The large difference in the WFP of winter wheat can be simply explained by the difference in the average annual crop yield,which in the Danghara was almost 78% higher than that in Tajikistan(Aldaya and Hoekstra,2010)and 38% lower than that in Austria(Thaler et al.,2017).Similar to the WFP of cotton and winter wheat,the WFP of potato in the Danghara was higher in terms of GW and lower in terms of BW compared with the WFP from potato in Cuba(Cabello et al.,2016).
3.2.1.GW and BW footprints
The results of the average GW and BW and total WFP for the last 13 years in the Danghara District are shown in Fig.6.The average value of the GW was 0.05×106,2.80×106,and 44.30×10⁶m3,and the average value of the BW was 0.03×106,23.80×106,and 53.40×10⁶m3for potato,cotton,and winter wheat,respectively.Thus,the average value of the total WFP was 0.08×106,26.60×106,and 97.70×10⁶m3for potato,cotton,and winter wheat,respectively(Fig.6).Although the region’s climatic conditions are suitable for growing cotton,difficulties related to frequent irrigation forced farmers to grow more simple crops,such as winter wheat,which does not demand frequent watering(Turok et al.,2013).Irrigated serozem soils in the south of the country are not as productive for growing potato as the dark serozem soils in the central Tajikistan.Therefore,cereals are a major crop in the Danghara District.Thus,the WFP of winter wheat is so much larger than that of cotton and the WFP of potato is so low compared with the other crops.
3.2.2.Future crop water demand
Many scholars have tried to figure out the future crop water demand by various statistically manipulated productivity scenarios(Huang et al.,2019),but unfortunately,in our case,as a result of the lack of data in the early years of independence(Atkin,1997),we were unable to collect enough data to follow them.Therefore,the average crop yield of 2005–2016 was chosen as an indicator,which will play a role in future productivity.The average monthly predicted values of MaxT,MinT,and precipitation for the two future periods under the RCP2.6,RCP4.5,and RCP8.5 were simulated using CROPWAT,the future WFP was determined using the same calculation method.
Under all scenarios for the two future periods,the changes in the WFP of the main crops,for current growing period,was dominated by the GW component.Therefore,the GW of cotton was predicted to increase by 4.3%,7.8%,and 7.1% during the first future period,and by 7.1%,7.4%,and7.2% during the second future period, under the RCP2.6,RCP4.5,and RCP8.5,respectively.Similarly,the GW ofpotato was predicted to increase by 5.3%,6.9%,and 7.4% during the first future period,and by 9.6%,10.1%,and 7.5% during the second future period,under the RCP 2.6,RCP4.5,and RCP8.5,respectively.The largest increase in the GW occurred for winter wheat,where the increase was predicted to be 7.5%,8.7%,and 9.2% during the first future period,and 10.6%,11.0%,and 9.3% for the second future period,under the RCP 2.6,RCP4.5,and RCP8.5,respectively.Unlike the GW,the results of BW did not demonstrate a completely upward trend,and it was clear that the need for irrigation of potato in the first future period and of winter wheat in the two future periods will mainly decrease.However,in the case of cotton,the BW of the WFP was predicted to increase slightly;an approximate increase was expected by 1.4%,0.9%,and 1.5% in the period 2021–2050,and by 1.0%,1.2%,and 2.3% in the period 2051–2080,under the RCP2.6,RCP4.5,and RCP8.5,respectively.Details of the WFP in the first and second future periods are given in Fig.7.

Fig.6.Average green water(GW),blue water(BW),and total water footprint(WFP)of potato,cotton,and winter wheat in the Danghara District in the baseline period 2004–2016.The upper whisker represents the maximum;the top of the box represents the upper consumption;the bottom of box represents the lower consumption;the band in the box represents the median;the black circle represents extreme value;and“× ”represents the average value of cultivars water footprint.
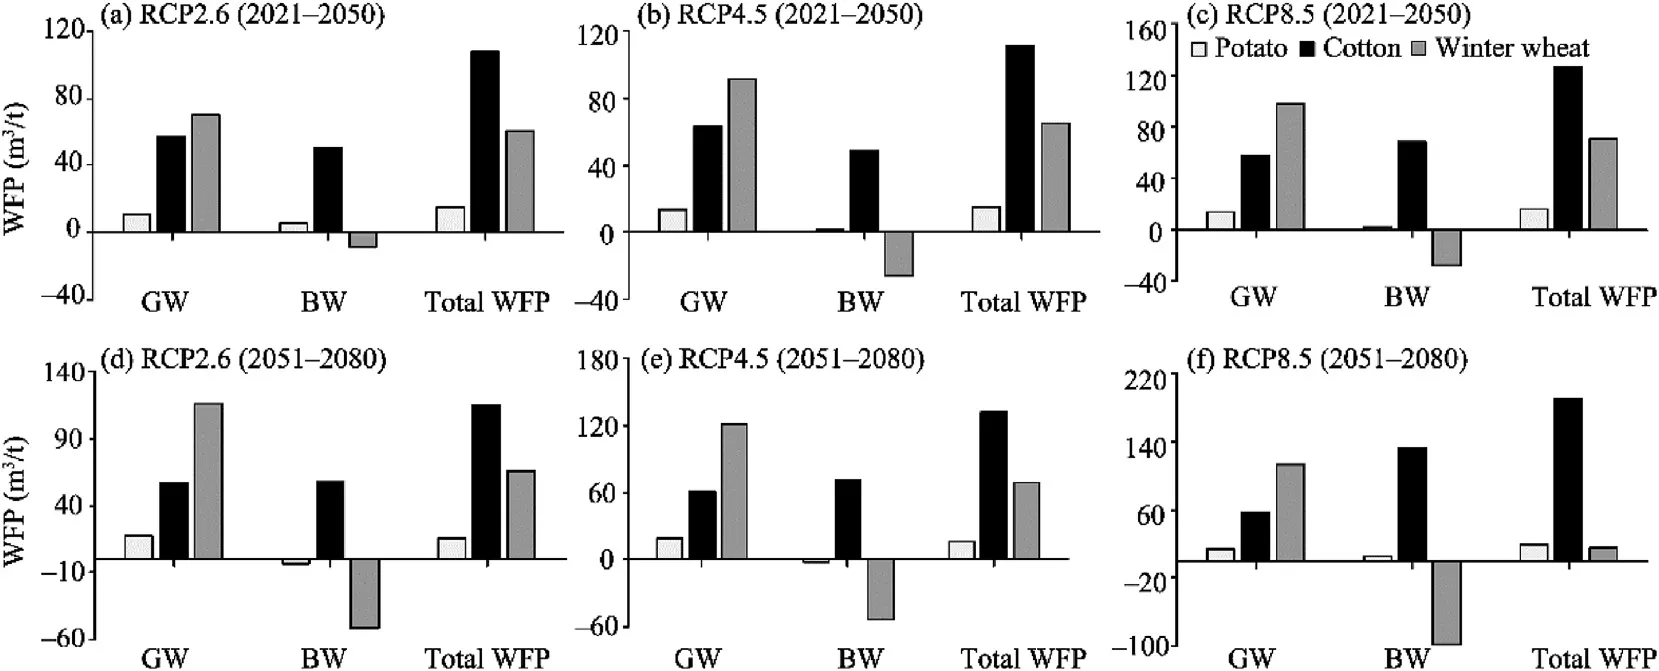
Fig.7.Changes in GW,BW,and total WFP of potato,cotton,and winter wheat of current growing period in the Danghara District for the periods 2021–2050 and 2051–2080 compared with the baseline period.
The impact of climate change on CWRs and productivity of crops depends on the phenology of crop species(Parry et al.,2005).Consequently,an increase in effective rainfall during the vegetation period leads to a decrease in irrigation requirement.Thus,a stable increase in effective rainfall will lead to a relative decrease in irrigation requirement of winter wheat during the first future time period,under the RCP4.5 and RCP8.5.Similarly,for the period 2051–2080,the irrigation requirement of winter wheat and potato will decrease under the RCP2.6 and RCP4.5.
All these changes in the WFP are associated with the results of our multi-scenario forecasts,according to which,winter wheat and autumn potato will receive more rainfall during the growth period.On the other hand,despite the annual increase in rainfall,the need for watering cotton will increase due to the life cycle of this crop,which is mainly in the dry months of the seasons.Our results are in line with a similar study by Zhuo et al. (2016) on consumptive WFP with a focus on crop production under the RCP4.5 and RCP8.5(including CanEsm2),in which the WFP of major crops(cotton,winter wheat,and potato)in similar semi-arid and arid regions of Xinjiang and Ningxia in China,will grow stable.
3.2.3.Optimum sowing time as an adaptation strategy for reducing the future CWR
It is likely that if the climate changes,farmers will adapt their planting and harvesting dates accordingly.Therefore,we applied the adaptation method due to the fact that our data on plant phenology were taken from the FAO,in which the averages of the specific region,i.e.,Khatlon Province,were considered.The agronomic adaptation strategy evaluated in this study was used to determine the optimal sowing times/dates for crop water response in all three RCP scenarios.In this study,we selected the optimal sowing dates 5 and 10 d earlier,and 5 and 10 d later for cotton,winter wheat,and potato.In addition,when simulating cultivars,identical models and calculations were considered.
The crop water response or WFP of sowing periods under all three climate scenarios for the two future periods are shown in Fig.8.In all scenarios for the two future periods,delaying the sowing date was predicted to increase the CWRs.On the other hand,the CWRs of the early sowing strategies/dates were less than the baseline. According to the 10 d early sowing strategy, under all RCP scenarios for the two future projected periods,the WFPs of potato and winter wheat will decrease.Compared with the current growing period,an early sowing strategy for 5 d will require more watering.However,under the RCP2.6 and RCP4.5 for both future periods,a bit less water was required for winter wheat.As a result of the life cycle,the WFP of cotton was predicted to maintain a steadily increasing trend.
We opted to choose the optimal sowing date,i.e.,10 d early sowing strategy for further description.Thus,as for current growing period,the changes in the WFP of main crops for the optimal sowing date was dominated by the GW.The increases of effective rainfall for potato,cotton,and winter wheat were expected to vary from 10.5%–14.4%,13.3%–14.4%,and 9.4%–11.2% for the first future period,and 12.4%–14.9%,13.4%–15.0%,and 11.3%–12.5% for the second future period,under the three RCP scenarios,respectively.Subsequently,a stable increase in effective rainfall led to a relative decrease in irrigation requirement for all crops,with the exception of cotton under the RCP8.5 during the first and second future periods.The results of the CWRs and WFPs of main crops for the optimum sowing date are presented in Table 7.
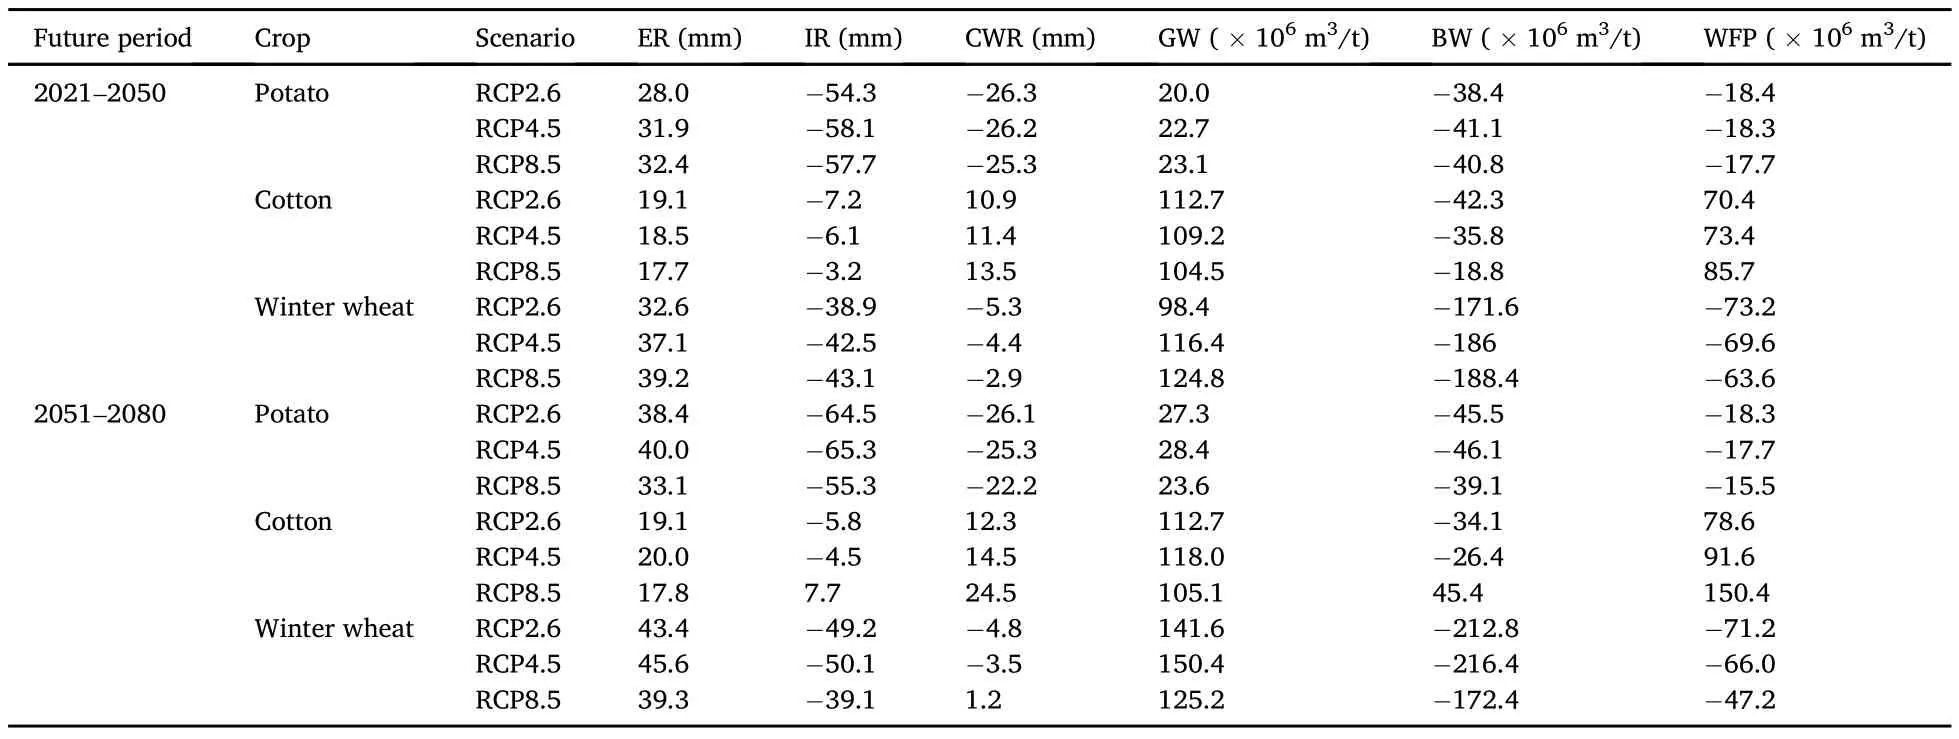
Table 7Variations in crop water requirement(CWR)and WFP of major crops for optimum sowing date under the three RCPs for the periods 2021–2050 and 2051–2080 compared with the baseline period.
From the observations of Barbone et al.(2010),we can conclude that,despite public awareness of the different consequences of climate change,farmers are largely not adapted to the expected risks.Indeed,faster economic and social development,as well as proper water management and infrastructural improvements,are crucial to adaptation and adaptive capacity.However,adaptation to climate change will inevitably involve using water more efficiently.Current water tariffs for drinking and irrigation purposes are set at a very low level and do not cover the costs of water provision and system rehabilitation.Thus,the depletion of water resources and the growing demand for food require higher water efficiency in agriculture,and the optimal sowing date can reduce future CWR,minimizing the negative impact on productivity of the main crops in light of the coming and later climatic challenges.
The findings of this study are in accordance with the findings of other studies conducted in the country(Tajikistan)or similar arid and semi-arid regions of Punjab(Pakistan)in the world.For instance,Pulatov(2017)mentioned similar kinds of adaptation measures(changing planting dates)being adopted by farmers in Tajikistan.However,he suggested the use of water-saving irrigation technologies for more water use efficiency in agriculture.Abid et al.(2016)found that farmers in the arid and semi-arid regions of Pakistan were adopting various types of adaptation strategies depending on their location and type of the climate issue.They further found that in the rainfed region,farmers mostly changed planting dates according to variations in rainfall and temperature.
4.Conclusions
In this study,the SDSM was applied to project future climate change in the Danghara District,Southern Tajikistan,under the RCP2.6,RCP4.5,and RCP8.5.The historical data from 1975 to 2005 were applied as predict and in the SDSM to select fit predictors for measuring future changes.After successful calibration and validation of SDSM,the future MaxT,MinT,and precipitation were simulated separately for all the three RCP scenarios.In all three scenarios,the temperature and precipitation are expected to increase in 2021–2050 and 2051–2080 under the RCP2.6,RCP4.5,and RCP8.5.CWRs were modeled using CROPWAT,and the actual WFP was calculated.The WFP results were evaluated by comparing with previous studies.Despite the WFP of cotton being almost the same as previous reports,the differences in components were noticeable.The WFP of winter wheat in this study was almost 45% less than that in previous studies and the WFP of potato can be considered comparable to other arid and semi-arid regions in the world.Besides,the first and second projected annual averages of MaxT,MinT,and precipitation under the three RCP scenarios were used as the input in CROPWAT to simulate the CWR.Taking into account all of the factors,an approximate increase in WFP for current growing periods was predicted in the future,mainly as a result of the GW component in the long term and a decrease in the BW component in the second future period,with the exception of cotton,where all components were predicted to remain stable.Subsequently,we can conclude that an increase in rainfall during wet seasons and a decrease in dry months may have a corresponding effect on crop growth requirements.However,to avoid the future increase in CWR,we applied an adaptation method to determine the optimum sowing times/dates.For all scenarios in the two future time periods,a 10 d early sowing time/date was defined as the optimal sowing date.The results of our study might be useful for developing a new strategy in relation to irrigation systems and could help to find a balance between water and food for environmental water demands and human use.This study used data of weather station to simulate future climate change and estimated the water footprint of major crops based on CWRs and irrigation requirement,ignoring the uncertainty of irrigated farmland in southern Tajikistan;therefore,we expect to improve this study in future work.
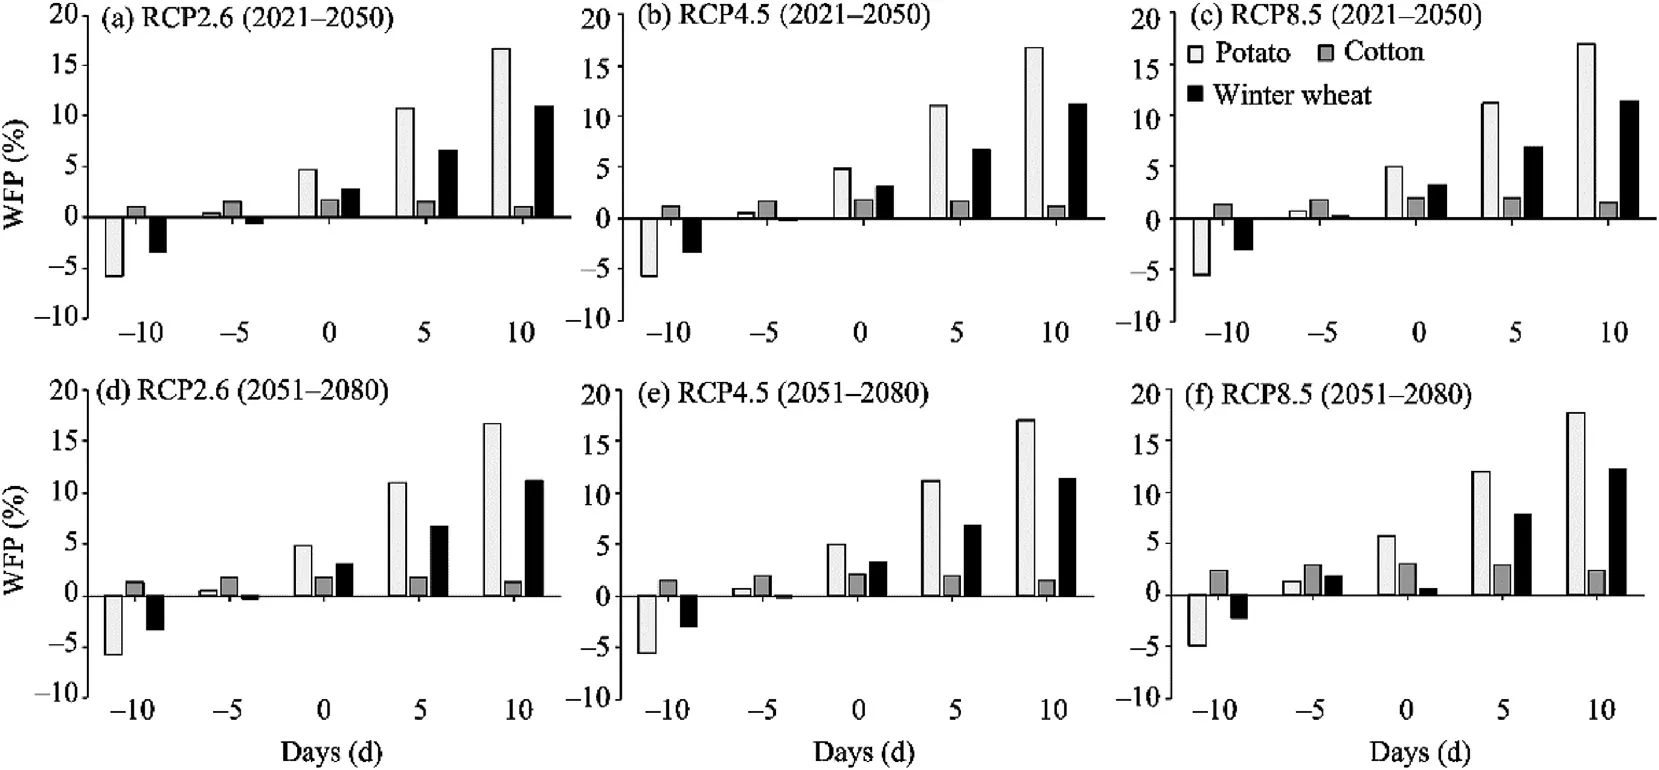
Fig.8.Changes in the WFP of potato,cotton,and winter wheat in the Danghara District for the periods 2021–2050 and 2051–2080 compared with the baseline period.The positive values of days represent earlier than optimal sowing dates(5 and 10 d earlier),while negative values of days indicate later than optimal sowing dates(5 and 10 d later).
Declaration of competing interest
The authors declare that they have no known competing financial interests or personal relationships that could have appeared to influence the work reported in this paper.
Acknowledgements
This study was supported by the National Natural Science Foundation of China(41761144079),the State’s Key Project of Research and Development Plan(2017YFC0404501),the CAS Interdisplinary Innovation Team(JCTD201920),the Strategic Priority Research Program of the Chinese Academy of Sciences,the Pan-Third Pole Environment Study for a Green Silk Road(XDA20060303),the International Partnership Program of the Chinese Academy of Sciences(131551KYSB20160002),the CAS Research Center for Ecology and Environment of Central Asia(Y934031),and the Regional Collaborative Innovation Project of Xinjiang Uygur Autonomous Region(2020E01010).The authors would like to acknowledge the editorial board of the journal and two anonymous reviewers for their constructive comments on this paper.
- 区域可持续发展(英文)的其它文章
- Purchase willingness of new energy vehicles:A case study in Jinan City of China
- Assessing the adequacy and sustainability performance of multi-family residential buildings in Anambra State,Nigeria
- Impact of high-speed railway construction on spatial relationships in the Guanzhong Plain urban agglomeration
- Exploration of the dynamic water resource carrying capacity of the Keriya River Basin on the southern margin of the Taklimakan Desert,China
- Spatial pattern and drivers of urbanization in China’s mid-level developing urban agglomeration:A case study of Chang-Zhu-Tan
- Dynamics of NDVI and its influencing factors in the Chinese Loess Plateau during 2002–2018

