
Protective effect of LIF-huMSCs on the retina of diabetic model rats
2021-11-08 01:45:46ShanNaChenZhiGangXuYingXueMaSongChenGuangHuiHeMeiHanXiangGaoJunHuaWangBinWuJianWang
Shan-Na Chen, Zhi-Gang Xu, Ying-Xue Ma, Song Chen, Guang-Hui He, Mei Han,Xiang Gao, Jun-Hua Wang, Bin Wu, Jian Wang
1Clinical College of Ophthalmology, Tianjin Medical University, Tianjin 300070, China
2Tianjin Eye Hospital, Tianjin Eye Institute, Tianjin Key Lab of Ophthalmology and Visual Science, Tianjin 300020, China
3Xiamen Kehong Eye Hospital, Xiamen 361000, Fujian Province, China
4Department of Ophthalmology, Baoan Central Hospital,Shenzhen 518000, China
5Department of Ophthalmology, Tianjin First Central Hospital,Tianjin 300192, China
6Department of Vitreous and Retinopathy, Tianjin Eye Hospital,Tianjin Eye Institute, Tianjin Key Lab of Ophthalmology and Visual Science, Tianjin 300020, China
7Department of Ophthalmology, Tianjin Eye Hospital, Tianjin Eye Institute, Tianjin Key Lab of Ophthalmology and Visual Science, Tianjin 300020, China
8Studying for a Doctor of Medicine Degree from Nankai University, Tianjin 300000, China
Abstract
● KEYWORDS: leukemia inhibitory factor; human umbilical cord mesenchymal stem cells; diabetic retinopathy; diabetic rats; adiponectin; high-sensitivity C-reactive protein; neurotrophin-4
INTRODUCTION
D iabetic retinopathy (DR) is the most common and serious vision-threatening diabetic complication and is one of the leading blinding eye diseases globally[1]. A growing body of evidence indicates that local inflammation and oxidative stress are crucial in the pathogenesis of DR. DR patients are treated with invasive ophthalmic surgery only in the late stage of the disease. The surgery does not have obvious benefits for vision recovery. If possible, interventions directed at local inflammation and oxidative stress in the early stage of DR lesions would greatly benefit disease control. Thus, a method that is less invasive but more effective in preventing or delaying the progression of DR is needed.
Mesenchymal stem cells (also termed mesenchymal stromal cells; MSCs) are promising therapeutic agents by virtue of their ability to promote tissue regeneration through a pleiotropic mechanism in the absence of significant adverse events[2]. In a review article, Fioriet al[3]highlighted the use of different cell types in preclinical models of DR, including embryonic or induced pluripotent stem cells, hematopoietic stem cells, endothelial progenitor cells, and MSCs. MSCs have been studied most intensively for cell therapy, given their multiple modes of action. Zhanget al[4]injected neural stem cells (NSCs) derived from umbilical cord (UC)-MSCs into the vitreous of mice and observed neuroprotective effects of the NSCs. Transplantation of NSCs has been proposed as a new treatment strategy for neurodegeneration in DR.
Leukemia inhibitory factor (LIF) is a secretory cytokine that has important roles in numerous biological processes that include differentiation, inflammatory response, neural development, embryo transfer, stem cell self-renewal, and tumor progression[5]. Yanget al[6]found that LIF can protect vasculature integrity in the early stage of DR and prevent retinal damage in models of diabetes induced by the injection of streptozotocin (STZ).In vitrostudies by Kubotaet al[7]revealed increased microvessel density and upregulated expression of vascular endothelial growth factor (VEGF) in various tissues outside the retina ofLIF(-/-)mice. Tissues communicate with the angiogenesis system. Adequate angiogenesis involves the use of LIF and oxygen, suggesting a novel strategy for anti-angiogenic therapy in relevant diseases,such as DR.
Adiponectin (APN) is an adipose tissue-secreted cytokine with obvious anti-diabetic, anti-inflammatory, and antiatherosclerosis effects, and it also regulates endothelial function[8]. APN is important in the occurrence and progression of type 2 diabetes by decreasing insulin resistance, improving pancreatic β-cell dysfunction, and increasing fatty acid β-oxidation[9]. APN is protective against vascular injury[10]and can modulate VEGF and pigment epithelium-derived factor(PEDF) in ocular neovascularization. Exposure of human retinal pigment epithelial cells to APN leads to decreased expression of VEGF mRNA but increased expression of PEDF mRNA and protein[11].The anti-inflammatory activity of APN can counteract the related pro-inflammatory activity of tumor necrosis factor-alpha (TNF-α) and thus protect the vascular system[12]. APN can reduce the activation of pro-inflammatory cytokines and inhibit the VEGF-induced migration of endothelial cells[13].
Early retinal damage relates to the level of inflammatory marker high-sensitivity C-reactive protein (hs-CRP)[14].Elevated levels of hs-CRP are closely associated with the increased risk of diabetes and thus can be used to identify the progression of diabetes[15]. Neurotrophic factors promote survival of endothelial cells, prevent loss of pericytes, and avoid formation of retinal capillary occlusion in diabetic patients. Neuronal apoptosis in the retina of diabetic rats and in retinal tissue cultured with elevated glucose is significantly improved after treatment with neurotrophin-4 (NT-4),indicating that NT-4 can inhibit retinal neuronal apoptosis in diabetic rats[16]. Neuroprotective therapy studies have shown that NT-4 has regenerative effects on damaged retinal ganglion cells (RGCs) and inhibits the progression of RGC loss and axonal degeneration[17-18].
Based on this collective knowledge, this study explored the effects ofLIFgene-transfected human UCMSCs (LIFhUCMSCs) on the expression of the hs-CRP, NT-4, and APN cytokines in a rat model of DR. The goal was to harness the multiple modulatory roles of hUCMSCs and LIF in immunomodulation and nerve repair, to provide better treatment for early DR.
MATERIALS AND METHODS
Ethical Approval This study was approved by Ethics Committee of Tianjin Medical University and adherence to the ARVO Statement for the Use of Animals in Ophthalmic and Vision Research.
Generation of Recombinant Lentiviral Vectors Restriction enzyme cleavage sites were introduced to the forward and reverse primers ofLIF-S-EcoRI: 5’-ACCGGAATTCATG AAGGTCTTGGCGGCAGGAG-3’ andLIF-AS-BamHI:5’-ACGCGGATCCGAAGGCCTGGGCCAACACGGC-3’,respectively. TheLIFgene was amplified from the cDNA template using polymerase chain reaction (PCR). The gene was incorporated into a human immunodeficiency virusbased lentiviral vector. TheLIFregion was then excised from the vector and transferred to the lentiviral overexpression plasmid. FourLIFgene recombinant plasmids (pCDH1-MCS1-EF1-copGFP/LIF, pSRL-PACK-GAG, pSRL-PACKREV, and pSRL-VSV-G) obtained from Tianjin Saierbio(China) were purified and co-transfected into 293T cells for 6h. The culture medium was replaced by complete medium and cultivation was continued for 48h. The cell supernatant rich in lentiviral particles were collected and centrifuged to concentrate the virus. The virus titer was determined, and the green fluorescence protein (GFP) expression status ofvirus-transfected 293T cells was determined and recorded photographically.
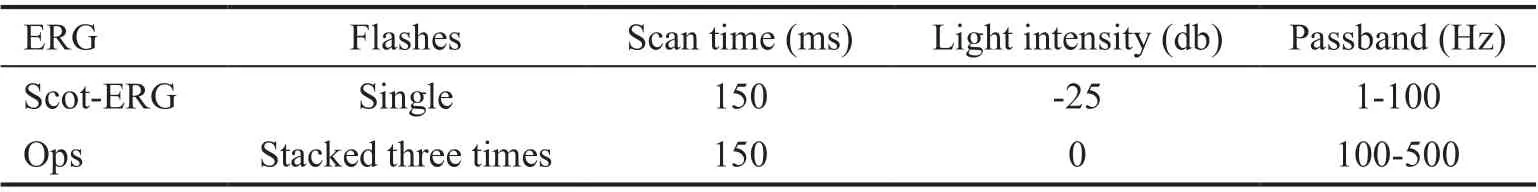
Table 1 ERG stimulation parameter settings
Transfection of hUCMSCs hUCMSCs in good growth condition were inoculated at a density of 2×10⁵cells/well in a 6-well plate. The plate was incubated in a 5% CO2incubator at 37℃ for approximately 24h to ensure that transfected cells had grown to 60% to 70% confluence. Then, a volume of virus corresponding to the desired multiplicity of infection was added. Polybrene was added (2 μg/mL) to each well to increase the transfection efficiency. The medium was replaced every 6h during culture. After 48h, the cells were subcultured at a ratio of 1:5. After 72h, a stable cell line was selected and cultured after limiting dilution. Stable transfected cell clones were obtained when the number of cells began to increase. The efficiency of overexpression was determined by quantitative polymerase chain reaction (qPCR), and cell proliferation in each group of rats was detected using the 3-(4,5-dimethylthiazol-2-yl)-2,5-diphenyltetrazolium bromide(MTT) assay as described subsequently.
Construction of Rat Model of Diabetic Retinopathy and Groups Of the 80 Sprague-Dawley rats available, 60 were randomly selected and fed adaptively for 3d. STZ (Shanghai Yuanye Bio-Technology, China) was dissolved at a dose of 0.1 mol/L in citrate buffer (pH 4.0) and was intraperitoneally injected once into each rat at a dose of 60 mg/kg (equivalent to 1 mL/100 g) to construct a rat model of DR. The remaining 20 rats were injected with an equal volume of citrate buffer.Three days after the injections, tail venous blood samples were collected to test the glucose levels. A level ≥16.7 mmol/L indicated successful establishment of a diabetic model. Of the 20 bufferinjected rats, 17 were selected as the normal control group(group A). Forty-five of the diabetic rats were allocated to three groups (n=15 per group): diabetic control group (group B),subsequent injection with empty vector-transfected hUCMSCs(group C), and subsequent injection withLIF-hUCMSCs(group D). Three months later, three rats from each group were anesthetized and humanely sacrificed by an overdose injection of 1% pentobarbital sodium. Death was followed by immediate removal of the eyeballs, circular incision of the cornea along the limbus, and fixation of the eyeballs for 24h in 40 g/L paraformaldehyde. Tissues were embedded in paraffin,sectioned, stained with hematoxylin and eosin (HE), and observed and photographed during microscopy examinations.In other rats, after confirming the development of DR in the rats of groups C and D, a micro-syringe was used to deliver a monocular intravitreal injection of 2 µL of empty vectortransfected hUCMSCs (group C) or 2 µL ofLIF-hUCMSCs(group D), both at a concentration of 1×10⁶cells/μL. Rats that developed vitreous hemorrhage or retinal detachment during the injection were excluded from subsequent investigation,which was conducted 4wk after the start of the intervention.
Flash Electroretinogram Assessment of Retinal Function of Dark-adapted Rats The rats were allowed to adapt to dim red light for 30min prior to being anesthetized by an intraperitoneal injection of 1% sodium pentobarbital at a dose of 30 mL/kg. The rat pupils were dilated for 10min by dropwise addition of compound tropicamide eye drops,followed by dropwise addition of proparacaine hydrochloride eye drops for surface anesthesia. The cornea was protected using 1% methylcellulose gel and the medial canthus skin was disinfected using 75% alcohol. A recording electrode was placed on the cornea of each eye. The other end of the electrode was connected to a plug connector. A homemade reference electrode was placed subcutaneously just posterior to the left and right medial canthus, and a ground electrode was inserted in the tail. Electroretinography (ERG) scans were recorded using a multifunctional electrophysiology system(Roland Consult, Germany) and Retisystem 2.26 software.During the dark adaptation examination, the amplitude of rod cell response (a wave), bipolar cell response (b wave), and oscillatory potentials (OPs) in the rat retina were recorded(Table 1).
Fluorescein Isothiocyanate-dextran Perfusion of Retinal Flat Mounts Fifty milligrams of fluorescein isothiocyanate(FITC)-dextran (molecular weight 2 000 000 Da; Sigma-Aldrich, USA) were fully dissolved in 1 mL phosphate buffer saline (PBS) to give a concentration of 50 mg/mL. In each group, three rats were randomly selected and anesthetized by an intraperitoneal injection of 1% pentobarbital sodium at a dose of 30 mL/kg with the limbs and head maintained stationary. The chest cavity was immediately opened using an ophthalmic surgical scissor to expose the heart. One milliliter of FITC-dextran was rapidly injected into the left apex of the heart for ventricular perfusion using a scalp needle.As soon as the mouth, ears, nose, and other parts of the rat turned green-yellow, indicating the success of perfusion, the eyeballs were immediately removed and fixed for 3h in 4%paraformaldehyde. Under ophthalmic surgical microscopy guidance, the retina was separated, removed, radially cut from the optic disc, and spread on a glass slide. The slide was sealed by a few drops of glycerol and covered with a cover slide. Fluorescence microscopy was performed at an excitation wavelength of 490 nm and an emission wavelength of 520 nm(OLYMPUS, Japan). Tortuous and irregularly expanded blood vessels were observed in the retina, with a large number of microaneurysms and venous beading. Capillary occlusion occurred in the peripheral retina, with large areas of nonperfusion and hyperfluorescent leakage.
HE Staining of Retinal Layers and Immunohistochemistry Detection of APN, hs-CRP, and NT-4 Rats were sacrificed by overdose inhalation anesthesia. The eyeballs were quickly removed. After the corneas were incised along the limbus,the eyeballs were fixed with 4% neutral formaldehyde overnight. After paraffin embedding, the whole eyeballs were continuously sectioned in the sagittal plane, with each section measuring 4 µm in thickness. One section every 60 μm (every 15 sections) was placed on a glass slide for HE staining,followed by optical microscopy observation of the retinal blood vessel morphology and retinal layer structures. The tissue slides were deparaffinized in xylene, hydrated in a gradient of ethanol (100%, 95%, 85%, 70%, 50%), deactivated, and subjected to heat-induced antigen retrieval in boiled water. This was followed by the sequential dropwise addition of a blocking solution containing normal goat serum, an appropriate amount of diluted primary antibody (1:50) and incubation, and an appropriate amount of horseradish peroxidase (HRP)-labeled goat anti-rabbit secondary antibody. Color was developed using a 3,3’-diaminobenzidine (DAB) color development kit. The degree of color development was controlled through microscopy observation. Next, the tissue sections were subjected to hematoxylin counterstaining, hydrochloric acid alcohol differentiation, dehydration in a gradient of ethanol,and immersion in xylene. When sections became transparent,they were mounted using neutral gum, followed by microscopy observation and photographing. Results were interpreted by a semi-quantitative incorporating staining intensity scoring and positive-cell scoring. For staining intensity scoring, the scores were 3, 2, 1, and 0 for dark-brown staining, brown or golden-yellow staining, light-yellow staining, and no staining,respectively. For positive-cell scoring, positive expression areas with relatively uniform staining were selected to count and score positive cells in five high-power fields, with a score of 4 when positive cells accounted for >75%, 3 for 51%-75%,2 for 26%-50%, 1 for 5%-25%, and 0 for <5%. The final score was a sum of the two scores, with a score of 6-7 indicating a strong positive result (+++), 4-5 a positive result (++), 2-3 a weakly positive result (+), and 0-1 a negative result (-). All results were independently interpreted by two pathologists.In the case of scoring discrepancy, the two pathologists reobserved the results and reached a final decision by consensus.
qPCR Detection of Expression Levels of APN, hs-CRP,and NT-4 In each group, three rats were randomly selected and sacrificed by an overdose of anesthesia. The eyeballs were removed, followed by removal of retinas under ophthalmic microscopy guidance. Each retina was placed in a diethylpyrocarbonate (DEPC) water-treated, RNAasefree mortar, and ground to a very fine powder. Total RNA was extracted according to the instructions of the total RNA extraction kit. RNA purity was assessed using a NanoPhotometer spectrophotometer (Implen, Denmark).Whether RNA underwent degradation and contained impurities was tested using 1% agarose electrophoresis. The following forward and reverse primers were designed using Premier5.0 software: APN-S: 5’-CTCCTTTGCCAATCTCAT-3’,APN-AS: 5’-TAGGCTACCCTTTGTCCAG-3’, hs-C R P: 5’-T TA C G C TA C C A A G A C G A G-3’, h s-CRP: 5’-GGCTGAATACCCTACCAAC-3’, NT-4: 5’-A G G C C A A G C A G T C C TAT G T-3’, N T-4:5’-GGTCTCTCAGCATCCAGCT-3’, rat actin (Actb)-S:5’-TCAGGTCATCACTATCGGCAAT-3’, rat actin (Actb)-AS: 5’-AAAGAAAGGGTGTAAAACGCA-3’. Reverse transcription (RT)-PCR was performed to synthesize a cDNA template, and qPCR was performed to amplify APN, hs-CRP,NT-4, and tubulin (an internal reference). The qPCR reaction system (20 μL total) consisted of 10.0 μL of 2× SYBR Premix Ex Taq, 0.8 μL of PCR forward primer (10 μmol/L), 0.8 μL PCR reverse primer (10 μmol/L), 0.4 μL ROX reference Dye(50×), 2.0 μL RT reaction solution, and 6.0 μL sterile doubledistilled water. The qPCR program was 94℃ for 4min,followed by 40 cycles of 94℃ for 30s, 58℃ for 30s, and 72℃for 30s. qPCR results were analyzed as follows and presented as histograms: Folds=2–ΔΔCtand ΔΔCt=(Ct1-Ct2)-(Ct3-Ct4).Ct1 denoted the critical number of cycles for the target gene(APN/hs-CRP/NT-4) in the sample of a model rat. Ct2 denoted the critical number of cycles for the housekeeping gene (Actb)of the model sample. Ct3 denoted the critical number of cycles for the target gene (APN/hs-CRP/NT-4) in the sample of a control rat. Ct4 denoted the critical number of cycles for the housekeeping gene (Actb) of the control sample.

Figure 1 Images of the stably transfected cell line and MTT detection results (40×) A: Control group (bright field); B: Control group(fluorescence field); C: Model group (bright field); D: Model group (fluorescence field); E: MTT detection results.
Western Blotting Detection of the Expression Levels of APN, hs-CRP, and NT-4 Proteins Ground retinal tissues were prepared as described above. Approximately 40 mg of each tissue sample was lysed by mixing with 200 μL phenylmethylsulfonyl fluoride, shaken thoroughly, and incubated on ice for 20min, followed by centrifugation at 12 000 rpm for 5min. The supernatant was collected and stored at -80℃ for later use. Protein samples were mixed with 5×loading buffer containing β-mercaptoethanol and boiled for 5min to ensure full denaturation, followed by centrifugation.The supernatant was collected. Protein samples (25 μL)were loaded for SDS-PAGE at 60 V for 30min and then at 90 V for 90min. The resolved proteins were transferred to polyvinylidene fluoride membranes that were blocked using skimmed milk powder at room temperature (about 25℃)on a horizontal shaker for 1h. The membranes were placed in Blotto (Tianjin Saierbio) containing a 1:1000 dilution of primary antibody (rabbit anti-APN/hs-CRP/NT-4 antibody or rabbit anti-β-tubulin antibody) and incubated overnight at 4℃.After washing the membranes with membrane wash buffer,a 1:5000 dilution of secondary antibody (rabbit anti-rat IgG H&L, Abcam, USA) was added to Blotto, followed by 1.5-2h of incubation at room temperature. After the membranes were washed again with membrane wash buffer, they were immersed for 30s in a mixture made by proportionally diluting solution A and solution B of an enhanced chemiluminescence kit. After light exposure, the film was developed and fixed, washed with water, and dried. The film was photographed using the LabWorks gel imaging and analysis system (JiangSuJieDa,CHINA). The greyscale values of bands in the image were analyzed for each group.
ELISA Detection of the Expression Levels of APN, hs-CRP, and NT-4 Protein samples were acquired as described above from the lysis supernatant. The expression levels of APN, hs-CRP, and NT-4 in the protein lysate were determined by ELISA. The mass concentration of the three proteins in samples was calculated using the calibration curves of optical density versus mass concentration of reference materials.
Statistical analysis Data analysis was performed using SPSS 20.0 software (IBM, USA). Measurement data are expressed as mean±standard deviation (SD). Comparison of data between two and three groups was performed using two independent samplet-test or one-way analysis of variance, respectively.The SNK-Qtest was a post hoc test for pairwise comparison.Significance level was set atP<0.05.
RESULTS
Diabetic Retinopathy Rat Model Establishment Before construction of the rat model, the 80 rats had a mean blood glucose level of 4.75±0.83 mmol/L. Seventy-two hours after intraperitoneal injection of STZ into 60 rats, 51 exhibited tail venous blood glucose levels >16.7 mmol/L, indicative of the successful establishment of diabetes. Of the 60 rats, nine rats whose venous blood glucose levels were below the standards for diabetes were subjected to a second round of STZ injection. Seventy-two hours later, their blood glucose levels exceeded 16.7 mmol/L. Thus, all 60 rats developed diabetes,representing a 100% success rate of modeling. Blood glucose did not recover in any of the diabetic model rats during the experiment. Twenty-eight of the diabetic model rats received an intravitreal injection of empty vector-transfected hUCMSCs(group C,n=14) orLIF-hUCMSCs (group D,n=14). Two rats developed vitreous hemorrhage but no endophthalmitis after the injection. The two rats received a second injection. The 28 rats were ultimately included in the two groups for subsequent analyses.
Virus Titers and Construction of a Stably TransfectedLIFhUCMSCs
Microscopy analysis Fluorescence microscopy was used to enumerate cells in five random fields of view in the bright field and GFP channels to determine the proportion of GFPexpressing cells. Based on this, the lentivirus titer was calculated to be 1.92×10¹⁰[transduction units (TU)/L]. The growth and proliferation rate (%) of the negative control group and theLIF-overexpressing group was 22.71±2.23 and 25.59±1.03, respectively, with no statistically significant difference (P>0.05; Figure 1).
qPCR verification of LIF overexpression As shown in Figure 2, theLIF-overexpressing group was significantly different from the negative control group in terms of relative mRNA level (P<0.01).
Hematoxylin and Eosin Results of Rat Retina The control group displayed an intact retinal structure and normal cellular morphology, with an intact and visible internal limiting membrane (ILM) and a tightly arranged nerve fiber layer(NFL). Ganglion cells (GCs) were distributed in a singlelayered, elliptical manner. The inner plexiform layer (IPL)was thick and dense, in contrast to the thin outer plexiform layer (OPL). Both the inner nuclear layer (INL) and the outer nuclear layer (ONL) had an intact cellular structure with a tight arrangement. In contrast, diabetic model rats developed obvious DR, which manifests as an incomplete ILM structure,NFL edema, reduced number of GCs, loose IPL structure,unclear OPL boundary, unclear boundary between the INL and ONL, and sparse cells in a disordered arrangement. Four weeks after the intravitreal injection of hUCMSCs, group C exhibited an incomplete ILM structure, NFL edema alleviation, slight increase in the number of GCs, IPL edema alleviation, unclear OPL structure, and uniform and regular cellular arrangement in the IPL and INL. Group D exhibited an intact structure in each retinal layer, which was characterized by a smooth ILM,absence of NFL edema, significantly higher number of GCs,significant alleviation of IPL edema, regular OPL structure,and tight cellular arrangement in the IPL and ONL with clear boundaries (Figure 3).

Figure 2 LIF overexpression in PCR results aP<0.01.
Immunohistochemistry revealed a significantly higher APN level in groups B, C, and D than in group A (P<0.05). Further,group B had significantly higher hs-CRP and NT-4 levels than group A (P<0.05). Group D had a significantly lower hs-CRP level than group B, while groups C and D had a significantly higher NT-4 level than group B (P<0.05; Figure 4).
F-ERG Assessment of Retinal Function in Each Group of Dark-Adapted Rats After 4wk of intervention, group A displayed significant differences in the amplitudes of rod ERG a-wave and b-wave, as well as in the total OP amplitude compared with groups B, C, and D (P<0.01). Groups C and D displayed significantly higher amplitudes of rod ERG a-wave and b-wave groups, as well as a significantly higher total OP amplitude than group B (P<0.01). Group D was significantly higher than group C concerning these parameters (P<0.01;Figure 5).
Fluorescence Images of FITC-Dextran-Perfused Retinal Flat Mounts and HE Staining As shown in Figure 6, group A exhibited well-filled retinal blood vessels, with a normal morphology, regular arrangement, and clear vascular wall structure, but without leakage. In group B, the retinal blood vessels were non-uniform in thickness with segmental vascular dilation, an unclear vascular wall structure, and fluorescent leakage. In group C, the vessels were still non-uniform in thickness, but the dilation of retinal blood vessels was alleviated, vessel arrangement was improved, and fluorescent leakage was reduced. In group D, the thickness uniformity of retinal blood vessels was significantly improved and there was no obvious vascular dilation and leakage, with a clear vascular wall structure.

Figure 3 HE results of rat retina (200×).
Expression of APN, hs-CRP, and NT-4 Detection by qPCR As shown in Figure 7, group A significantly differed from groups B, C, and D with respect to the relative expression level of APN, hs-CRP, and NT-4 (P<0.05). Groups D and C exhibited significantly upregulated expression of APN and NT-4 compared with group B, but significantly downregulated expression of hs-CRP (P<0.05). Compared with group C, the expression of APN and NT-4 was significantly upregulated in group D while the expression of hs-CRP was significantly downregulated (P<0.05).
Expression of APN, hs-CRP, and NT-4 Detection by Western Blotting As shown in Figure 8, group A significantly differed from groups B, C, and D with respect to the protein expression level of APN, hs-CRP, and NT-4 (P<0.05). Groups C and D exhibited significantly upregulated expression of APN and NT-4 compared with group B, but significantly downregulated expression of hs-CRP (P<0.05). Compared with group C, the expression of APN and NT-4 was significantly upregulated in group D while the expression of hs-CRP was significantly downregulated (P<0.05).
Expression of APN, hs-CRP, and NT-4 Detection by ELISA As shown in Figure 9, group A was significantly different from groups B, C, and D in the level of APN, NT-4, and hs-CRP(P<0.05). Groups C and D exhibited significantly upregulated expression of NT-4 and APN but significantly downregulated expression of hs-CRP compared with group B (P<0.05).Compared with group C, the expression of APN and NT-4 was significantly upregulated in group D while the expression of hs-CRP was significantly downregulated (P<0.05).

Figure 4 Immunohistochemical results.

Figure 5 Impacts of hUCMSCs treatment on the latencies and amplitudes of F-ERG a-wave and b-wave in diabetic rats.
DISCUSSION
This study aimed to evaluate the changes in the levels of immunologic inflammation and neurotrophic biomarkers in STZ-diabetic rats after intravitreal injection ofLIFhUCMSCs, as well as the effects of the injection on the retinal structure and function in DR rats.LIFhas important effects on the differentiation, apoptosis, and proliferation of hUCMSCs and can maintain the proliferative capacity of embryonic stem cells and other types of stem cells by inhibiting their differentiation[5,19]. In addition, LIF inhibits cell apoptosis, which induces the proliferation of hUCMSCs[20].Chieregatoet al[21]reported that LIF promoted the expression of proliferating cell nuclear antigen in adipose-derived MSCs.Salehniaet al[22]reported that LIF promoted the proliferation and pluripotent gene expression of endometrial MSCs. LIF can maintain hUCMSCs in an undifferentiated statein vitrowhile promoting the proliferation of the cells, which is beneficial for culture condition optimization in cell transplantation therapy.
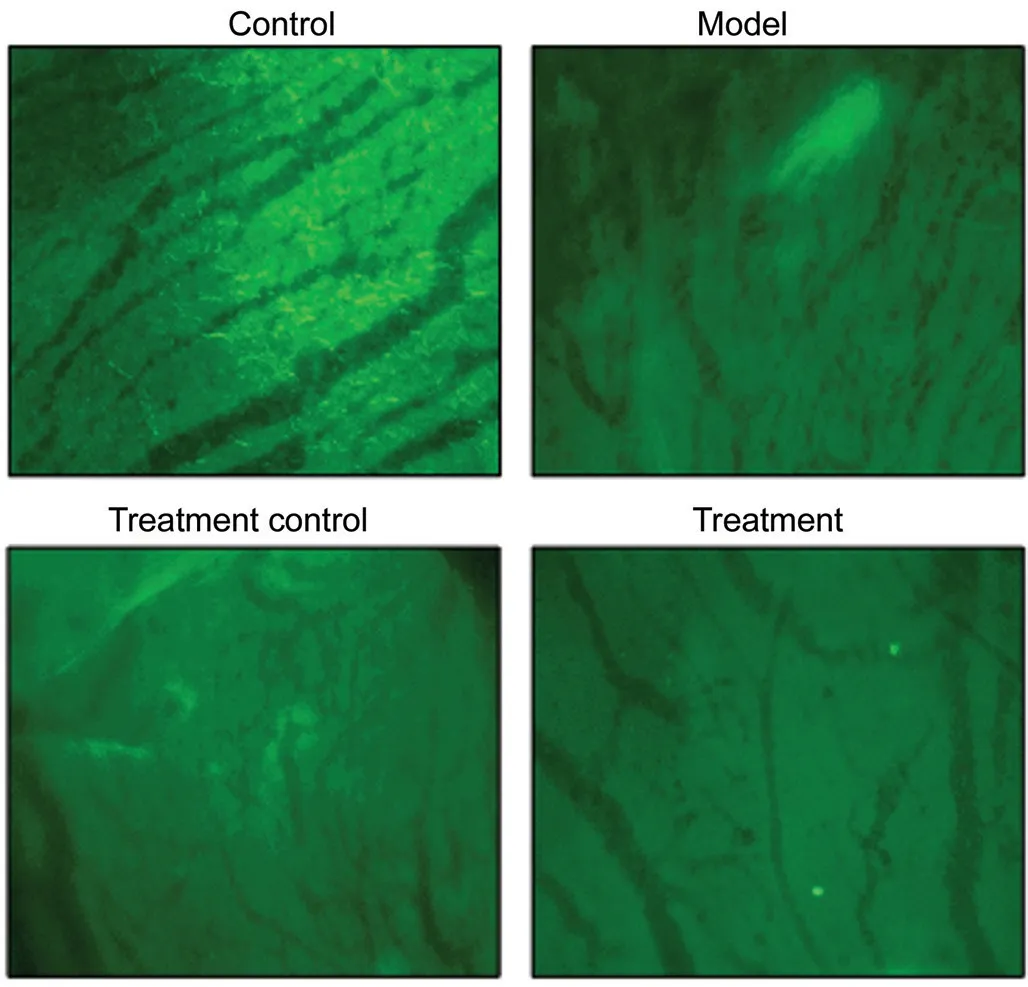
Figure 6 Fluoresce images of FITC-dextran-perfused retinal flat mounts (200×).

Figure 7 Expression of APN, hs-CRP, and NT-4 detection by PCR.

Figure 8 Expression of APN, hs-CRP, and NT-4 Detection by Western blotting.

Figure 9 Expression of APN, hs-CRP, and NT-4 Detection by ELISA.
Given this background, this study transfected hUCMSCs with a LIF-overexpressing lentiviral vector and constructed a stably transfected cell line ofLIF-hUCMSCs.
Immune mechanisms are involved in the pathogenesis of DR[23]. APN plays an important role in the occurrence and progression of type 2 diabetes by decreasing insulin resistance,improving pancreatic β-cell dysfunction, and increasing fatty acid β-oxidation[24]. APN can modulate the effects of VEGF and PEDF on ocular neovascularization. Exposure of human retinal pigment epithelial cells to APN reduces the expression of VEGF mRNA while increasing the expression of PEDF protein and PEDF mRNA[11]. Moreover, APN has antiinflammatory activity and counteract the pro-inflammatory effects of TNF-α, which is protective for the vascular system[25]. Therefore, increased expression of APN in diabetes may represent an alleviation of vascular and endothelial damage and a reduction in inflammation. In addition, APN can reduce the activation of pro-inflammatory cytokines and inhibit the VEGF-induced migration of endothelial cells[26]. Presently,the APN level was significantly higher in the diabetic model group than in the control group, consistent with the prior findings. The APN level was significantly higher in the group injected withLIF-hUCMSCs than in the group injected with empty vector-transfected hUCMSCs, with both groups having a significantly higher APN level than the control group as shown by the PCR and Western blot. These findings suggest that hUCMSCs, especiallyLIF-hUCMSCs, can increase the expression of APN in the retina so that the APN can exert an anti-inflammatory effect to improve the retinal function of diabetic rats.
Early retinal damage relates to the level of the inflammatory marker hs-CRP[27]. Elevated levels of hs-CRP are closely associated with the increased risk of diabetes and thus can be used to identify the progression of diabetes[28]. Jonaset al[29]observed a significant correlation between the increase in serum levels of hs-CRP and the increased incidence of DR in a Chinese population >50y of age. Jiaet al[30]reported that the serum ischemia modified albumin and hs-CRP concentration were significantly high in DR patients, and were positively associated with the seriousness of DR, which may contribute to the development of DR. The present study observed higher levels of hs-CRP in the model groups than in the control group, consistent with the prior results. Caiet al[31]co-cultured adipose-derived MSCs and cardiomyocytes, and injected them into myocardial infarction model rats, which led to decreased hs-CPR levels. Guet al[32]intravenously infused DR patients with autologous bone marrow stem cells,which led to significantly decreased CRP levels. The present results indicated that hUCMSCs, especiallyLIF-hUCMSCs,downregulated the level of hs-CPR and improved the retinal structure and function of diabetic rats.
Neurotrophic factors promote the survival of endothelial cells, prevent loss of pericytes, and avoid formation of retinal capillary occlusion in patients with diabetes, serving as an essential type of cytokines for retinal differentiation and growth. Neuronal apoptosis in the retina of diabetic rats and retinal tissue cultured in the presence of elevated glucose is significantly more severe than that in the normal retina, but it is significantly improved after NT-4 intervention, indicating that NT-4 can inhibit retinal neuronal apoptosis in diabetic rats[16]. A study by Bosset al[33]described relatively high intravitreal levels of inflammatory cytokines and NT in DR patients. Presently, the NT-4 levels in the model groups were significantly higher than the levels in the control groups,consistent with the prior findings. Guoet al[34]reported that injection of UCMSCs into acute radiation-damagedTupaia belangerisignificantly increased the survival rate and led to higher serum levels of inflammatory factors and NT-4. The present results also indicated that hUCMSCs, especiallyLIFhUCMSCs, can increase the expression of NT-4, thereby nourishing the neural retina and improving DR disease.
In summary, regulation of APN, NT-4, and hs-CRP is vital to the treatment of DR. The present results showed that an intravitreal injection of hUCMSCs, especiallyLIF-hUCMSCs, increased the levels of APN and NT-4 and reduced the production of hs-CRP. These findings suggest that hUCMSCs can improve retinal function in diabetic rats through immunomodulation and neurotrophic effects. The improvement is more obvious forLIF-hUCMSCs. These findings are supported by analysis of F-ERG responses and imaging of FITC-dextran-perfused retinal flat mounts.
The present study is the first to transplantLIF-hUCMSCs into the vitreous chamber of DR rats. The findings confirm that intravitreal transplantation ofLIF-hUCMSCs can alleviate DR lesions, providing novel theoretical support for the early treatment of DR.
However, the present study has limitations. Hsuet al[35]reported that APN and its receptors are expressed in retinal vascular endothelial cells (RVECs), GCs, and the INL, with receptor AdipoRl strongly expressed in RVECs and receptor AdipoR2 being weakly expressed. Therefore, the pathway and effect of APN may be subject to its molecular form, relative number of receptors, and the target tissue. The present study detected APN levels only in the entire retina, while failing to accurately detect APN levels in various retinal layers and tissues. Thus, further research is needed. Blumet al[36]described that type 2 diabetic patients without retinopathy or with non-proliferative retinopathy had high levels of inflammatory and angiogenic markers, which were decreased in patients with diabetic proliferative retinopathy. However,precise staging of the lesions was impossible in the present study due to the diabetic animal model. This issue remains to be addressed in further research. The present study also failed to conduct a dynamic monitoring of the biomarkers in question due to the small sample size. Therefore, more studies are needed to better assess the risks associated with such research,including the risk of stem cell applications and the risk of tumor formation.
ACKNOWLEDGEMENTS
Foundation:Supported by Tianjin Science and Technology Project (No.14JCYBJC27400).
Conflicts of Interest:Chen SN, None; Xu ZG, None; Ma YX, None; Chen S, None; He GH, None; Han M, None; Gao X, None; Wang JH, None; Wu B, None; Wang J, None.
 International Journal of Ophthalmology2021年10期
- International Journal of Ophthalmology的其它文章
- lmpact of intraocular pressure fluctuations on progression of normal tension glaucoma
- Effective treatment for secondary angle-closure glaucoma caused by traumatic lens subluxation:phacoemulsification with capsular-tension-ring implantation combined with ophthalmic endoscopecontrolled goniosynechialysis
- Efficacy and safety of newly developed preservativefree latanoprost 0.005% eye drops versus preserved latanoprost 0.005% in open angle glaucoma and ocular hypertension: 12-week results of a randomized,multicenter, controlled phase III trial
- Progressive restrictive strabismus in an infant
- Association of peripheral anterior synechia, intraocular pressure, and glaucomatous optic neuropathy in primary angle-closure diseases
- Therapeutic effect of a traditional Chinese medicine formulation on experimental choroidal neovascularization in mouse