Geochemistry and provenance of the lower-middle pliocene cheleken formation,Iran
Houshang Mehrabi·Seyed Mohammad Zamanzadeh·Abdolhossein Amini·Vahid Tavakoli·Freshteh Sajjadi·Seyede Sepideh Mirrabie·Behzad Soltani
Abstract In the present study,the Lower-Middle Pliocene Cheleken Formation in the south of Ghaemshahr city was studied to determine the provenance of the comprising sediments,paleoclimatic conditions,and tectonic setting of the rocks.Petrographic and geochemical analyses of major and minor elements of the samples were used for this purpose.This Formation iscomposed of three major facies including conglomerate,f ine sandstone,and mudstone.The source formations which were recognized to be supplying sediments to the Cheleken Formation depositional basin include Lalun,Ziarat,Tizkuh,Dalichai,and Cretaceous formations.According to the discrimination diagrams and other ratios for minor elements of the studied samples,a complex of felsic to intermediate igneous rocks in the source region was deciphered.The depositional environment of the rocks experienced humid and semi-arid climatic conditions during deposition.According to the CIW index,the samples underwent a high level of weathering(97%)in the source area or during transportation.From a tectonic point of view,the Cheleken Formation was deposited in an Active Continental Margin setting.
Keywords Geochemistry·Provenance·Cheleken formation·Pliocene·Caspian sea
1 Introduction
One of the most important tasks in reconstructing the depositional history of a formation is to carry out a provenance study via which we can get a better image of the source region rock types and their evolution from climatic,environmental,and tectonic setting points of view(Cullers 1994,2002;Feng and Kerrich 1990;Floyd and Leveridge 1987;McLennan 2001).The Early-Middle Pliocene Cheleken Formation is a clastic-dominated succession that has some good outcropsin the Mazandaran province of Iran and it is one of the major hydrocarbon reservoirs in Azerbaijan,Kazakhstan,and Turkmenistan countries(Smith-Rouch 2006).In these countries,this formation is known as Productive Series or Chelekanian Formation(Smith-Rouch 2006).It was f irst studied by Sussli(1976)in Iran.This formation is composed of conglomeratic,sandstone,and mudstonebeds(Mehrabi2015;Mousavi-Rouhbakhsh 1999).Conglomeratic beds contain sandstone and carbonate gravels.For determining the formation from which the clastsare derived,we can usually study both sandstone and carbonate pebbles and larger gravels.In general,provenance studies are based on petrographic investigations(Cullers 2000)and also geochemical and petrographic characteristics of the source rocks(Pettijohn 1975).
Geochemical composition in clastic rocks is controlled by the following factors:composition of source rocks,the effect of environmental factors on source rock weathering(e.g.chemistry of the atmosphere,temperature,precipitation,and topography),duration of weathering,transportation mechanism of clastic grains from source to the site of deposition and depositional environment(e.g.diagenesis and metamorphism)(Ramos et al.2015;Dalmora et al.2016a,b).Previous research has conf irmed the effect of the above-mentioned factors on ancient and modern sediments(e.g.Dickinson et al.1983;Bhatia 1983;Roser and Korsch 1988;McLennan,1993;Spalletti et al.2008).Some research was focused on the determination of tectonic setting of provenance from geochemical signatures standpoint in siliciclastic rocks(Dickinson and Suczek 1979;Bhatia 1983;Bhatia and Crook 1986;Roser and Korsch 1986;McLennan and Taylor 1991).Among all siliciclastic rocks,silt and clay-sized grains(such as shaley and muddy beds)provide a better average composition of crust for provenance determination in siliciclastic rocks(McCulloch and Wasserburg 1978).In this research,both sandy and shaley facies of the Cheleken Formation are investigated from paleoclimatology and tectonic setting of their provenance viewpoints.This study is based on major and minor elements contents resulted from geochemical analysesof thesamples.Since Cheleken Formation isproved to beahydrocarbon reservoir rock in Azerbaijan,Kazakhstan,and Turkmenistan countries,understanding the provenance of this formation can be of great help for future operations and studies.Meanwhile,this formation is not comprehensively studied especially in Iran.It isworthy of note that no precise provenance study via using petrographic procedures and inorganic geochemistry data on provenance of Cheleken Formation has been carried out yet.Consequently,carrying out a provenance study(via petrographic and geochemical studies)is necessary.
2 Geological setting
The South Caspian hasbeen subsiding rapidly since at least 5 Ma ago and this subsidence is possibly associated with the highly thinned,oceanic crust under the South Caspian Basin(Allen et al.2003).The processes involved for the onset of the rapid Oligocene until recent times subsidence is still debated but several authors proposed a syn-compressional downward buckling of the basin resistant basement and/or the onset of the subduction below the Apsheron ridge(Allen et al.2003).The rapid subsidence of the South Caspian Sea started just after the Late Eocene-Early Oligocene compressional folding(and generally after Oligo-Miocene)that is responsible for the main uplift phase within the Kopet Dagh and the Alborz mountains(Allen et al.2003;Brunet et al.2003).Thestart of therapid subsidence phase was coincident with the onset of Alpine compression in the region.Sediment accumulation(with deposition of clay being dominant within the basin)occurred within the framework of strong crustal shortening.The orogen’s uplift surrounding the South Caspian Basin(i.e.,Caucasus,Great Caucasus,Talesh,Alborz,and Kopet Dagh),was led to the isolation of the South Caspian Basin(SCB).Their erosion provided an important source of sediment,f illing up the subsiding South Caspian Basin and the foreland basins of the belts.These were transported towards the rapidly subsiding SCB through three drainage systems:The Palaeo-Amu Darya from the east,the Palaeo-Kura from the west,and Palaeo-Volga from the north.
During Pliocene-Quaternary,rapid and abnormal subsidence took place in the southern Caspian Basin simultaneously with the uplift in Greater Caucasus,Kopeh Dagh,and Alborz mountains.Meanwhile,the uplift of severely eroded orogensresulted in the production of alarge volume of sediments.These sediments moved towards southern Caspian causing the development of a high-quality petroleum system during the abnormal subsidence phase(Brunet et al.2003).
Para-Tethys started to close in the Late Eocene.At the same time,two marine basins(i.e.Mediterranean Sea and Eurasian sedimentary basin)developed in thewest of Para-Tethys resulting in hydrocarbon province development(Rogel 1998,1999).In the f irst stage of the middlephase of Alpine orogeny in the north of Alborz in Lower Miocene,Para-Tethys isolated from Tethys,and due to Alborz compressional movements in Paleocene,the tectonic regime of Khazar and Talesh faults changed from normal to revers that caused the uplift of Talesh and Alborz mountains(Smith-Rouch 2006).
The next stage of folding occurred between Pliocene(Cheleken)and Miocene sediments and caused the development of slender anticlines and synclines with E-W orientation in Neogene.The succeeding phase of folding caused the development of the Mazandaran fault in Cheleken conglomeratic sediments and subsidence of the Caspian basin.
The orogens around Caspian Basin include Greater Caucasus,Kopeh Dagh,Alborz,and Greater Balkhan.Among all,Alborz is the most important orogenic belt in the area(Smith-Rouch 2006).Alborz Mountain is situated in the southern margin of the Caspian Sea and is resulted from two orogenic phases.The Alborz range uplifted in Oligo-Miocene and its f inal uplift happened during Pliocene to Quaternary(Brunet et al.2003).Based on the Iranian structural-sedimentary divisions,the study area is located in the Alborz zone,Mazandaran Province,Northern Iran.
All the formations which could shed sediments to form the Cheleken Formation and considered as the possible sources of Cheleken Formation are summarized in Table 1 based on their location,age,and lithology.
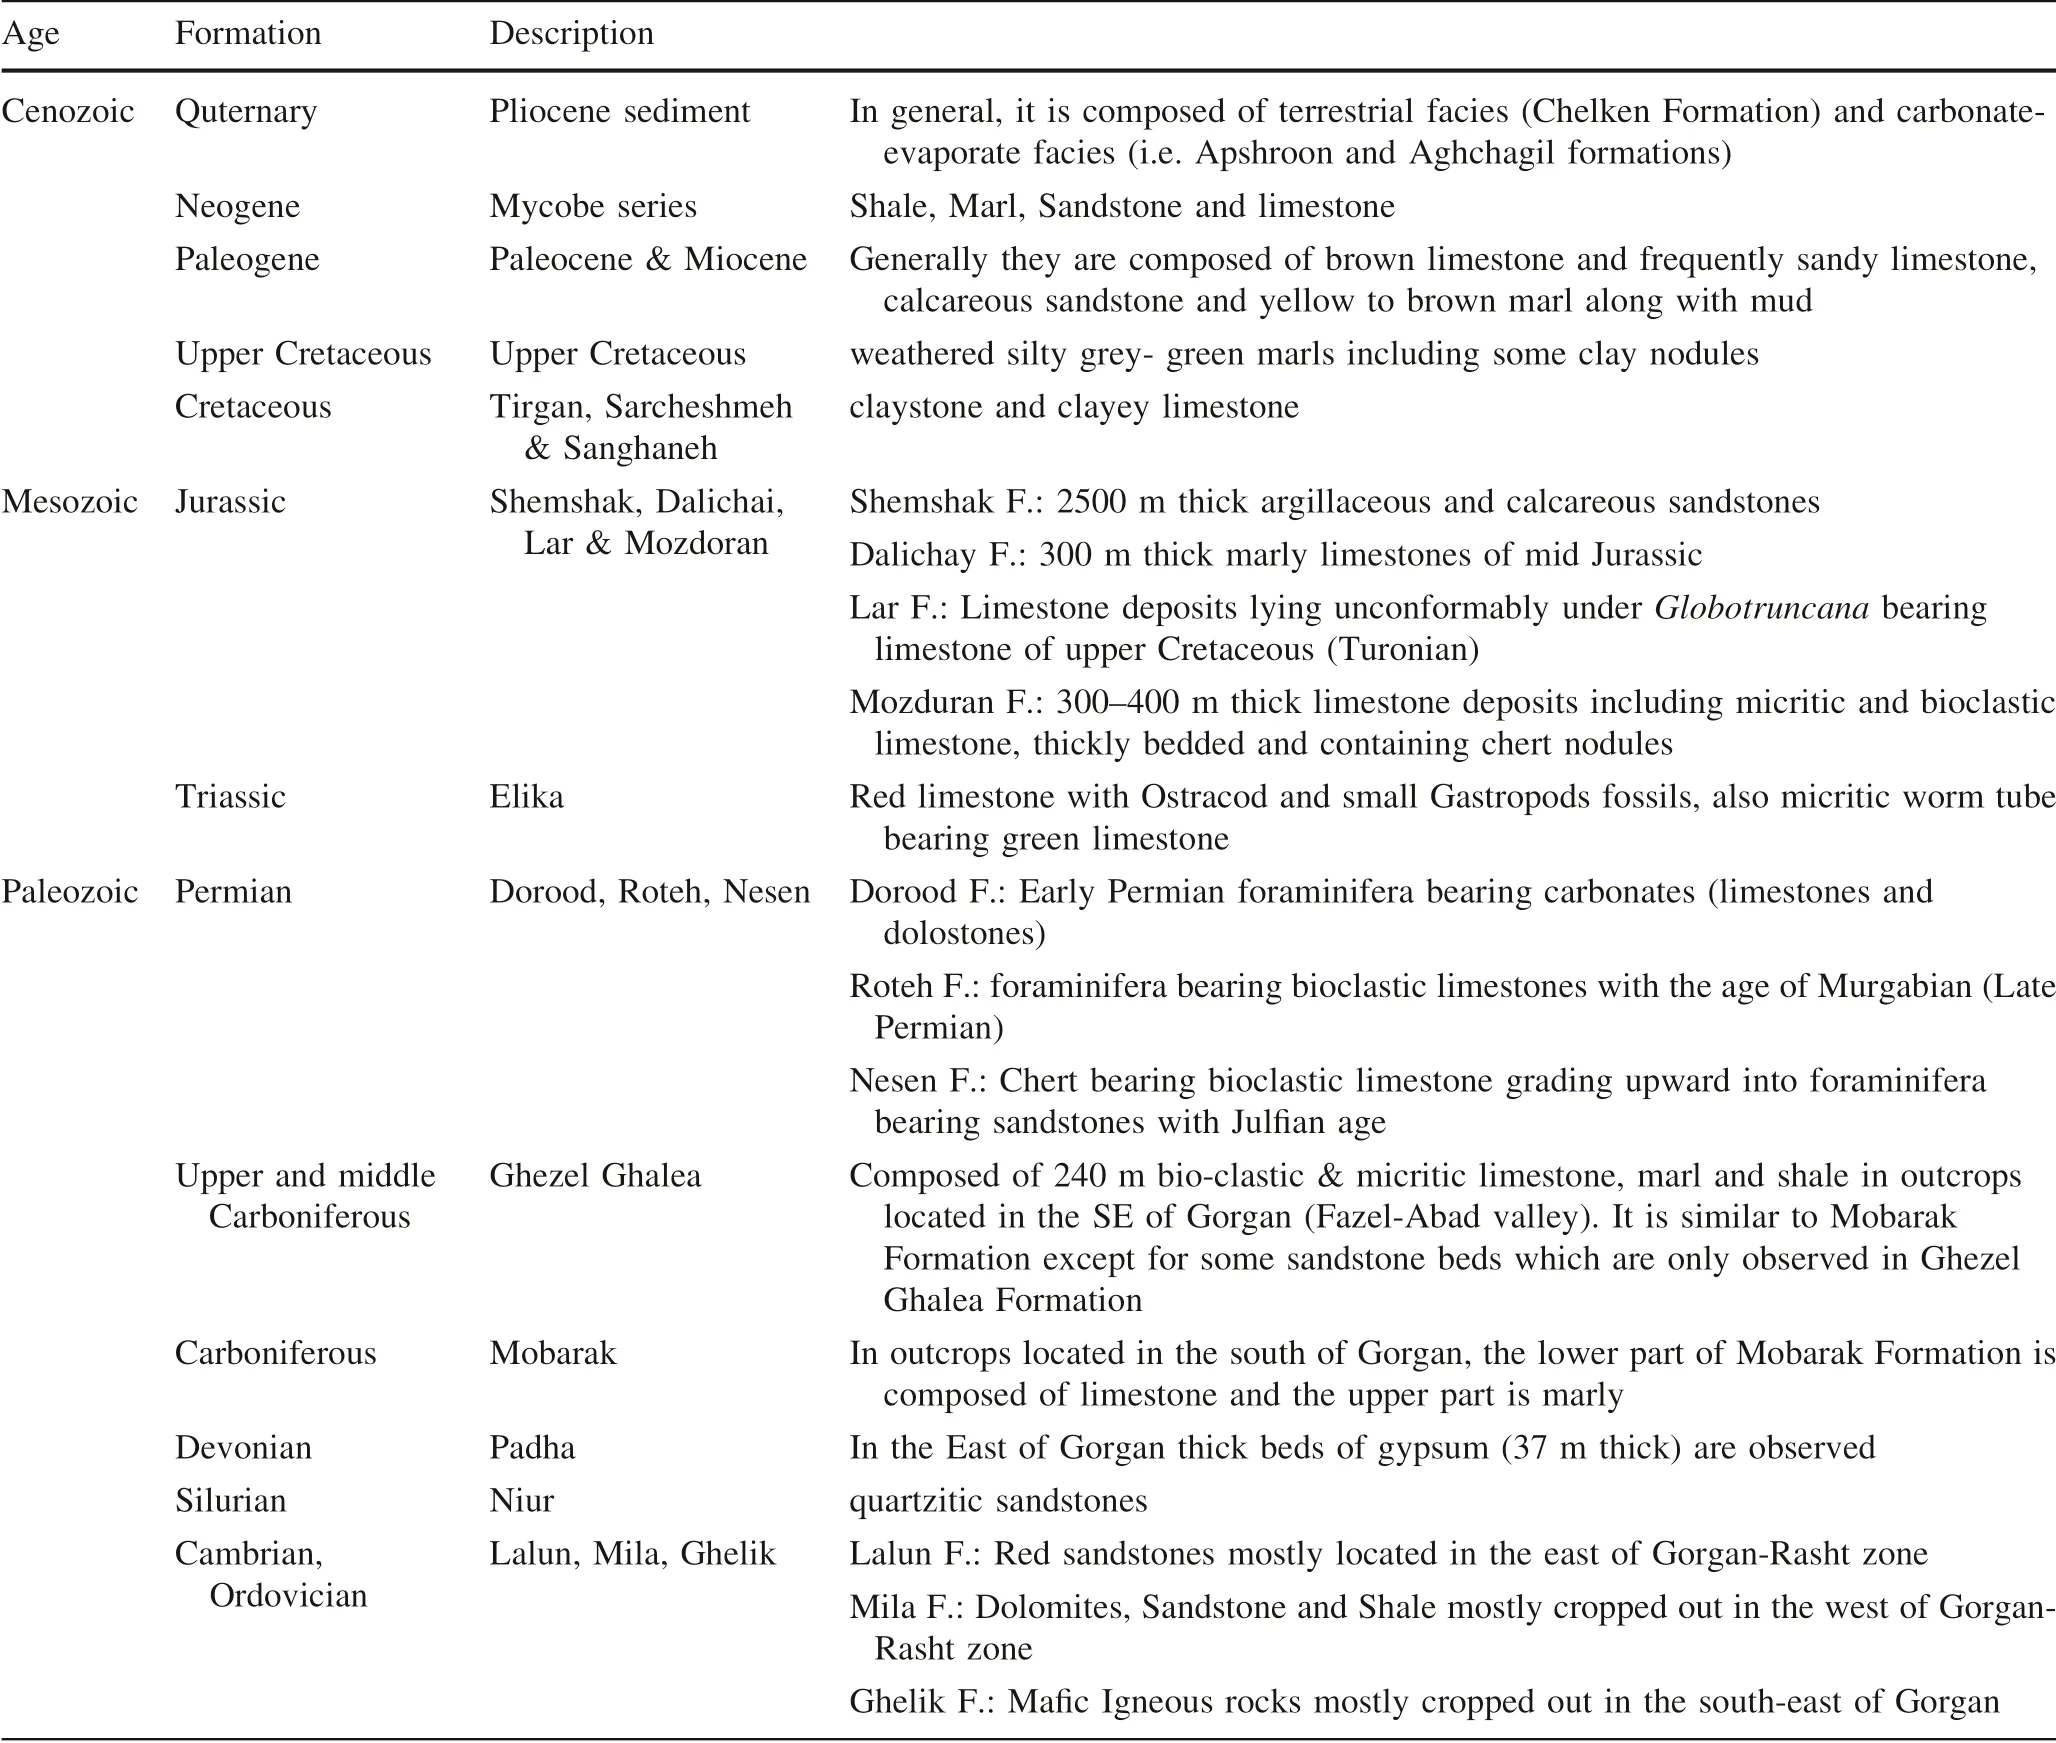
Table 1 The main stratigraphic unit from the Cambrian to Neogene in the Central Alborz Zone and their geological description(according to Mousavi-Rouhbakhsh 1999;Fotouhi 1963;Huber 1957;Stocklin 1968)
The studied area is located in the North of Alborz Mountain Range in Mazandaran Province,north of Iran.The base of the section starts at 36°15′7′′N and at 52°54′7′′E and continues towards the north.The access route to the study area is Qaemshahr to Zirab road.The studied section is located between Shirgah and Javaram cities(Fig.1).
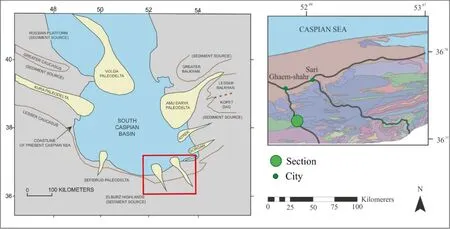
Fig.1 Geological map of the studied area and the access route to the sampling location(modified from Smith-Rouch 2006)
3 Materials and methods
Sampling was carried out considering lithology changes of the beds in the study area.In places that the lithological changes were low,more samples from one bed were taken according to the thicknessof the beds.In this study,a total number of 140 thin sections were prepared.Several methods were adopted to study the lithology of the Cheleken Formation to introduce its comprising facies.Pebbles and matrix were studied through several experimental methods such as petrographic study X-ray diffraction(XRD)and X-ray f luorescence(XRF).Classif ication of sandstone was based on Pettijohn scheme(Pettijohn 1975;Pettijohn et al.1987)and carbonate rocks classif ication was based on Dunham scheme(Dunham 1962).Fine facies determinations were based on XRF and XRD analyses.For determination of particle source,dating of particles was done by fossil content of the rocks and lithology.Also,XRF analysis was carried out on the samples to study provenance and tectonic setting.In this regard,8 samples from exposed mudstones and conglomeratesmatrix of the Cheleken Formation were gathered.All samples were powdered,then XRF analysis was done,and major and minor elements concentration of the samples were determined(Cullers 1994,2002;Feng and Kerrich 1990;Floyd and Leveridge 1987;McLennan 2001).Regarding the mudstone samples,the following methods were carried out:Bernard calcimetery approach to get CaCO3percent,dissolving evaporates in the samples to determine evaporates percentage,XRD method to determine the constituent minerals of the samples.
4 Results and discussion
Cheleken Formation in this study is composed of grey to brown conglomerate(very hard and resistant texture)with interlayersof sandstone and mudstone.The studied section consists of 62%conglomerate,32%mudstone,and 6%sandstone.The f ield photos and the distribution of layers are shown in Fig.2.Features and characterization of outcrop and thin sections were studied(Fig.3)and eight samples were chosen for geochemical analysis(Fig.2).

Fig.3 Sedimentological log along with f ield and laboratory study descriptions
4.1 Facies analysis
Based on the macroscopy and microscopy studies,three facies were determined as following(Fig.2).These facies have a cyclic nature with a f inning upward trend(conglomerate facies at the base and mudstone facies on the top)(Fig.2).
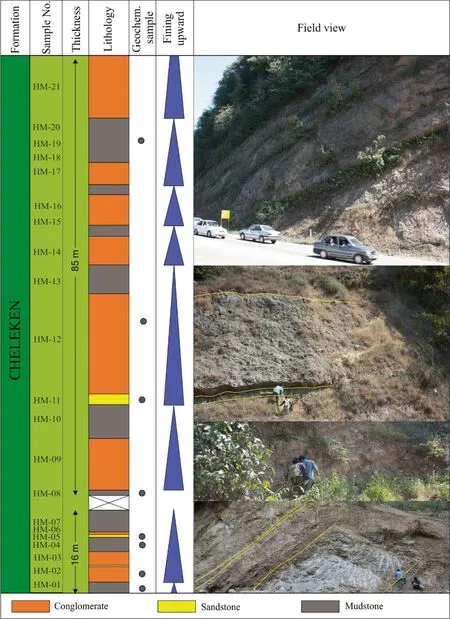
Fig.2 This picture shows outcrop,scattering of layers,and location of geochemical samples.The dip direction of layers is toward to north
4.1.1 Conglomerate(F1)
the average size of pebbles is 10 cm.Most conglomerates are polymictic and grain supported,which represent a f ining upward trend in the f ield.The grains normally are moderately sorted with a rounded to the subrounded texture(Fig.4).The basal part of conglomerate layers has an erosional surface(Fig.4).In this section graded bedding,gutter cast,and imbrication structures were observed(Fig.4).
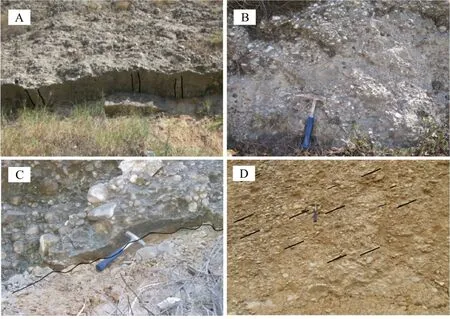
Fig.4 A Gutter cast in the base of conglomerate layer,B Graded bedding,C Erosional surface,D Imbrication structure
This facies comprises clasts of quartz arenite(Fig.5A),sublitharenite(Fig.5B),subarkose(Fig.5C),arkose,and carbonate clasts(Fig.5E).Carbonate bioclasts mainly consist of skeletal fragments of bivalvia,echinoderms,ostracod,and benthic foraminifera(Fig.5F).The matrix of conglomerate is composed of arkose,sub-arkose,and sublith-arenite(Fig.5D-G).
4.1.2 Sandstone(F2)
Sandstone facies is generally composed of quartz,feldspar grains,silica,and carbonatecement.The main components of these facies are similar to the matrix of conglomerate pebbles.The difference between sandy facies with the matrix of conglomerate is their particle size which the sandy facies particles are smaller.
4.1.3 Mudstone(F3)
Main components of muddy facies include:carbonate(usually calcium carbonate),organic matter(plant residues),siliciclastic particles(quartz,feldspar,mica,and heavy minerals),and clay minerals(Fig.6).The muddy facies color is various(from cream to brown color)depending on weathering and composition of layers(Fig.5H).Organic matter,pyrite,and oxidation are the main controlling factors for color changes.The high content of organic matter and pyrite led to brown color(c.f.Tucker 1991).

Fig.5 A Quartz arenite with silica cement overgrowth and iron oxide(arrows),P;B Sub lithic-arenite with silica cement overgrowth,iron oxide(arrows)and shale lithics,P;C Sub arkose with quartz particles,microcline and silica cement overgrowth,P;D Sand-sized,quartz particles in carbonate cement,P;E Wackestone,N;F Bioclast packstone,N;G Matrix of a conglomerate with quartz and calclithic grains in carbonate cement,P;H Color variation in muddy facies.(P:Polarized-N:Normal light)

Fig.6 XRD graphs of muddy facies showing Quartz,Calcite and Clay minerals(A:Sample No,07.B:Sample No,13)
Typically,there is a good correlation between sediments deposited on a f lood plain with the other associated facies in the same depositional environment.In this study,the amount of calcium carbonate(lab study)in muddy facies hasagood correlation with conglomeratefacies,so that the morecarbonategravel content,the morecalcium carbonate in the muddy facies is observed Table 2.
4.2 Sedimentary environment
The presence of conglomerate with large grain size,iron oxide,and erosional surface between conglomerate and mudstone layers in the f ield study indicate the terrigenous environment(Mehrabi 2015).For every cycle,graded bedding structure indicates a decrease of energy upwards.Sedimentary structures such as gutter cast and imbrication demonstrate water f low(Fig.4).The increase in calcium carbonate content of mud samples upward in the sequences is in good agreement with the increase in calcareous debris in conglomerate facies,which indicates that these facies(i.e.mud facies)is affected by their associated facies(i.e.conglomeratefacies),and it can represent thef lood plain of a river.Based on the above-mentioned facies description the sedimentary environment of the Cheleken Formation is reconstructed as a f luvial environment(Mehrabi et al.2020).Also,the sedimentary environment of this region has been considered as a river and deltaic environment in previous studies(Smith-Rouch 2006;Mehrabi et al.2020).The depositional model for the Cheleken Formation is presented in Fig.7.
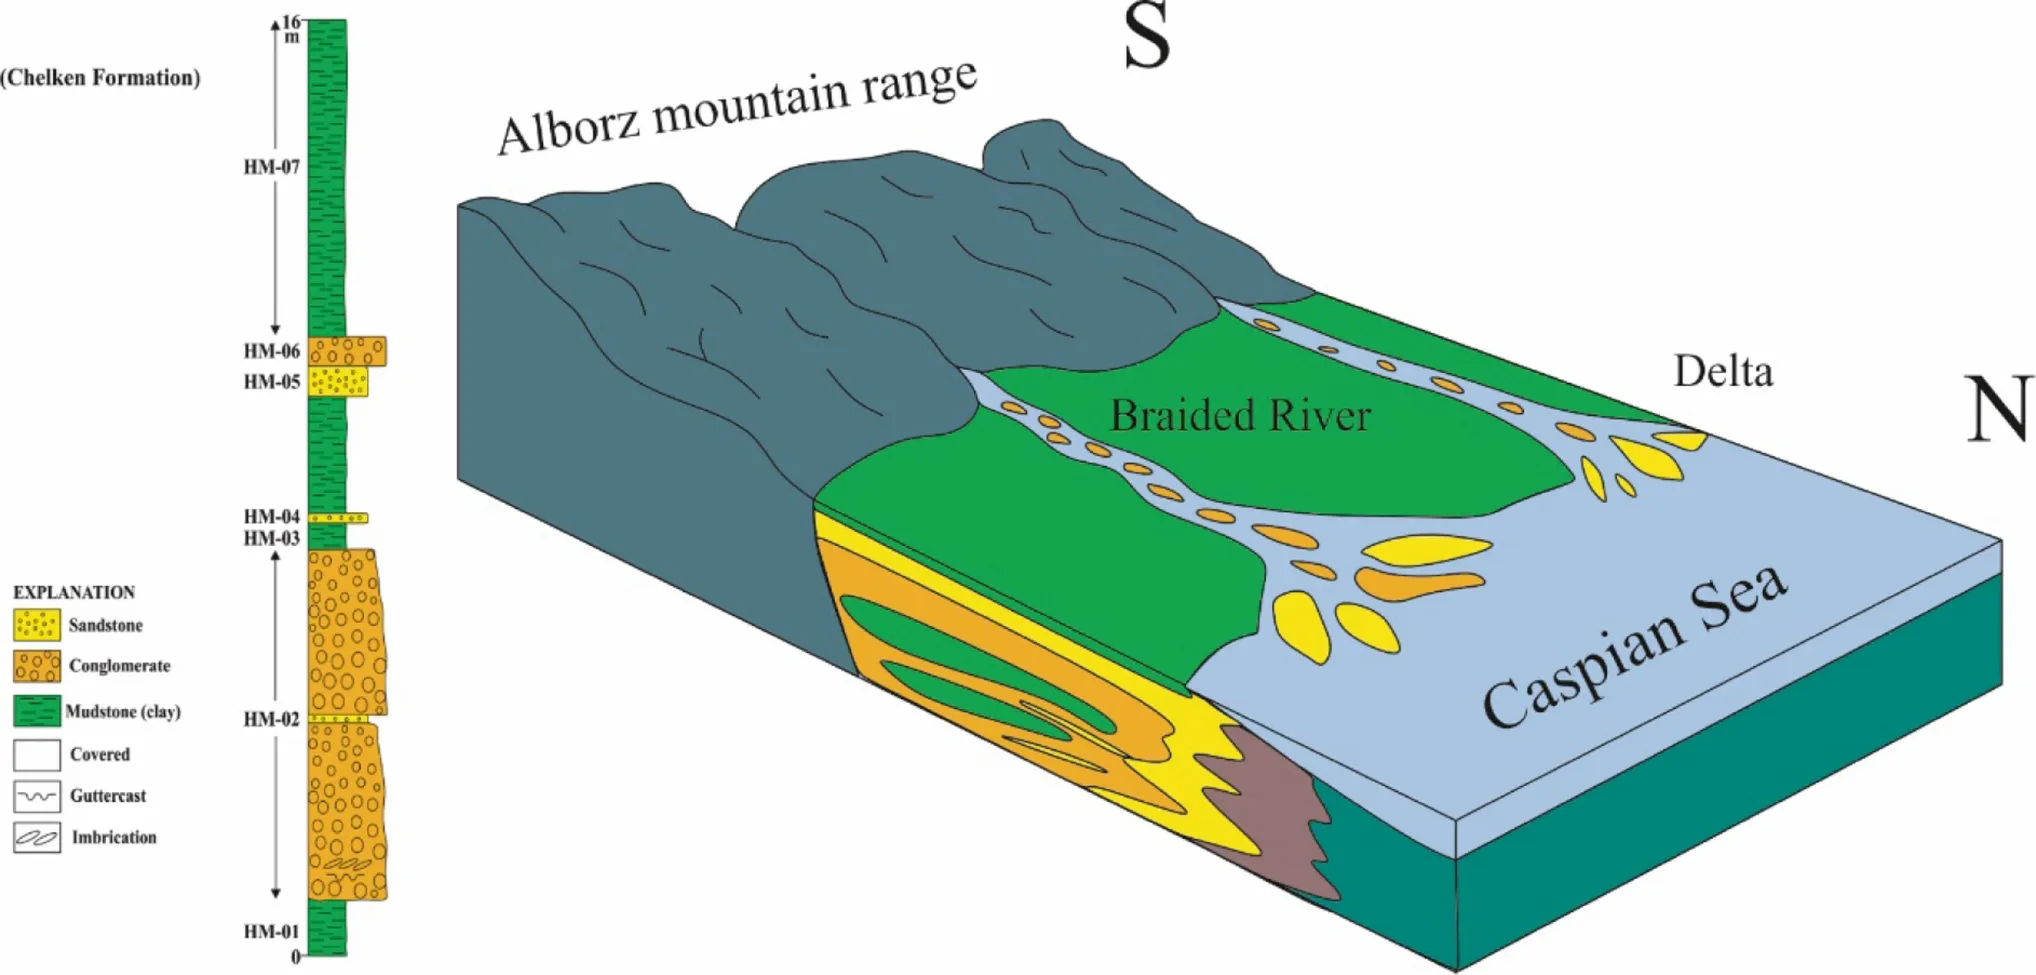
Fig.7 The depositional model for the Cheleken Formation(Mehrabi,2020)
4.3 Provenance
Clastic sedimentary rocks can represent their past tectonic setting based on their mineral contents(Rieser et al.2005).Provenance analysis of the siliciclastic sediments(sandstone and shale)can be used to determine the pre-depositional history of the sedimentary rocks(Bhatia 1983).Indeed,the goal of provenance studies is to deduce the characteristics of sediment source areas.The petrographic analysis is a standard method for studying provenance(e.g.,Dickinson and Suczek 1979;Ingersoll and Suczek 1979).However,the geochemical composition of siliciclastic rocks is widely used to understand the composition(Armstrong Altrin et al.2004;Dostal and Keppie 2009;Jafarzadeh and Hosseini-Barzi 2008;Umazano et al.2009),evaluate weathering processes(Absar et al.2009;Khanehbad et al.2012),and develop paleogeographic reconstructions of source regions(Ranjan and Banerjee 2009;Zimmermann and Spalletti 2009).
If the lithology of provenance formations is already known,by identifying and comparing the lithological propertiesof pebblesin theconglomerateswith thosein the provenance area,we can recognize the main provenance of the pebbles in the new conglomerates.It is worthy of note that the method of study and investigation of the provenance vary in different pebbles.Sandstones with different geological settings in the provenance area have their special clastic components that can be used in determining their sedimentary provenance(Kroonenberg 1994).In addition,by identifying fossils in carbonate lithics,their provenance can be deciphered.The abundance of rock fragments in conglomeratic facies can be of great and effective help in determining the formation provenance.These fragments are good representatives of their main source lithology in the Cheleken Formation and to a great extent present the characteristics of source lithology and their tectonic settings.
4.3.1 Sandstone grains
In studying the characteristics of sand lithics in studied sections from a provenance point of view,the main emphasis was on their identif iable f ield properties and their petrographic characteristics.To investigate and correlate sand lithics with their provenance,their lithological characteristics in the f ield sections(Fig.3)were investigated at f irst.Afterwards,the results were compared with the formations(composed of sandstone lithology)that were older than the Cheleken Formation in the area(Table 1).
In this research,due to the lack of precise petrographic and laboratory information from sandstone formations in the studied area,only the lithics from Lalun Formation were compared with their main provenance.The Lalun Formation was studied in detail by Hosseini Barzi(1996)from a petrographic point of view.In the latter study,the Lalun sandstone was described as grain-supported sandstone lacking matrix and sometimeswith arkosic and lithic arkosic lithology.In the Lalun sandstone,the quartz grains always represent quartz overgrowth along with iron oxide and sometimesferroan dolomites.Sometimeszircon grains were also observed(Hosseini Barzi 1996).Among the gathered samples in the f ield,some of the studied samples represent characteristics very similar to that of the Lalun Formation sandstone from the f ield and petrographic viewpoints(Table 3).
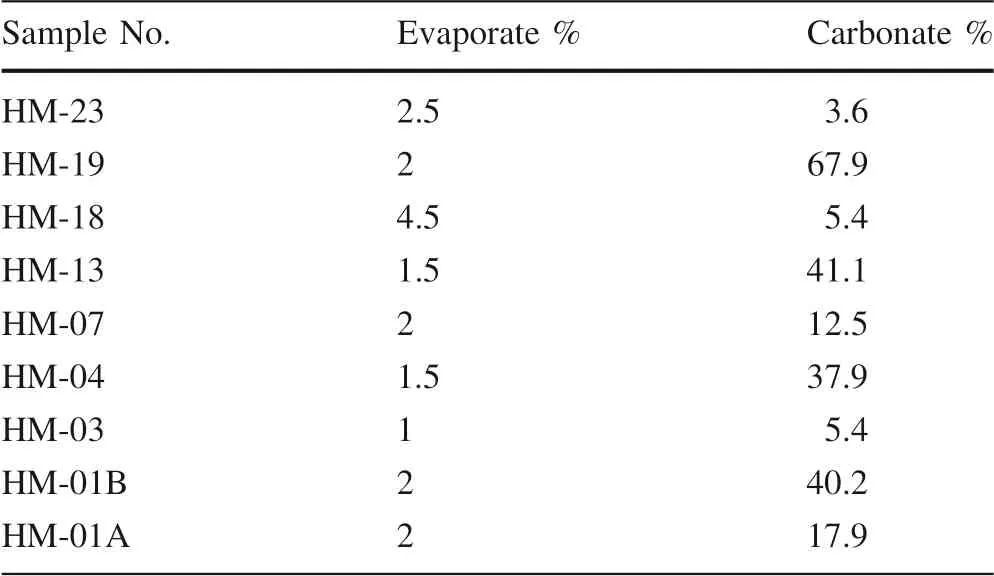
Table 2 Carbonate and evaporate content in the Cheleken Formation in Javarom section
4.3.2 Carbonate pebbles
Some of the carbonate pebbles in the conglomerate facies have specif ic fossils(Table 4).These fossils can be used to determine the source formation and provenance of the conglomerate components(Table 1).For example,some of the limestone samples containNummulitessp.(Fig.8b)andOrbitolinasp.(Fig.8c)that respectively indicate the presence of Eocene and Cretaceous source formations,in the region.In sample 53G,the presence ofDiscocyclinasp.indicates an Eocene age(Fig.8a,e).Also,in sample 50C,due to the presence ofFlosculinasp.,an Eocene age can be determined for the rocks which shed sediments into the basin.Eocene formationsin thestudied area include Fajan,Ziarat,Karaj,and Kond formations(Table 1).Although the above-mentioned samples don’t have the index fossils of the Ziarat Formation,however,the following reasons represent the highest similarity with that formation:1-Fajan Formation is mostly conglomeratic to sandstone,2-Karaj Formation is mostly composed of volcanic tuff and pyroclastic materials along with some tuff bearing limestone,3-Kond Series include conglomerate,gypsum,and marl and have a tar smell while the studied samplesdid not have the above-mentioned characteristics.Also,the sample HM-12C representedDiscocyclinasp.andNummulitessp.which are representative ofNummulitesbearing Ziarat Formation.Sample HM-17B hasOrbitolinasp.(Fig.8c)which is an index fossil for Tizkuh Formation.Another characteristic of this limestone is its pink color which is represented in sample HM-15B.The latter limestone is a bioclastic packstone-grainstone with abundant bivalves.Tizkuh Formation is composed of white to pink limestone which hasOrbitolinasp.This limestone grades upward into rudist and gastropod bearing thick white to pink limestone.The presence ofCalcisphaerula innominata,Pithonella ovalisin sample HM-52F,andGlobotruncana(Fig.8d)suggest a Cretaceous age for them in Central Alborz Zone.Sample HM-52B(Fig.8f)is an ooid packstone.Among limestone formations of the study area,the characteristics of this sample are similar to the Dalichai Formation,which has an ooidal bed in its basal part.

Table 5 Concentration of major oxides(%)and minor elements(ppm),ICV Index of Compositional Variation;CIA Chemical Index of Alteration(Nesbitt and Young 1982);PIA Plagioclase Index of Alteration(Fedo et al.1995);CIW Chemical Index of Weathering(Harnois 1988);CIW Chemical Index of Weathering(Cullers 2000)

Fig.8 The major skeletal components identified in the Cheleken Formation;a Discocyclina sp.,b Nummulites sp.,c Orbitolina sp.,d Globotruncana sp.,e Discocyclina sp.,f Ooid Packstone
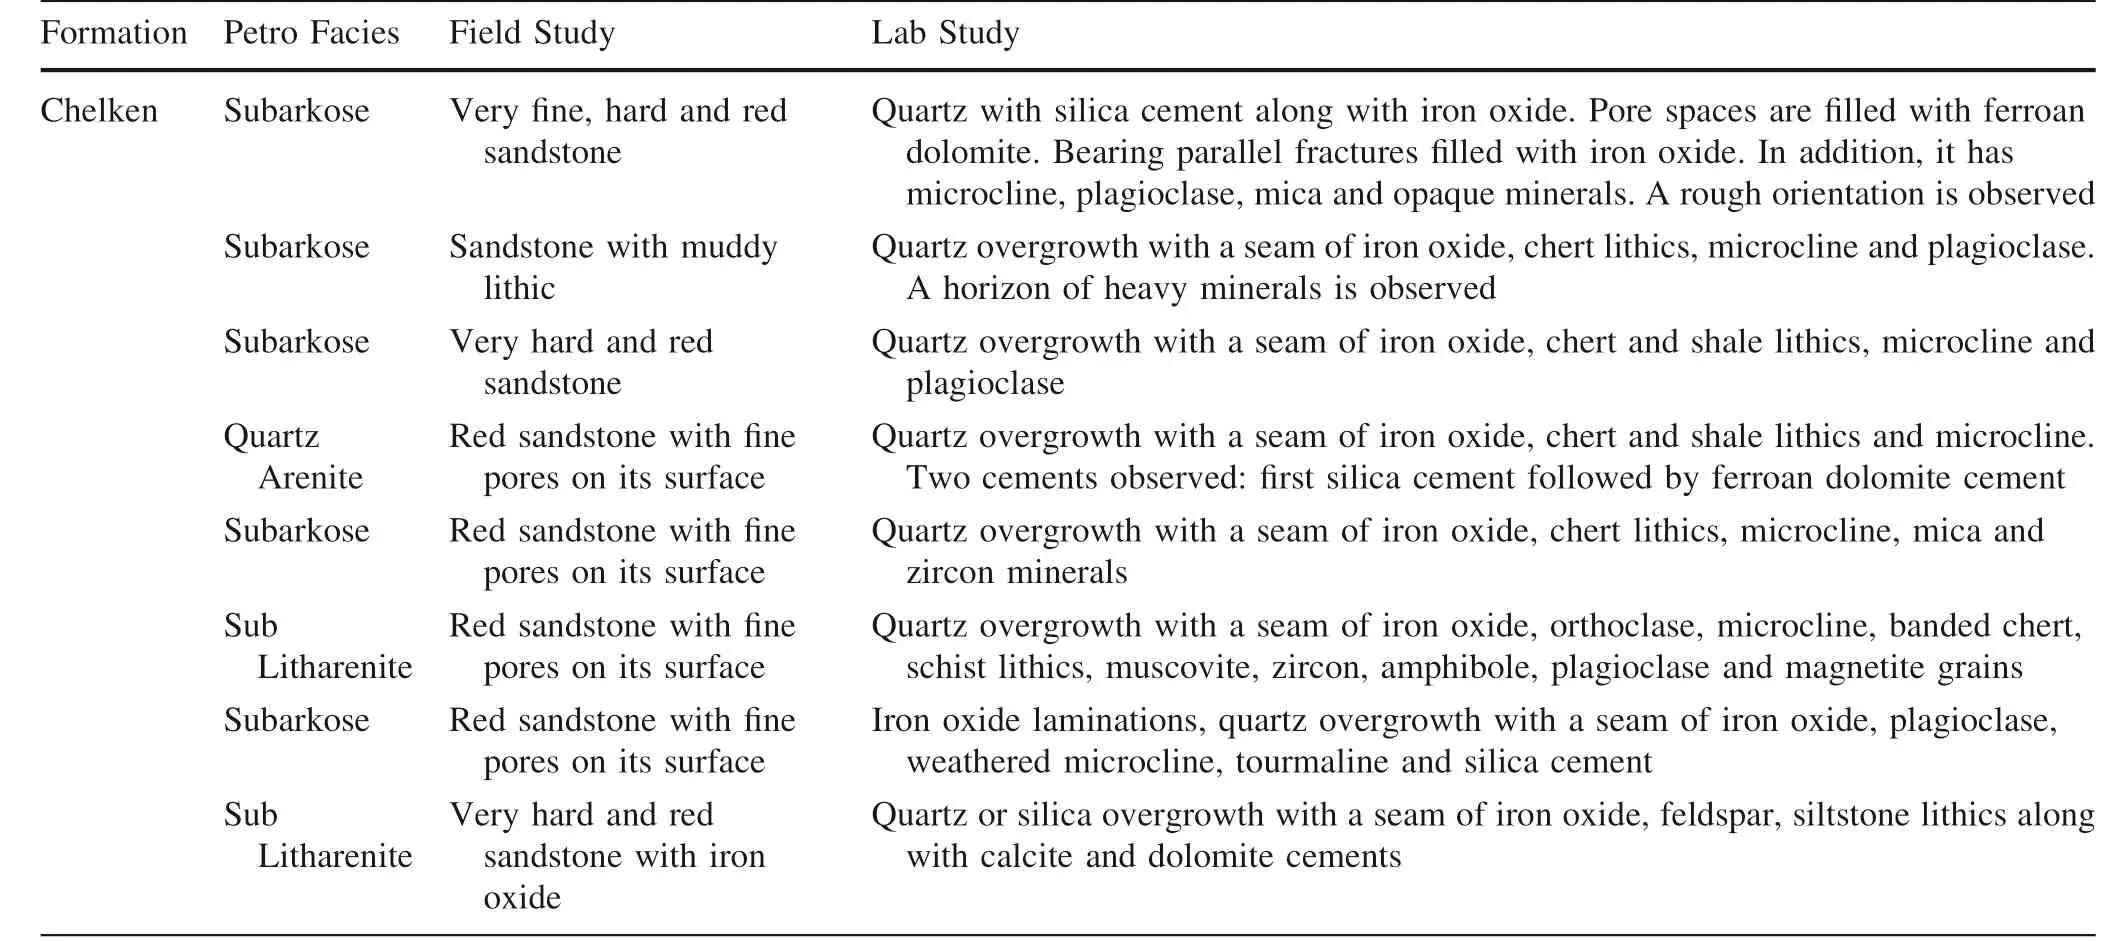
Table 3 Lithological and petrographic characteristics of sand lithics of the studied sections

Table 4 Description of the limestone pebble in conglomeratic facies
4.4 Geochemistry
As mentioned,the chemical composition of the sedimentary rocks is mostly controlled by source(parent)rocks.The analysis of the major and minor elements reveals details of the sediment composition and tectonic setting of the sedimentary basin.The geochemical composition of the detritus rocks is a function of complex diversities such as provenance,weathering,transportation,and diagenetic processes(Bhatia 1983).Bhatia(1983)indicated that the ratio of Al2O3/SiO2gives an indication of the quartz enrichment in sandstones.The K2O/Na2O ratio is a measure of the potassium feldspar and mica versus plagioclase content in sandstone.Roser and Korsch(1986)used the ratio of K2O/Na2Oand SiO2content of published datafrom ancient sedimentary suites to def ine different tectonic settings such as passive margin(PM),active continental margin(ACM),and arc(ARC).Roser and Korsch(1998)used discriminate function analysis elements(TiO2,Al2O3,total Fe2O3, MgO, CaO, Na2O, and K2O) for discriminating four different provenance groups for sandstone and argillites of the New Zealand terranes including maf ic,intermediate dominantly andesitic detritus,felsic and plutonic and volcanic detritus and recycled mature polycyclic quartsoze detritus.
In geochemical studies related to provenance determination some major and minor oxides are usually analyzed(e.g.,Roser and Korsch 1988;Floyd et al.1989a,b,1990;McLennan et al.1993).Major oxides concentration is represented in percent and the minor elements are measured in ppm units.Among all oxides K2O,MgO,CaO,and Na2O are mobile,and TiO2and Al2O3are immobile oxides.The results of the analysis are represented in Table 5.The analyses were carried out on muddy and sandstone samples gathered from the lithologies present in the study area.
Figure 9 illustrates a normalized diagram of major elements with PAAS(Post Archaean Australian shale;Taylor and McLennan 1985).A severe depletion is seen in Na2O and CaO.Depletion seen in Na2Ocan be considered as the result of the disintegration of plagioclase grains during transportation(McCann 1991;Condie et al.1992).The high amount of CaOin thesamplescan result from thehigh concentration of carbonate clasts from provenance and diagenetic carbonate cement as well.
4.4.1 Chemical classif ication
In thispart,theclassif ication of sediment sampleswasdone by the geochemical data(Pettijohn et al.1975;Herron 1988).Figure 10 shows the classif ication diagram by the Heron method.This lithology classif ication diagram is based on logarithmic ratios of SiO2/Al2O3vs.Fe2O3/K2O(Fig.10).Most of the samples are in the range of Fesandstone,litharenites,and greywackes.Pettijohn classif ication chart is based on logarithmic ratios of SiO2/Al2O3vs.Na2O/K2O(Fig.11).In this classif ication,most of the samples are litharenites and sub-arkose.The geochemical classif ications of the samples are in good agreement with the petrographic studies(Fig.3).

Fig.9 Distribution of PAAS normalized abundances of major elements
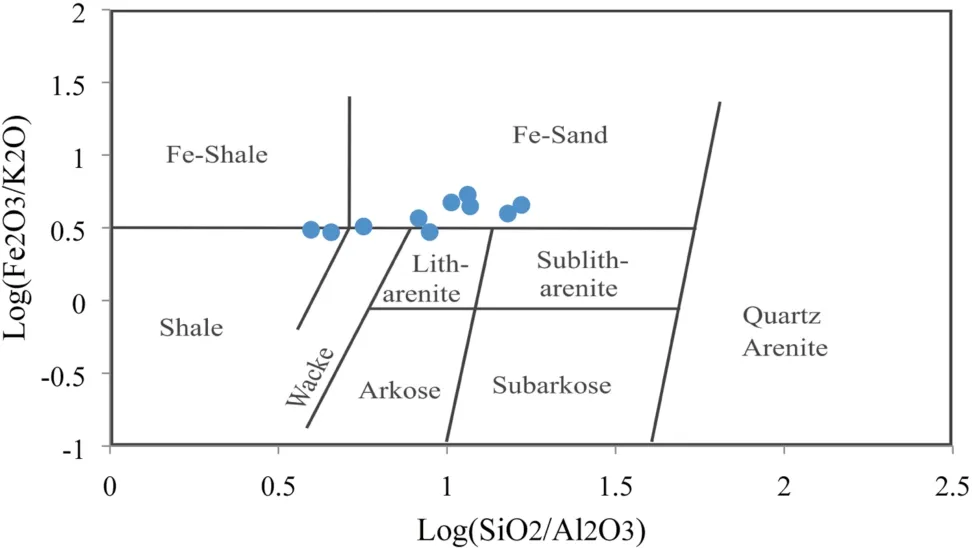
Fig.10 Chemical classif ication scheme for samples after Herron(1988)

Fig.11 Chemical classif ication scheme for samples after Pettijohn(1975)
4.4.2 Geochemical provenance
Many researchers believe that the chemical composition of clastic sedimentary rocks is in close relation to their provenance.As a result,we can determine the characteristics of source rocks through studying geochemical characteristics of the clastic sedimentary rocks(Alvarez and Roser 2007;Fralick and Kronberg 1997;Manikyamba et al.2008;Dey et al.2009;Kalsbeek and Frei 2010;Mishra and Sen 2010).
According to the difference in the abundance of minor elements in the source(parent)rocks,we can recognize the source of sediments.For instance,Zr,Th,Nb,and La elements are more abundant in felsic and acidic rocks,and on the contrary elements such as Co,Cr,Ni and Sc are mostly present in maf ic rocks(Feng and Kerrich,1990).Consequently,by considering these elements,the provenance can be deciphered(Taylor and McLennan,1985).For example,Sc can represent to some extent the composition of parent rock because it is an immobile element(Bhatia and Crook,1986).Th is also more common in felsic rocks.Felsic and maf ic parent rocks represent different signatures according to the La/Sc,Th/Sc,La/Co,Th/Cr,and Th/Co ratios(e.g.,Cullers et al.1988;Cullers,1994,2000;Cullers and Podkovyrov,2000).In this study,the ratios are represented in Table 6 and indicate a felsic composition for the rocks in the source area.

Table 6 Range of elemental ratios of Cheleken sandstones compared to the ratios in similar fractions derived from felsic rocks,maf ic rocks and upper continental crust(UCC)
Based on Hayashi’s diagram(TiO2versus Zr),the studied samples are plotted in a felsic area(Hayashi et al.1997)(Fig.12A).According to Cullers(2002),Th/Co ratio against La/Sc representsthesilicic natureof thesourcearea rocks(Fig.12B).Besides,the abundance of different minor elements in source area rocks is also used(Cr/V versus Y/Ni diagram)(Floyd and Leveridge,1987).According to the Floyd diagram,the studied samples are plotted in the area of intermediate toward acidic rocks(Fig.12C).In TiO2versus Ni diagram,the samples are plotted in an acidic area as well(Fig.12D).

Fig.12 Provenanceindicating diagrams,A TiO2 wt%versus Zr(ppm)bivariatediagram(after Hayashi et al.1997).B Th/Co ratio versus La/Sc(after Cullers2002).C Cr/V versus Y/Nidiagram(after Floyd and Leveridge 1987).D TiO2 wt%versus Ni(ppm)bivariate diagram(after Floyd et al.1989a,b)
In addition to minor elements,the major elements are also used to decipher the source area rockscomposition.In Roser and Korsch’s(1988)provenance discrimination diagrams,the discrimination equation has resulted from mobile and non-mobile major elements.In the present research,the results of analyzed samples represent intermediate igneous provenance for the samples(Fig.13).
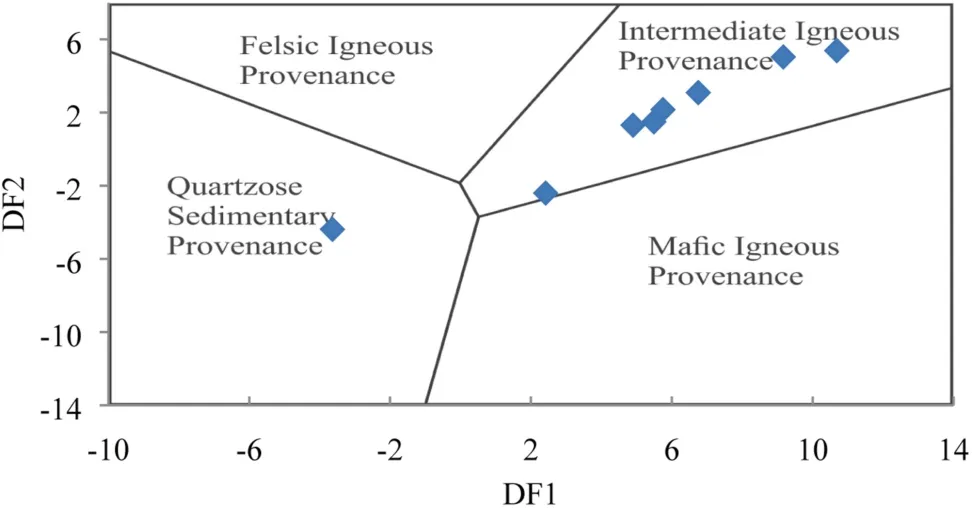
Fig.13 Provenance discrimination diagram(after Roser and Korsch,1988).Discriminant function 1=(-1.773×TiO2%)+(0.607×Al2O3%)+(0.76×Fe2O3%)+(-1.5×MgO %)+(0.616×CaO%)+(0.509×Na2O%)+(-1.22×K2O%)+(-9.09).Discriminant function 2=(0.445×TiO2%)+(0.07×Al2O3%)+(-0.25×Fe2O3%)+(-1.142×MgO%)+(0.438×CaO%)+(1.475×Na2O%)+(1.426×K2O%)+(-6.861)
4.4.3 Palaeoweathering
The intensity of chemical weathering in rocks is usually controlled by the chemical composition of source rocks,climatic conditions,and tectonic uplift ratio(Wronkiewicz and Condie 1987).During chemical weathering,Ca,Na and K cations are mainly removed from source rocks.The remaining amount of these elements in resultant sediments is an index that issensitive to chemical weathering(Nesbitt et al.1997).Weathering grade of the source area encompasses different values.All suggested indices are based on the mobile and immobile oxide of elements and their abundance(e.g.Na2O,CaO,K2O,and Al2O3).
There are different methods to determine the degree of weathering such as chemical index of alteration(CIA;Nesbitt and Young 1982),Plagioclase Index of Alteration(PIA;Fedo et al.1995),and Chemical Index of Weathering(CIW;Harnois 1988).However,since CaO concentration is high in samples,they cannot be studied.In this kind of samples(i.e.carbonate-rich siliciclastics),it is suggested that CIWshould bereplaced with CIW’(Cullers2000).All above-mentioned formulas follow:

(All major elements oxides are represented in mole percent and CaO*is the amount of CaO which is along with silica).
(All major elements oxides are represented in mole percent and CaO*is the amount of CaO which is along with silica).
CaO content of studied samples ranges from 0.28%to 33.89% (21.46% on average).This amount is not suitable for measuring CIA,therefore,the ratio of Ca/Na(Fig.14)was used to measure the amount of CaO*of the samples(c.f.McLennan 1993).According to this method,the f ield of changes in CIA ranges from 72.47 to 82.99(with an average of 80.55),PIA rangesfrom 77.34 to 98.22(with an average of 93.20),CIW ranges from 79.56 to 98.58(with an average of 94.19)and CIW’ranges from 88.62 to 99.28(with the average of 96.93)all of which represent the occurrence of a severe weathering in the studied samples(Table 4).

Fig.14 Al2O3-CaO*+Na2O-K 2O ternary diagram showing degree of alteration of the Cheleken Formation(after Nesbitt and Young,1984)
4.4.4 Paleoclimatic Condition
Weathering index in sedimentary rocks provides us with useful information about climatic and tectonic conditions in the source area.An increase in weathering index value may represent a decrease in tectonic activity and/or a change toward hot and humid climatic conditions(Jacobson et al.2003).A two-variable diagram of SiO2against Al2O3+K2O+Na2O is suggested for the determination of climatic conditions during sedimentation of siliciclastic sediments(Suttner and Dutta 1986).According to this diagram,most of the studied samples are placed in the humid region of the diagram(Fig.15).This represents a humid condition during sedimentation of the samples.
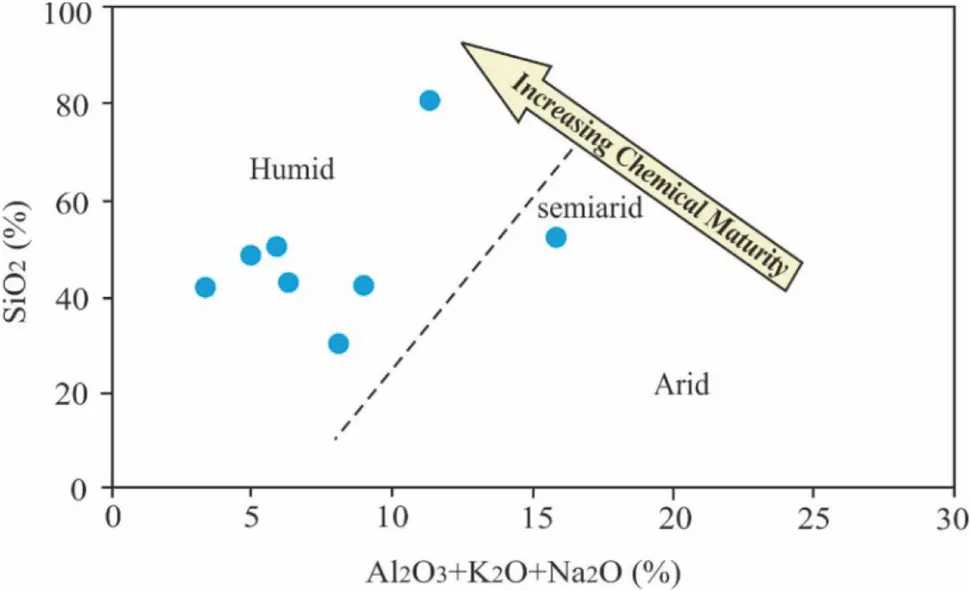
Fig.15 Bivariate SiO2 wt%versus(Al2O3+K 2O+Na2O)wt%paleoclimate discrimination diagram after Suttner and Dutta(1986)
Paleo-Redox condition of siliciclastic sediments during deposition is predictable by chemical analysis data.If Ni/Co ratio isbelow 5,it represents an oxic condition and if it is above 5,suboxic and anoxic conditions are inferred(Jones and Manning 1994).Also,the Cu/Zn ratio isa good character for determining paleo-redox conditions,so that the high value of Cu/Zn shows a reducing and a low value suggests oxidizing conditions(Hallberg 1976).In studied samples,Ni/Co ratio varies from 3 to 7(with an average of 4.8)which represents the oxic condition of deposition and the Cu/Zn ratio varies between 0.12 and 0.97(with an average of 0.41)representing oxidizing conditions.
4.4.5 Tectonic setting
Many research indicates that chemical compositions of siliciclastic sedimentary rocks are controlled by the tectonic setting of provenance plates and as a result,it is controlled by terrain-specif ic geochemistry of different tectonic settings(e.g.Bhatia 1983;Bhatiaand Crook 1986;Roser and Korsch 1986).According to thehalf-logarithmic diagram of log(K2O/Na2O)vs.SiO2,three major tectonic settings of source rocks can be discriminated from each other(Roser and Korsch 1988).Based on this diagram,Cheleken Formation samples are mostly plotted in the ACM region,and some of them in PM region tectonic setting(Fig.16A).Discriminant function analysis using major element composition is another method for the tectonic setting(Bhatia 1983).This diagram also suggested ACM and PM for the tectonic setting of the source area of the Cheleken Formation(Fig.16B).

Fig.16 A The diagram representing tectonic setting of the Cheleken Formation(Roser and Korsch 1988).B Discrimination function plot of Cheleken Formation(after Bhatia 1983).OI-ARC:Oceanic island arc,CI-ARC:Continental island arc,ACM:Active continental margins and PM: Passive margins D1: (-0.447*SiO2%)+(-0.972*TiO2%)+(0.008*Al2O3%)+(-0.267*Fe2O3%)+(0.208*FeO%)+(-3.082*MnO%)+(0.14*MgO%)+(0.195*CaO%)+(0.719*Na2O%)+(-0.032*K2O%)+(7.51*P2O5%)+0.303. D2: (-0.421*SiO2%)+(1.988*TiO2%)+(-0.526*Al2O3%)+(-0.551*Fe2O3%)+(-1.61*FeO%)+(2.72*MnO%)+(0.881*MgO%)+(-0.907*CaO%)+(-0.177*Na2O%)+(-1.84*K2O%)+(7.244*P2O5%)+43.57
Also,the diagram in Fig.17 represents the tectonic setting of the source area according to TiO2versus Fe2-O3+MgO(Fig.17A)and Al2O3versus Fe2O3+MgO(Fig.17B)ratios.These diagrams prove the ACM and PM tectonic setting for the source area of the Cheleken Formation.

Fig.17 Tectonic-setting discrimination diagrams for Cheleken Formation.Boundaries are after Bhatia(1983).OIA Oceanic island arc margin;CIA Continental island arc;ACM Active continental margin;PM Passive margin
The amounts of minor elements such as Y,Ti,Zn,Sc,Th,La,and Cr are less affected during weathering,diagenesis,and intermediate metamorphism and as a result,they are good indicators for understanding the paleo-tectonic setting of the sedimentary rocks(Bhatia and Crook 1986)(Fig.11).Figures 18A and B illustrate the ACM and PM tectonic setting of the studied samples according to minor element ratios.

Fig.18 Tectonic-setting discrimination diagrams for Cheleken Formation base on trace element after Bhatia and Crook(1986).OIA Oceanic island arc margin;CIA Continental island arc;ACM Active continental margin;PM Passive margin
5 Conclusion
We studied outcrops from the Cheleken Formation in the northern Alborz region,its tectonic setting,provenance,and paleo-climatic condition.The sandstone samples of the Cheleken Formation are mostly originated from Lalun,Ziarat,Tizkuh,and Dalichai formations.The high amount of CaO in the studied samples indicates erosion of carbonate clasts within the conglomeratic horizons while low amounts of Na2O indicate either the low amount of plagioclase minerals in the source formations or severe weathering conditions in the source area.In the chemical classif ication part,most of the samples were in litharenite to subarkose similar to the results of petrography.The rocks in the source area for the studied samples represent felsic acidic to intermediate rocks according to the geochemical study.According to previous studies,during the Pliocene,there were activities such as rapid subsidence in the South Caspian Sea,uplift in the Alborz mountain chain,and high erosion in the Alborz mountain chain.Geochemical studies show that the tectonic regime of the area was the active continental margin,which indicates the activity of the basin and conf irms previous studies.From a climatic condition point of view,the predominance of the humid climatic condition issuggested.Thishumid climatic condition caused severe erosion of the Mesozoic formations and their subsequent deposition as the Cheleken Formation during the Early to Middle Pliocene.
AcknowledgementsWe thank the Khazar Exploration and Production Company(KEPCO)for assistance and the provision of facilities for f ieldwork.Special thanks are also expressed to Dr.Mohsen Ranjbaran for useful comments during petrographic studies.Special thanks are presented to the University of Tehran for the provision of research facilities for this study.
Declarations
Conf lict of interestThe author declare that they have no conf lict of interest.
- Acta Geochimica的其它文章
- Correction to:Variations of methane stable isotopic values from an Alpine peatland on the eastern Qinghai-Tibetan Plateau
- Bicarbonate use and carbon dioxide concentrating mechanisms in photosynthetic organisms
- The possible source of uranium mineralization in felsic volcanic rocks,Eastern Desert,Egypt of the Arabian-Nubian Shield:Constraints from whole-rock geochemistry and spectrometric prospection
- Dissolved organic carbon concentration and its seasonal variation in the Huguangyan Maar Lake of Southern China
- Geochemistry,geochronology,and zircon Hf isotopic compositions of felsite porphyry in Xiangshan uranium oref ield and its geological implication
- Geochemistry of platinum-group elements in the podiform chromitites and associated peridotites of the Nain ophiolites,Central Iran:Implications for geotectonic setting

