Analysis of the Leading Modes of Autumn Precipitation over the Yangtze River Basin
QIAN Heng, XU Shibin, and WU Xin
1) College of Meteorology and Oceanography, National University of Defense Technology, Changsha 410073, China
2) College of Oceanic and Atmospheric Sciences, Ocean University of China, Qingdao 266100, China
3) Ocean and Fishery Bureau of Dongying, Dongying 257091, China
Abstract Based on daily precipitation data from 109 stations in the Yangtze River Basin (YRB) over the past 36 years (1980 - 2015),the Empirical Orthogonal Function (EOF) is employed to analyze changes in autumn precipitation. We used the monthly mean reanalysis datasets of atmospheric circulation and sea surface temperature (SST) to investigate the possible causes of the two leading modes, based on which the predictive equations were constructed and tested. The results of the EOF analysis show that the variance contribution of the first mode is 31.07%, and the spatial distribution shows a uniform variation over the whole region. The variance contribution of the second mode is 15.02%, and the spatial distribution displays a north-south dipole pattern in the YRB. The leading mode shows a dominant interannual variation, which is mainly due to the West Pacific subtropical high and anticyclones over the Philippine islands. The SST field corresponds to the positive phase of the eastern Pacific El Niño and the tropical Indian Ocean dipole. The second mode may be related to the Indian Ocean-East Asian teleconnection and early withdrawal of the summer monsoon.The SST field corresponds to a weaker central Pacific El Niño. Through a stepwise regression analysis, SST anomalies in some areas during summer show a good predictive effect on the autumn precipitation mode in the YRB region.
Key words YRB; autumn precipitation; IOD; ENSO; predictable mode
1 Introduction
The Yangtze River Basin (YRB) is among the most densely populated and agriculturally developed regions in China. Precipitation has an essential impact on agricultural production in this area. In recent decades, many works have focused on summer precipitation in China. The results show that summer precipitation in the YRB has a quasi-biennial oscillation characteristic. This periodic oscillation is closely related to the water vapor flux over East Asia and the quasi-biennial oscillation in tropical western Pacific sea surface temperatures (SSTs) (Xu and Jian,2005; Huanget al., 2006; Wang and Feng 2011; Liet al.,2019). In contrast to summer, the intraseasonal oscillation during late summer or early autumn is mainly related to a tropical cyclone-like forcing from the tropics (Liuet al.,2020). Autumn rainfall in the YRB region, accounting for more than 15% of the annual precipitation, is also crucial to agricultural production (He, 1984). Thus, the autumn rainfall needs to be investigated, as autumn is the transitional season from the East Asian summer monsoon to the winter monsoon. Both the subtropical high and the East Asian trough may have simultaneous impacts on rainfall(Shen, 2001; Bai and Dong, 2004; Jiaet al., 2008). Some studies have also shown that the El Niño seasonal oscillation (ENSO) is an important external forcing factor affecting the autumn precipitation (Chen and Shi, 2006). Additionally, the Indian Ocean dipole (IOD) and the SST anomaly in the western North Pacific may also have a significant impact on the autumn precipitation in China (Liu and Yuan, 2006). On the other hand, autumn occurs during a critical stage of agricultural production, and droughts and floods in autumn may cause considerable losses to agricultural production. Therefore, studying the main influencing factors of autumn precipitation in the YRB region is of great scientific significance for improving the forecasting level and reducing the occurrence of disasters in China.
This paper investigates the interannual variability in autumn rainfall over the YRB region. The predictive modes of autumn precipitation in the YRB region and their variations and physical mechanism are analyzed. A prediction equation is constructed to improve precipitation prediction accuracy.
The sections of this paper are arranged as follows: the second part introduces the data used in this paper, the third part presents the two leading modes of precipitation in the area, the fourth part attempts to forecast the main modes, and the fifth part presents the summary and discussion.
2 Datasets
We used the ERA-5 reanalysis data released by the European Center for Medium-Range Weather Forecasts. The variables include potential height, vertical velocity, air temperature, wind field, relative humidity, and SST, with a spatial resolution of 0.5°×0.5°.
The daily precipitation data is selected from 109 meteorological stations over the YRB region (24°-34°N, 105°-122°E) covering the 1980 - 2015 period, and this data is provided by the China Meteorological Administration.
3 Leading Modes of Precipitation over the YRB
To obtain the characteristics of the interannual variation in autumnal precipitation in the YRB region, we employed EOF analysis to the autumn precipitation of 109 stations in the area and analyzed the two leading modes. The variance contribution rate of the first mode was 31.07% and that of the second mode was 15.02%. According to the criteria of Northet al.(1982), these two modes are independent of other modes.
3.1 First Mode
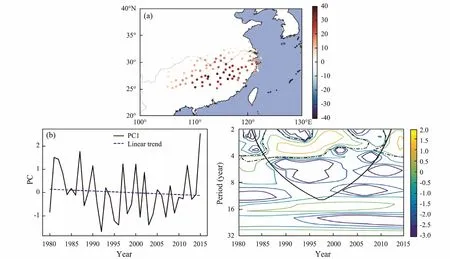
The spatial function distribution of the first mode shows the uniform pattern over the whole region. The maximum value center is located in the eastern part of Hunan and the western part of Jiangxi.
The time series of EOF1 (PC1) shows that the interannual variations dominate the change in the first mode.Since 1980, PC1 shows a period of 2 - 4 yr (Fig.1c), which is equal to the high frequency part of ENSO. The linear trend curve shows that PC1 has experienced a slight downward trend since 1980, which is not statistically significant.The trend shows that during this period, the precipitation in the YRB region has an overall decreasing trend. Anthropogenic aerosol emissions are one of the potential reasons for this downward trend (Reiset al., 2009), but whether there are other reasons requires further research. PC1 did not show significant interdecadal variation or long-term trends, which is different from the changes in summer precipitation (Wei, 2006).
3.2 Second Mode
The spatial distribution of the second mode (Fig.2a)shows a north-south dipole pattern. The positive center is located in the southern part of the Yangtze River, and the negative center is located in the north.
The time series PC2 (Fig.2b) shows that the second mode is also dominated by interannual variations. PC2 shows an upward trend from 1980 to present, which further led to an increase in the north-south difference in precipitation in the region,i.e., the precipitation in the south was abnormally high, and the precipitation in the north was decreasing. The wavelet power spectrum of PC2 (Fig.2c)shows that the significant period of PC2 is approximately 2 - 6 yr, and that the interannual variation weakened after 2000. The decadal variation is not significant during this period.

Fig.1 (a) First leading EOF mode, (b) first PC (principal component) of autumn precipitation (unit: mm), and (c) wavelet power spectrum of the first PC (the thin black curve indicates the cone of influence where the edge effect might distort the result, and the broken black line curve indicates 95% confidence level).

Fig.2 (a) Spatial pattern of the second leading EOF mode, (b) time series of the second EOF mode, and (c) wavelet power spectrum of the second PC (the thin black curve indicates the cone of influence where the edge effect might distort the result, and the broken black curve indicates 95% confidence level).
4 Mechanisms in Leading Modes
The previous analysis shows that the two leading modes of autumn precipitation in the YRB region have different characteristics. In this section, we discuss the physical mechanisms of the two leading modes from relative humidity, the ascending motion anomaly, the atmospheric circulation anomaly, and large-scale SST anomalies.
4.1 First Mode
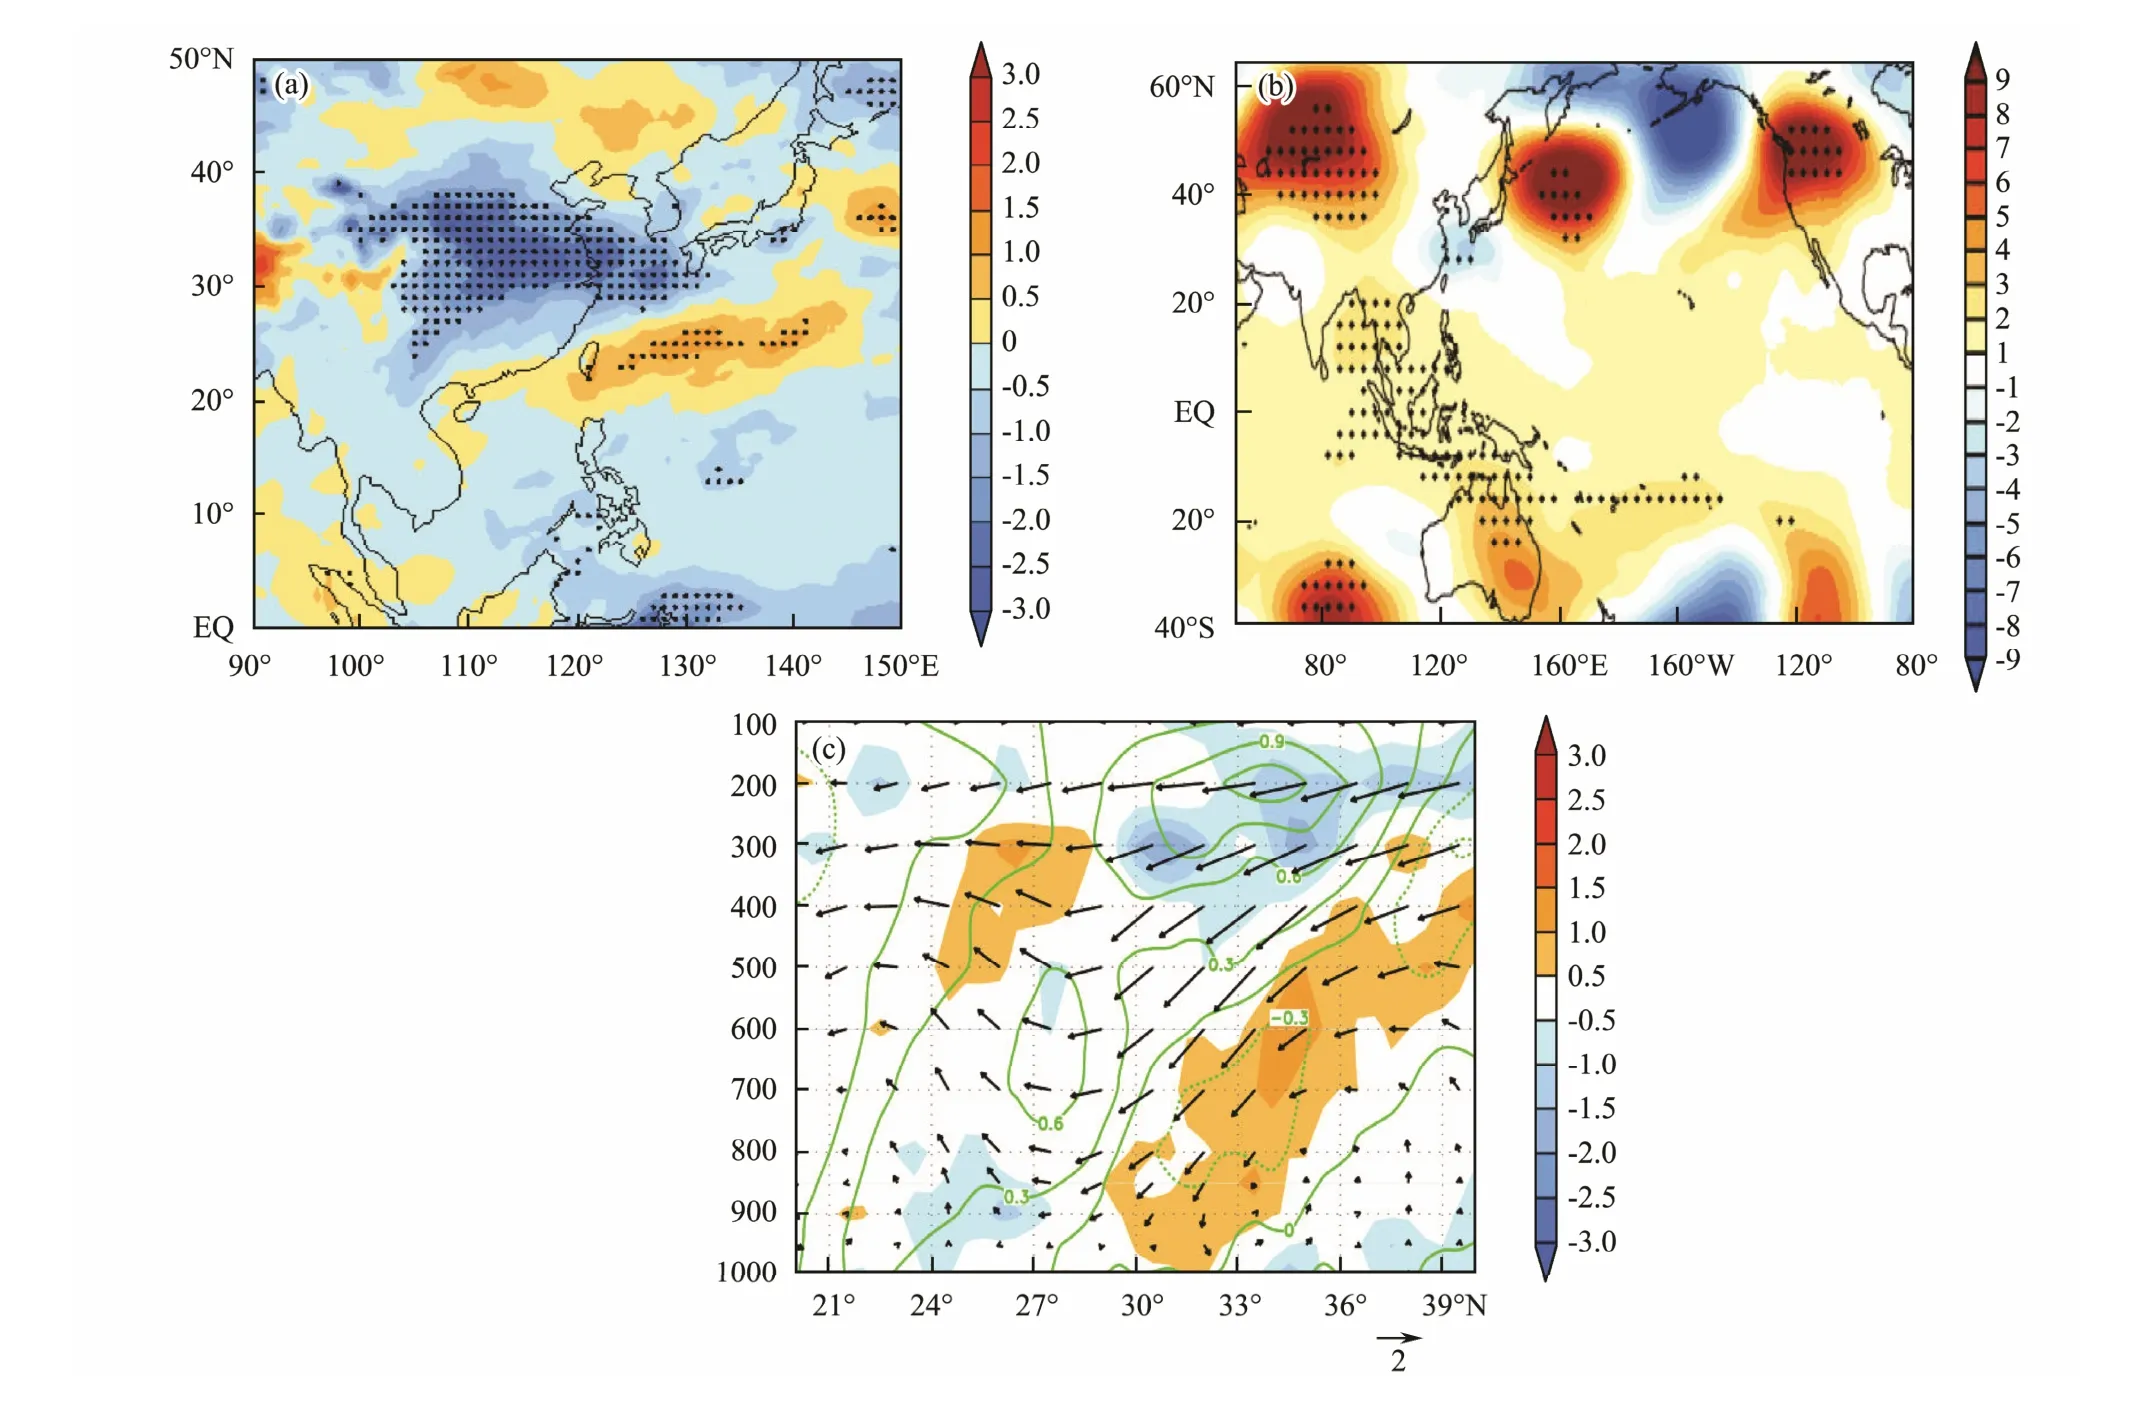
As shown in Fig.3a, the regression file of relative humidity at 850 hPa to PC1 shows a positive center over YRB,which is consistent with the spatial pattern of the precipitation anomaly. The result implies that the positive rainfall in the first mode is mainly due to sufficient water vapor.
The regression file of the 500 hPa geopotential height for PC1 shows positive values over the tropical region,and the northern part of the Philippines shows apparent positive anomalies. Negative centers occur over mid- latitudes (Fig.3b).
The composite of the geopotential height field implies that the subtropical high is stronger during positive PC1 years. As shown in Fig.3c, the position of the West Pacific subtropical high extends to the west significantly,which indicates that the subtropical high is abnormally strong in a positive PC1 year. Thus, there may be anomalous southwesterly winds northwest of the enhanced subtropical high.
In the regression field of the 850 hPa wind to PC1, there are significant anomalous winds, mainly in three areas(Fig.4a). The central equatorial Pacific has a considerable anomalous westerly wind, corresponding to the SST anomaly distribution of the El Niño pattern. There is an abnormal easterly wind over the equatorial Indian Ocean, which corresponds to the SST distribution of the positive phase of the IOD (Drbohlavet al., 2007; Xie and Hu, 2008) in the tropical Indian Ocean (Fig.4b). There is an abnormal anticyclonic circulation center in the Bay of Bengal. After crossing the Indochina Peninsula, the westerly flow to the northeast of the center changes to a southwest flow and enters the southwestern area of China. The circulation merges with the southwest flow in the western part of the Philippine abnormal anticyclonic circulation (Wanget al.,2000) and forms a large-scale southwest flow in southern China (Heet al., 2015). Therefore, the positive anomaly of water vapor flux mentioned above is formed in South China. At the same time, the YRB region is located on the left side of the low-level southwest wind. There is significant convergence and positive vorticity in the area with sufficient water vapor, forming a positive precipitation anomaly.
4.2 Second Mode
In the 850 hPa relative humidity field (Fig.5a), there is an apparent negative value region in central and eastern China.According to the 200 hPa geopotential height (Fig.5b),there is a significant positive anomaly center over Baikal Lake. East and central China are located on the southeast side of the positive center of anomalous geopotential height,which is easily affected by the northerly wind induced by high pressure, meaning that during the positive phase of PC2, most of the eastern part of China is affected by the stronger north wind (Guoet al., 2019). As shown in Fig.5c, there is a significant anomalous northerly wind in the eastern part of China in the positive years of PC2. To the north of 28°N, there are positive vorticity anomalies and negative divergence anomalies at high levels. At the same time, there are negative vorticity anomalies and positive divergence anomalies at low levels, as well as abnormal subduction, which means that the convection in this area is weakened. Therefore, precipitation corresponds to a negative value (Fig.2). However, south of 28°N, there is an abnormal increase in precipitation in the positive PC2 years. This result implies that the second mode is related to the influence of the cold air system on the YRB region.
At the same time, we also found that there is a weak warm pool-East Asia (WP-EA) teleconnection wave train(Zhenget al., 2013) in the 200 hPa geopotential height field. Furthermore, positive and negative vorticity centers from the South China Sea to the north of Japan can be seen at 200 hPa. There is an anomalous positive vorticity center and cyclonic circulation over the north side of the YRB at 200 hPa, which is not conducive to the generation of convective precipitation, so the north side of the YRB shows a negative precipitation anomaly during positive PC2 years.

Fig.3 Regressions of (a) 850 hPa relative humidity field and (b) 500 hPa geopotential height anomaly field to PC1 (black dots indicate significant regions at 90% confidence level); (c) 500 hPa geopotential height in positive PC1 years (red lines),negative PC1 years (green lines), and climatology mean (black lines).

Fig.4 (a) Regression of wind (m s-1) and divergence (×106) at 850 hPa (vectors are drawn if winds are significant at 90% or better); (b) correlation coefficients between the SST anomaly and PC1 (black dots indicate significant regions at 90% confidence level).

Fig.5 Regressions of (a) 850 hPa relative humidity field and (b) 500 hPa potential height anomaly field for PC2 (black dots indicate significant regions at 90% confidence level); (c) regressions of vorticity (contour), divergence (shading), and wind(the vertical wind was multiplied by 100) for PC2.
From the correlation field between SST and PC2, the second mode corresponds to the central Pacific El Niño(Fig.6c). The intensity of the central Pacific El Niño is weaker than that of the eastern Pacific El Niño. The anomalous anticyclone in the Philippine Sea area is weaker,so the anomalous circulation affects only the southeastern part of China. This is also one of the reasons for the northsouth dipole pattern shown in the second mode.
In conclusion, the second mode of precipitation is related to both the cold air from the north and the tropical SST anomaly.
5 Prediction of the Two Leading Modes
Through the previous analysis, it is found that the dominant influencing factors of the first mode are the tropical SST anomalies. The dominant influencing factor of the second mode is not only the tropical SST anomalies but also the cold air activities in the north. Therefore, in this section, we will use the large-scale environmental variables to explore the prediction equations of the precipitation modes.
5.1 First Mode
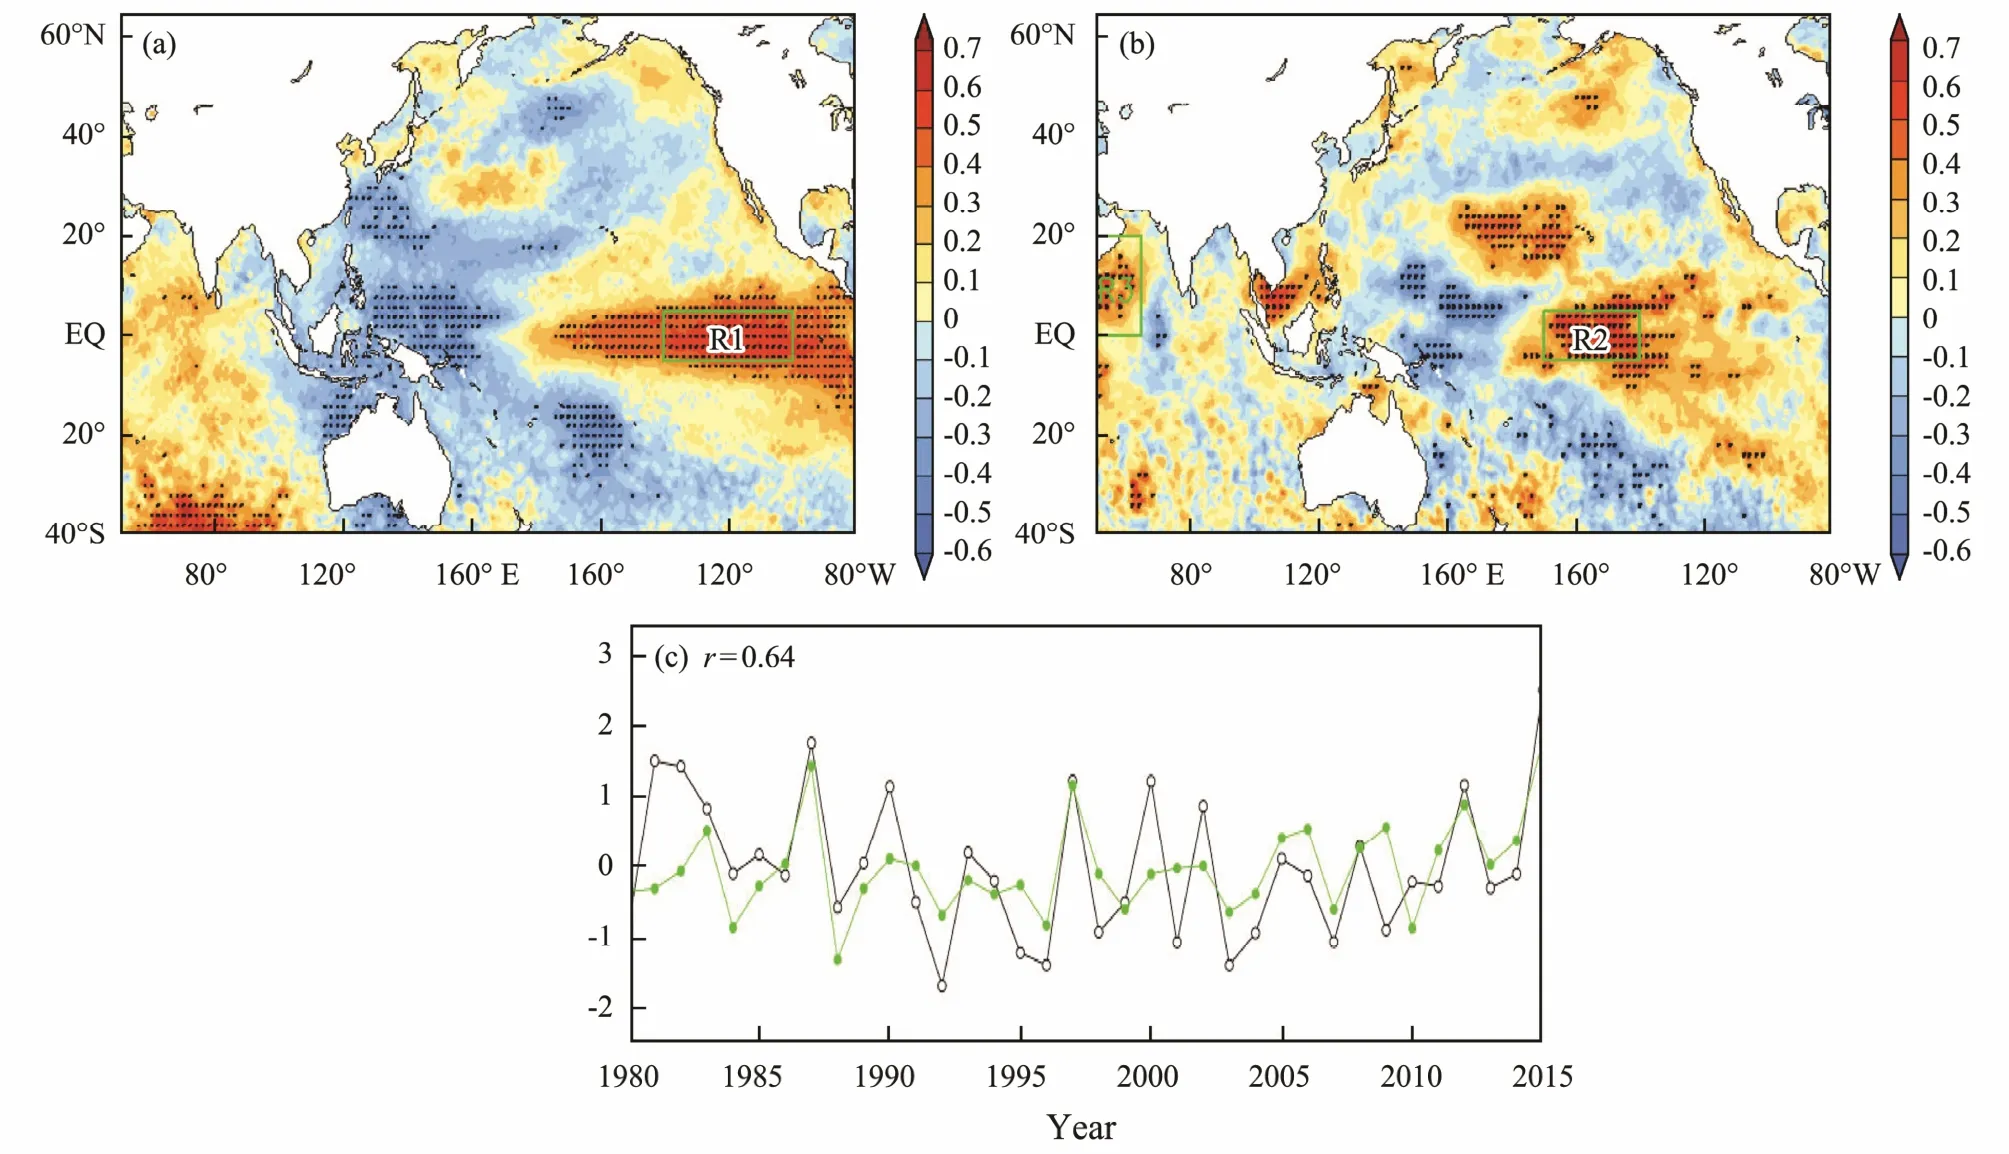
The main factors affecting the first mode of precipitation in the YRB region are the eastern Pacific ENSO and IOD. These two large-scale SST anomalies occur in the early summer. From the correlation coefficient distribution of PC1 and summer SST, we can see that PC1 has a good correlation with the SST anomaly of the eastern equatorial Pacific (100°-120°W, 5°S-5°N) in summer because the development of ENSO lasts from summer to winter (Fig.7a). Therefore, the SST in the eastern equatorial Pacific can be used as one of the predictors of PC1.At the same time, because the eastern Pacific ENSO is growing continuously in its development stage and extending from east to west, the growth of the central Pacific SSTA can be used as the second predictive factor(Fig.7b).
In addition, TIO also causes the first mode of precipitation in the YRB area. The development of IOD can also be found in the summer SST. As shown in Fig.7b, the correlation between the SST anomaly tendency from July to August and PC1 shows that there will be significant warming in the Northwest Indian Ocean,i.e., the west pole of the IOD. Therefore, the increase in the SST anomaly in the western tropical Indian Ocean is regarded as the third predictive factor.
We use three predictors to obtain the regression equation as follows:

R1 is defined as the regional averaged SST anomaly in JJA over the region (140°-100°W, 5°S-5°N). R2 is defined as the averaged SST tendency from July to August over the region (170°-140°W, 5°S-5°N). R3 is defined as the averaged SST tendency from July to August over the region (50°-65°E, 0°-20°N).
The three indexes passed the stepwise regression test.Based on the effect of the regression (Fig.7c), the stepwise regression sequence can better reflect the interannual change trend in the precipitation field, and the correlation coefficient between the predictive function and PC1 is 0.65.

Fig.6 Regression of wind (m s-1) and vorticity (×105) at (a) 200 hPa and (b) 850 hPa (Vectors are drawn if winds are significant at 90% or better). (c) correlation coefficients between the SST anomaly and PC2 (black dots indicate significant regions at 90% confidence level).

Fig.7 Correlation coefficients between PC1 and (a) JJA SST, (b) SST difference from July to August. Green boxes indicate the regions where R1, R2, and R3 are generated. Black dots indicate significant regions at 90% confidence level. (c) PC1(black line) and the prediction function P1 (green line).
5.2 Second Mode
The second mode of precipitation in the YRB area is not only related to the central Pacific ENSO but also to the influence of cold air in the region. Therefore, the forecast factors should consider both changes in the tropical SST and changes in the atmospheric circulation over middle and high latitudes.
Fig.8a shows the correlation between the SST anomalies and PC2 in the early stage of ENSO development in summer. In addition, during the development of ENSO,the SST in the western Pacific Ocean is further cooling,which can also be used as one of the predictive factors of PC2 (Fig.8b). At the same time, the 500 hPa atmospheric potential height anomaly affecting PC2 also appears in summer (Fig.8c), although the location shifts to easterly.Therefore, the predictive equation of PC2 can be constructed using the following three factors:

R4 is defined as the regional averaged SST anomaly in JJA over the region (170°-150°W, 15°S-10°N). R5 is defined as the averaged SST tendency from July to August over the region (160°E-180°, 10°S-10°N). R6 is defined as the averaged geopotential height at 500 hPa in JJA over the region (90°-115°E, 36°S-50°N).
As shown in Fig.8d, the regression function can reflect the interannual variation in PC2, and the correlation coefficient between them is 0.60, which exceed the 99% confidence level.

Fig.8 Correlation coefficients between PC2 and (a) JJA SST, (b) SST difference from July to August, and (c) geopotential height at 500 hPa. Red boxes indicate the regions where R4, R5, and R6 are generated. Black dots indicate significant regions at 90% confidence level. (d) PC2 (black line) and the prediction function P2 (green line).
6 Discussion and Summary
Based on the precipitation data from 109 stations and reanalysis data, this paper studies the characteristics of autumn precipitation in the YRB region. We then investigated the possible causes of the interannual variation.Combined with the results of the correlation and regression analyses of related large-scale factors, the forecast of the two leading modes is realized by constructing regression equations.
The interannual variation in the first mode is mainly due to the enhancement of the Philippine anticyclone caused by the eastern Pacific El Niño and TIO. The interannual variation in the second mode may be affected by the early withdrawal of the summer monsoon system and the influence of cold air in the north. The variation may also be affected by the central Pacific El Niño. The first mode can be predicted by using the SST signals of ENSO and TIO in summer. The prediction of the second mode requires the simultaneous consideration of the influence of the central Pacific SST anomaly and mid- latitude atmospheric circulation.
In this paper, the physical mechanism of the two leading modes of precipitation is analyzed by regression analysis in the same period of autumn. The two leading modes are then predicted by the SST and atmospheric circulation anomalies. However, for the second EOF mode, the prediction skill is superior prior to 2004, and deteriorates after 2005. The lower prediction skill after 2005 is induced by the smaller amplitude of PC2 during these years.When we use the correlation or regression analysis to determine the key large-scale environmental factors, the results have been dominated by the larger amplitude period before 2005 through their larger variance. The variance in prediction error does not grow after 2005, implying that the predictors are still effective after 2005. In addition, the variance contributions of these two modes combined accounts for approximately 50% of the total amount, and the analysis of other modes requires further discussion.
Acknowledgements
We appreciate use of the reanalysis data provided by the European Center for Medium-Range Weather Forecasts and the daily precipitation data released by the China Meteorological Administration. This work is supported by the National Natural Science Foundation of China (NSFC)(Nos. 41975061 and 41605037).
 Journal of Ocean University of China2021年4期
- Journal of Ocean University of China的其它文章
- Environmental Drivers of Temporal and Spatial Fluctuations of Mesozooplankton Community in Daya Bay,Northern South China Sea
- The Nitrogen-Cycling Network of Bacterial Symbionts in the Sponge Spheciospongia vesparium
- Improvement on the Effectiveness of Marine Stock Enhancement in the Artificial Reef Area by a New Cage-Based Release Technique
- Relationship Between Shell Color and Growth and Survival Traits in the Pacific Oyster Crassostrea gigas
- Comparison of the Digestion and Absorption Characteristics of Docosahexaenoic Acid-Acylated Astaxanthin Monoester and Diester in Mice
- Morphology and Molecular Phylogeny of Two Marine Folliculinid Ciliates Found in China (Ciliophora, Heterotrichea)
