Cotton market fundamentals & price outlook, June 2021
Released by Cotton Incorporated
Recent price movement
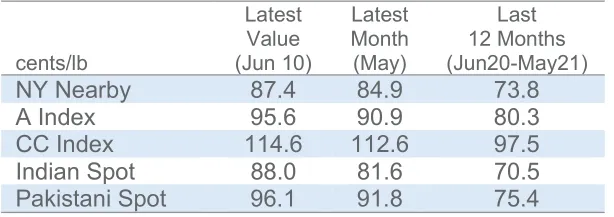
Indian and Pakistani prices increased over the past month, while NY/ICE futures,the A Index, and Chinese cotton prices fell and rebounded.
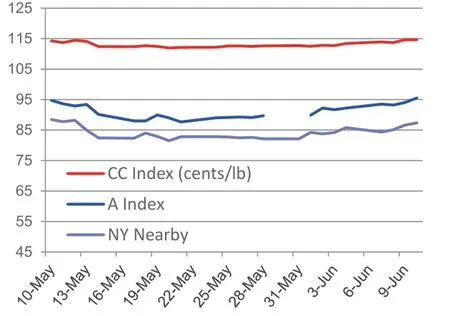
• After sliding from 87 to 81 cents/lb in the first half of May, values for the De—cember NY/ICE futures contract began to climb. Recent values are near 88 cents/lb.

Recent Price Data

NY Futures, A Index, and CC Index Fell and Rebounded
• The A Index fell from 96 to 88 cents/lb in the first half of May. The latest value is 94 cents/lb.
• Movement in the China Cotton Index(CC Index 3128B) was slight by compari—son. Values easing from 114 to 112 cents/lb around the middle of May and then re—bounded back to 114 cents/lb. In domestic terms, prices moved between 15,700 and 16,200 RMB/ton. The RMB strengthened against the USD from 6.43 to 6.39 RMB/USD.
• Indian spot prices moved higher,with values rising from 80 to 88 cents/lb(Shankar—6 quality). In domestic terms,values rose from 46,000 to 50,100 INR/candy. The INR was stable against the dollar last month, holding near 73 INR/USD.
• Pakistani spot prices increased from 90 to 96 cents/lb. In domes—tic terms, values rose from 11,300 to 12,300 PKR/maund. The PKR weak—ened against the dollar from 153 to 155 PKR/USD.
SUPPLY, DEMAND, & TRADE
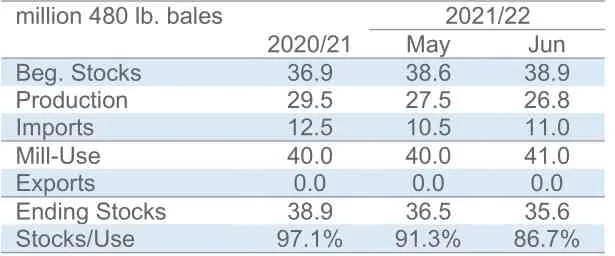
The latest USDA report featured a slight reduction to the 2021/22 produc—tion forecast (—570,000 bales to 118.9 million) and an increase to the projection for 2021/22 mill—use (+1.1 million bales to 122.5 million). Changes to 2020/21 estimates resulted in a minor downward adjustment to 2021/22 beginning stocks(—113,000 bales to 93.0 million). A net effect was a —1.7 million bale reduction to the forecast for 2021/22 ending stocks (to 89.3 million). Excluding the period when China was holding massive supply in its reserves (2012/13—2015/16), the projec—tion for 2021/22 would rank as the third—highest on record.
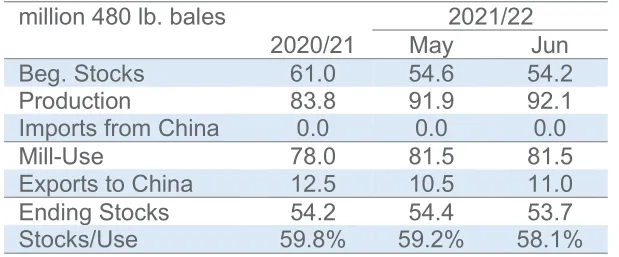
At the country—level, the only notable changes to 2021/22 production figures were for China (—750,000 bales to 26.8 million) and Tanzania (+125,000 bales to 500,000).
For mill—use, the largest country—level revisions for 2021/22 were for India(—500,000 bales to 25.0 million), Turkey(+200,000 bales to 8.2 million), Bangla—desh (+400,000 bales to 8.4 million), and China (+1.0 million bales to 41.0 million).
The global trade forecast for 2021/22 was increased 1.1 million bales to 46.6 mil—lion bales. In terms of imports, the largest revisions were for Turkey (+200,000 bales to 5.2 million), Bangladesh (+400,000 bales to 8.0 million), and China (+500,000 bales to 11.0 million). For exports, the larg—est changes were for the U.S. (+100,000 bales to 14.8 million), Tanzania (+100,000 bales to 325,000), Australia (+200,000 bales to 3.4 million), and Brazil (+250,000 bales to 9.3 million).
PRICE OUTLOOK
Although the world has ample supply,a potential source of concern has been the level of U.S. stocks. In the 2020/21 crop year, the U.S. experienced tightening that more than erased the build up in 2019/20.The potential for a similar set of condi—tions in 2021/22 has fed anxiety that the world’s largest exporter could effectively sell out.
Principal causes of the reduction in U.S. stocks in 2020/21 were a smaller harvest and strong export demand. The weather pulled U.S. production lower in 2020/21. This included drought in West Texas and the series of hurricanes along the Gulf and Atlantic coasts. Meanwhile,U.S. exports are expected to reach 16.4 million bales. This ranks as the second—highest volume on record. Near—record ex—ports are remarkable given that 2020/21 fell entirely within the COVID pandemic.While shipments to most markets are down 15% or more year—over—year, de—liveries to China are up more than 200%.Much of the strength of Chinese demand for U.S. fiber may be related to the Phase One deal.

World Balance Sheet

China Balance Sheet

World-Less-China Balance Sheet
Over the past few months, it appeared that the U.S. could face a similar set of circumstances in the upcoming 2021/22 crop year that brought about the tightening in 2020/21. Weather conditions early in the U.S. planting season included drought in much of West Texas. There is always uncertainty predicting hur—ricane activity, but La Nina conditions and last year’s record num—ber of storms suggest that the 2021/21 crop year could also be active. For exports, the Phase One deal remains in effect through the end of the 2021 calendar year. Beyond China, vaccinations and progress against COVID are expected to drive robust global economic growth. The improvement in macroeconomic condi—tions can be anticipated to support growth in global mill demand.In turn, this could result in growth in import demand for cotton from the U.S. and other markets.
As long as vaccines continue to promise effectiveness against variants, the argument for a general improvement in demand appears to remain valid. However, there is uncertainty surrounding the outlook for U.S. sales to China. Little has been revealed regarding what may follow the initial round of Phase One, and questions surrounding the subsequent agreement may linger until late in the calendar year.
In the meantime, a challenge to the outlook suggesting U.S.supplies could pull tight has emerged from the supply side. Rain has fallen over West Texas, and most of the region has moved out of drought. Another round of moisture in the summer will be important, but these early rains promise to support germination and reduce the threat of abandonment on the scale suffered in 2020/21.
Cotton prices did move lower after the rainfall in West Texas but have since rebounded. The trade environment between the U.S. and China has proven influential to prices over the past couple of years. Whatever is negotiated to follow Phase One can be expected to be reflected in prices.
- China Textile的其它文章
- Spandex price survey: demand greater than supply
- Supply and demand of yarn market forecast in the second half of year
- As price goes up and down, how the fabric enterprises survive?
- 2020/2021 China garment market development report
- Dye production decreased but is expected to pick up
- Prosperity index of the national textile and apparel specialized market declined overall

